


 text in
  English (pdf)
 Article in xml format
 Article references
 Send this article by e-mail
 Cited by SciELO
  Similars in
SciELO
Similars in
SciELO 
 Permalink
1. Introduction
The use of unbonded tendons in building construction is frequent in developed countries like the USA and Australia, as well as parts of the Middle East, Southeast Asia, United Kingdom and in some South American countries. The choice of its use is due to excellent structural performance and economic advantages (Aalami, 2000; Santos, 2017; Silva et al., 2018).
Unbonded tendons were included in standard ACI 318 of the American Concrete Institute from 1963 and onwards after its use in several construction projects around the world (Aalami, 2000; Kang and Bondy, 2008). In Brazil, the use of unbonded tendons in post-tensioned flat slabs started only in 1997 (Carvalho, 2017). This was partially driven by architectural designs with wide spans and reduced number of pillars and beams in upscale residential buildings (Santos, 2017; Almeida, 2001; Loureiro, 2006). Other decisive factors that promoted the effective application of post-tension concrete in civil construction were the development of high strength steel, advancements in design software and its relative ease of execution (Carvalho, 2017; Loureiro, 2006).
Prestressing has economic benefits and improves performance throughout the projected service life (PSL) and structural safety of concrete. In particular, it improves durability as the prevention or decrease in fissuring inhibits corrosion and ensures greater protection to the reinforcement (NBR 6118, 2014; Cholfe and Bonilha, 2018; Silva, 2003).
In flat slabs with post-tensioned unbonded tendons, the strands are usually placed in a parabolic arch which produces an eccentricity with respect to the center of the slab. This allows an increase in the loads applied to the strands and also increases the load balancing capacity (Pfeil, 1984; Vicente and Albino, 1994). The basic principle of load balancing is to allow the vertical portion of the tendons stress to balance out part of the dead load and result in a structure subjected only to compressive stresses (Silveira, 2002; Aalami, 1990; Aalami and Bommer, 1999). In order to accomplish this, vertical tendon placement must be as close as possible as projected. Incorrect vertical placement could lead to negative consequences such as different center deflection from predicted values and, in more severe cases, even structural collapse (Silva et al., 2018; Aalami and Bommer, 1999; Romanichen and Souza, 2019).
In order to ensure vertical strand placement in accordance to projected values, spacers are used in regular intervals. Mass-produced spacers are made from plastic or steel with rigorous quality control with respect to height. However, in some exceptional cases, spacers are manufactured in situ with folded steel bars and inadequate quality control, resulting in variations in height (Loureiro, 2006; Aalami, 2014). Furthermore, other factors such as improper handling of the reinforcement or damage to it during pouring of concrete can lead to breaking or displacement of spacers as shown in Figure 1. Even with proper quality control, there is a human factor that can result in incorrect placement of spacers during tendon assembly. The end result of all these factors are strands placed at heights and eccentricities different than projected.
The incorrect placement of strands can lead to slab fissuring, excessive vertical displacements and loading stresses different from predicted to the point of exceeding projected limits of tension and compression in the structural element. Further effects can occur such as concrete flaking and acceleration of steel corrosion due to insufficient cover (Souza, 2018; Xin and Xianyan, 2012).
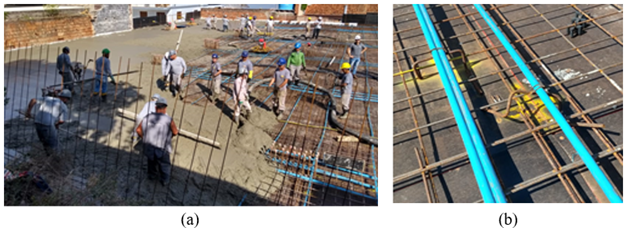
Figure 1 Concrete pouring example: (a) workers in direct contact with the reinforcement and (b) damaged and out of position spacer.
The correct vertical positioning of strands in accordance with projected values during the assembly stage has been cited as the main factor affecting system performance (Carvalho, 2017; Souza Junior and Oliveira, 2016; Caro et al., 2013). Cauduro (2002) recommended a maximum tolerance of +/- 5 mm in vertical variations of stand placement for slabs of less than 200 mm thick and +/- 10 mm for slabs between 200 mm and 600 mm thick. The most critical locations were the low and high points in the curvature, while horizontal position was not as crucial but excessive variation should be avoided. However, acceptable variations in absolute deviation, which were independent of structural geometry and applied loads, could still lead to an unsafe structural condition. Variations in tendon eccentricity could have an effect depending on slab thickness, relative eccentricity error, span width between pillars and applied load.
This study evaluated the effect of variations in eccentricity of tendons in flat, post-tensioned slabs. Several models were tested with different spans and relative error in eccentricity. The post-tensioned slabs were projected in accordance with standard ABNT NBR 6118:2014 and recommendations from ACI 318:2019.
2. Methodology
2.1 Slab Geometry and Strand Layout
The structural models consisted of a single slab supported directly by pillars and without beams as shown in Figure 2. The span between pillars was constant for each model. Four models were manufactured with spans of 7.0 m x 7.0 m to 10.0 x 10.0 m in 1 m increments and were designated M7, M8, M9 and M10. The slab thickness varied for each model and were defined approximately as L/42 (ACI 318, 2019), where L is the span between pillars. The characteristics of each model are shown in Table 1.
Strand layout concentrated tendons along the larger direction (in this case, Strands 1 through 3 in the x-direction) and a more regular distribution was applied in the perpendicular direction (in this case, Tendons 1 through 27 in the y-direction) as seen in Figure 3. The analyses were exclusive to central Strand 2 in the x-direction since it concentrated the most loads and should be the most affected by variations in eccentricity of each model. The number of tendons in central Strand 2 for models M7, M8, M9 and M10 were 10, 17, 25 and 33, respectively. Also shown in Fig.3 are the locations of the pillars, labeled P1 through P12.

Table 1 Model designations and dimensions
| Designation | Span between pillars | Slab thickness | |
|---|---|---|---|
| Model | M7 | 7.0 m x 7.0 m | 170 mm |
| M8 | 8.0 m x 8.0 m | 190 mm | |
| M9 | 9.0 m x 9.0 m | 210 mm | |
| M10 | 10.0 m x 10.0 m | 240 mm |

The variations in eccentricity are shown schematically in Figure 4. Concave down eccentricities curving towards the top of the slab were placed on locations above pillars while concave up eccentricities towards the bottom of the slab were placed in the span between pillars. Three test cases of variation of eccentricity were tested. In the first case, only concave down eccentricity (designated “Top”) was reduced over pillars P6 and P7. In the second case, only concave up eccentricity in was reduced in the span between pillars (designated “Bottom”). In the third case, a simultaneous decrease in eccentricity in both locations was applied in order to obtain a critical combination (designated “Critical”).
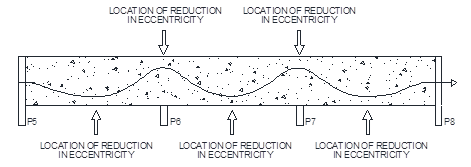
Figure 4 Variation of eccentricity along center Strand 2 and locations of reduction of eccentricity.
A total of 4 variations of eccentricity were applied to each of the 4 models shown in Table 1, designated hypothesis H1 through H4. The variations in eccentricity were of 5 mm, 10 mm, 15 mm and 20 mm. These variations were selected because projected spacer heights are usually listed in 5 mm increments and it would also allow easier and practical verification in loco. Additionally, Cauduro (2002) established that decreases in eccentricity should be limited to 5 mm and 10 mm for slab thicknesses equal or larger than the ones of this study. The variations of eccentricity and their designations are shown in Table 2.
Table 2 Designations of variations in eccentricity of this study.
| Variation | Designation | Decrease in eccentricity (mm) |
|---|---|---|
| Reference | H0 | 0 |
| Hypothesis 1 | H5 | 5 |
| Hypothesis 2 | H10 | 10 |
| Hypothesis 3 | H15 | 15 |
| Hypothesis 4 | H20 | 20 |
For the analysis, the spans with decreased eccentricity were labeled “First” between P5 and P6, “Central” between P6 and P7 and “Final” between P7 and P8. These are shown in Figure 5.

2.2 Materiais and Reference Parameters
Concrete covers were 2.5 cm for slabs with passive reinforcements and 3.0 cm for active reinforcements. In the numerical models, a C35 class concrete was adopted with a fck of 35.0 MPa and modulus of elasticity (E) of 39.7 GPa. The tendons used were CP 190 RB (fptk = 1,900 MPa), nominal diameter of 12.7 mm and nominal steel area of 100.9 mm².
A variable (over)load of 2.5 kN/m² was applied to the slab, which corresponded to the minimum value recommended in standard NBR 6120 (ABNT, 2019). A dead load consisting of the structure’s own weight based on slab thickness and a permanent load of 1.0 kN/m² representing other materials was also present.
The numerical analysis considered three fundamental parameters: minimum pre-compression strength, tensile normal stress limit and maximum vertical displacement. Other criteria such as load balance and final displacements were adjusted once these fundamental parameters were reached. Afterwards, the slabs were loaded in order to test projected service life (PSL) and useful service life (USL). The pre-compression stress at any point in the slab was kept at a minimum of 1.0 MPa in accordance with ACI 318 (ACI, 2019) and NBR 6118 (ABNT, 2014). In pre-testing, models in which the pre-compression stress of 1.0 MPa was insufficient to produce the tensile normal stress limit or maximum vertical displacements, the number of tendons was increased until these parameters were reached.
Whenever possible, a load balance parameter between 60% and 80% of the permanent load was adopted. This range of values was commonly used in slabs of residential and commercial buildings and parking garages (Loureiro, 2006).
A limited stress was defined in accordance with standard NBR 6118 (ABNT, 2014). As described, the tension stress of a flat slab was defined as sufficient for fissure formation at PSL (f-PSL) from a combination of loads under any class of environmental aggression. In this case, the normal compressive stress applied to the concrete when stressing was limited to 15.75 MPa while the f-PSL threshold stress was 21.0 MPa in accordance with standard ACI 318 (ACI, 2019).
Standard NBR 6118 (ABNT, 2014) defined minimum measurable vertical displacements in beams and slabs as L/250, where L is the span in between pillars. This value was used as a limit in the numerical models before variations in eccentricity of the strands were introduced. After the variations in eccentricity were introduced, analyses were performed to confirm which models were still within limits. Through this methodology, passive reinforcements, strand placement and maximum acceptable strand eccentricity were determined for each model. Passive bottom and top reinforcements were determined for the models based on criteria from standard NBR 6118 (ABNT, 2014). The combined criteria and limits used in the slabs are presented in Table 3.
2.3 Slab Analysis
Slabs were analyzed with Adapt Floor 2017 PRO commercial software. This program specialized in the design and analysis of post-tensioned concrete structures with a finite element method. The program evaluated the effects of post-tensioning in accordance with geometry and loading on the strands.
Adapt Floor 2017 PRO provided automatic mesh generation with user input on the size of elements. Two maximum element sizes were tested in this study and the results showed no significant differences. Consequently a maximum element size of 500 mm was used for all analyses. A sample mesh for model M8 is shown in Figure 6.
Table 3 Model criteria and limits with references.
| Criteria | Limit | Parameter | Units | Reference |
|---|---|---|---|---|
| Pre-compression stress | Minimum | 1 | MPa | NBR 6118, ACI 318 |
| Top and bottom tensile stress | Maximum | 3.38 | MPa | NBR 6118 |
| Maximum compression stress at post-tensioning | Maximum | 15 | MPa | ACI 318 |
| Maximum compression stress for f-PSL | Maximum | 21 | MPa | ACI 318 |
| Load balance | Recommended | 60 a 80 | % | Loureiro (2006), Hanai (2005) |
| Vertical displacement | Maximum | L/250 | - | NBR 6118 |
Slab model analysis made use of support lines aligned with pillar positions. Each support line defined “design sections” with average stress values which compiled stresses from surrounding areas delimitated by the support lines.

Figure 7 shows normal stresses in the x-direction on the top and bottom faces of the slab for the most frequent combination in model M8.
3. Results and discussion
3.1 Pre-compression stresses
Table 4 presents pre-compression normal stress values on the slabs. No variations in stress were identified with respect to changes in the vertical position of the strands but rather with respect to the number of tendons and applied load. As the span between pillars increased, an increasing number of tendons were necessary to balance the models, resulting in a corresponding increase in pre-compression stress. The shortest span Model M7 presented stresses in between 1.0 MPa and 1.11 MPa while the longest span Model M10 had stresses between 1.43 MPa and 1.60 MPa.

Table 4 Pre-compression normal stresses on the slab (MPa).
| Modelo | M7 | |||||||||||||
|---|---|---|---|---|---|---|---|---|---|---|---|---|---|---|
| Caso | Referência | Topo | Base | Crítico | ||||||||||
| Hipótese | H5 | H10 | H15 | H20 | H5 | H10 | H15 | H20 | H5 | H10 | H15 | H20 | ||
| Vão entre pilares | Primeiro | 1 | 1 | 1 | 1 | 1 | 1 | 1 | 1 | 1 | 1 | 1 | 1 | 1 |
| Central | 1,11 | 1,11 | 1,11 | 1,11 | 1,11 | 1,11 | 1,11 | 1,11 | 1,11 | 1,11 | 1,11 | 1,11 | 1,11 | |
| Último | 1,01 | 1,01 | 1,01 | 1,01 | 1,01 | 1,01 | 1,01 | 1,01 | 1,01 | 1,01 | 1,01 | 1,01 | 1,01 | |
| Modelo | M8 | |||||||||||||
| Caso | Referência | Topo | Base | Crítico | ||||||||||
| Hipótese | H5 | H10 | H15 | H20 | H5 | H10 | H15 | H20 | H5 | H10 | H15 | H20 | ||
| Vão entre pilares | Primeiro | 1,27 | 1,27 | 1,27 | 1,27 | 1,27 | 1,27 | 1,27 | 1,27 | 1,27 | 1,27 | 1,27 | 1,27 | 1,27 |
| Central | 1,36 | 1,36 | 1,36 | 1,36 | 1,36 | 1,36 | 1,36 | 1,36 | 1,36 | 1,36 | 1,36 | 1,36 | 1,36 | |
| Último | 1,31 | 1,31 | 1,31 | 1,31 | 1,31 | 1,31 | 1,31 | 1,31 | 1,31 | 1,31 | 1,31 | 1,31 | 1,31 | |
| Modelo | M9 | |||||||||||||
| Caso | Referência | Topo | Base | Crítico | ||||||||||
| Hipótese | H5 | H10 | H15 | H20 | H5 | H10 | H15 | H20 | H5 | H10 | H15 | H20 | ||
| Vão entre pilares | Primeiro | 1,53 | 1,53 | 1,53 | 1,53 | 1,53 | 1,53 | 1,53 | 1,53 | 1,53 | 1,53 | 1,53 | 1,53 | 1,53 |
| Central | 1,75 | 1,75 | 1,75 | 1,75 | 1,75 | 1,75 | 1,75 | 1,75 | 1,75 | 1,75 | 1,75 | 1,75 | 1,75 | |
| Último | 1,53 | 1,53 | 1,53 | 1,53 | 1,53 | 1,53 | 1,53 | 1,53 | 1,53 | 1,53 | 1,53 | 1,53 | 1,53 | |
| Modelo | M10 | |||||||||||||
| Caso | Referência | Topo | Base | Crítico | ||||||||||
| Hipótese | H5 | H10 | H15 | H20 | H5 | H10 | H15 | H20 | H5 | H10 | H15 | H20 | ||
| Vão entre pilares | Primeiro | 1,43 | 1,43 | 1,43 | 1,43 | 1,43 | 1,43 | 1,43 | 1,43 | 1,43 | 1,43 | 1,43 | 1,43 | 1,43 |
| Central | 1,6 | 1,6 | 1,6 | 1,6 | 1,6 | 1,6 | 1,6 | 1,6 | 1,6 | 1,6 | 1,6 | 1,6 | 1,6 | |
| Último | 1,5 | 1,5 | 1,5 | 1,5 | 1,5 | 1,5 | 1,5 | 1,5 | 1,5 | 1,5 | 1,5 | 1,5 | 1,5 | |
3.2 Maximum normal stresses on the slab
Normal tensile stresses on the bottom face of the slab are shown in Table 5 for all models. Despite changes to eccentricity through vertical position of the strands, all models were within the maximum limit of 3.38 MPa for f-PSL set by standard NBR 6118 (ABNT, 2014). In the case of the “Central” span of the Reference model, compressive stresses were found on the bottom face of the slab due to higher prestresses when compared to the “First” and “Final” spans. Less variation in stresses were observed for the variations of eccentricity of the “Top” cases when compared to the “Bottom” cases. Still, “Critical” combination cases produced the most unfavorable stresses.
Results for the stresses in the top face of the slab are summarized in Table 6. Stresses that exceeded the limit set by standard NBR 6118 (ABNT, 2014) were highlighted in yellow. Only stresses of the “Top” cases and hypothesis H5 were within the limit of 3.38 MPa. Decreases in eccentricity of the “Bottom” cases produced a greater increase in normal tensile stresses along the top face of the slab, especially in the regions supported by the pillars when compared to other locations. Models M7 and M9 with hypothesis H5 were the only slabs in which variations of eccentricity of the “Bottom” cases had normal tensile stresses lower than the limit of 3.38 MPa. Furthermore, no normal stresses for the most frequent “Critical” combination cases in all hypotheses of variations in eccentricity were below the 3.39 MPa limit for f-PLS.
Table 5 Normal tensile stresses at the bottom face of the slabs (MPa).
| Model | M7 | |||||||||||||
|---|---|---|---|---|---|---|---|---|---|---|---|---|---|---|
| Case | Reference | Top | Bottom | Critical | ||||||||||
| Hypothesis | H5 | H10 | H15 | H20 | H5 | H10 | H15 | H20 | H5 | H10 | H15 | H20 | ||
| Span | First | 2.37 | 2.39 | 2.42 | 2.45 | 2.47 | 2.45 | 2.54 | 2.63 | 2.72 | 2.48 | 2.6 | 2.71 | 2.83 |
| Central | -0.15 | -0.12 | 0 | 0.05 | 0.12 | -0.1 | 0 | 0.02 | 0.05 | -0.03 | 0.09 | 0.22 | 0.36 | |
| Final | 2.52 | 2.55 | 2.58 | 2.6 | 2.63 | 2.61 | 2.69 | 2.78 | 2.86 | 2.63 | 2.75 | 2.86 | 2.97 | |
| Model | M8 | |||||||||||||
| Case | Reference | Top | Bottom | Critical | ||||||||||
| Hypothesis | H5 | H10 | H15 | H20 | H5 | H10 | H15 | H20 | H5 | H10 | H15 | H20 | ||
| Span | First | 2.52 | 2.55 | 2.71 | 2.74 | 2.77 | 2.66 | 2.76 | 2.87 | 2.98 | 2.68 | 2.83 | 2.97 | 3.12 |
| Central | -0.62 | -0.5 | -0.5 | -0.4 | -0.3 | -0.6 | -0.5 | -0.4 | -0.4 | -0.5 | -0.3 | -0.2 | 0.01 | |
| Final | 2.48 | 2.51 | 2.54 | 2.57 | 2.61 | 2.58 | 2.69 | 2.79 | 2.9 | 2.62 | 2.75 | 2.89 | 3.03 | |
| Model | M9 | |||||||||||||
| Case | Reference | Top | Bottom | Critical | ||||||||||
| Hypothesis | H5 | H10 | H15 | H20 | H5 | H10 | H15 | H20 | H5 | H10 | H15 | H20 | ||
| Span | First | 2.64 | 2.65 | 2.71 | 2.74 | 2.77 | 2.66 | 2.76 | 2.87 | 2.98 | 2.68 | 2.83 | 2.97 | 3.12 |
| Central | -1.49 | -1.4 | -1.3 | -1.2 | -1.1 | -1.3 | -1.2 | -1.1 | -1 | -1.2 | -1 | -0.8 | -0.6 | |
| Final | 2.63 | 2.66 | 2.72 | 2.74 | 2.78 | 2.67 | 2.79 | 2.9 | 3.01 | 2.71 | 2.82 | 3.01 | 3.16 | |
| Model | M10 | |||||||||||||
| Case | Reference | Top | Bottom | Critical | ||||||||||
| Hypothesis | H5 | H10 | H15 | H20 | H5 | H10 | H15 | H20 | H5 | H10 | H15 | H20 | ||
| Span | First | 2.7 | 2.73 | 2.77 | 2.8 | 2.83 | 2.81 | 2.91 | 3.01 | 3.12 | 2.84 | 2.97 | 3.1 | 3.24 |
| Central | -1.41 | -1.33 | -1.24 | -1.15 | -1.07 | -1.34 | -1.27 | -1.2 | -1.13 | -1.26 | -1.1 | -0.93 | -0.77 | |
| Final | 2.69 | 2.73 | 2.76 | 2.79 | 2.82 | 2.8 | 2.9 | 3.01 | 3.11 | 2.83 | 2.97 | 3.1 | 3.24 | |
Table 6 Normal tensile stresses at the top face of the slabs (MPa).
| Model | M7 | |||||||||||||
|---|---|---|---|---|---|---|---|---|---|---|---|---|---|---|
| Case | Reference | Top | Bottom | Critical | ||||||||||
| Hypothesis | H5 | H10 | H15 | H20 | H5 | H10 | H15 | H20 | H5 | H10 | H15 | H20 | ||
| Span | P5 | 3.04 | 3.12 | 3.21 | 3.29 | 3.37 | 3.15 | 3.25 | 3.36 | 3.46 | 3.23 | 3.42 | 3.61 | 3.80 |
| P6 | 3.26 | 3.33 | 3.41 | 3.48 | 3.56 | 3.36 | 3.45 | 3.55 | 3.65 | 3.43 | 3.61 | 3.78 | 3.96 | |
| Model | M8 | |||||||||||||
| Case | Reference | Top | Bottom | Critical | ||||||||||
| Hypothesis | H5 | H10 | H15 | H20 | H5 | H10 | H15 | H20 | H5 | H10 | H15 | H20 | ||
| Span | P5 | 3.28 | 3.38 | 3.47 | 3.56 | 3.65 | 3.40 | 3.52 | 3.65 | 3.77 | 3.50 | 3.71 | 3.93 | 4.14 |
| P6 | 3.08 | 3.18 | 3.28 | 3.37 | 3.47 | 3.21 | 3.33 | 3.46 | 3.58 | 3.30 | 3.53 | 3.75 | 3.97 | |
| Model | M9 | |||||||||||||
| Case | Reference | Top | Bottom | Critical | ||||||||||
| Hypothesis | H5 | H10 | H15 | H20 | H5 | H10 | H15 | H20 | H5 | H10 | H15 | H20 | ||
| Span | P5 | 3.09 | 3.19 | 3.29 | 3.40 | 3.51 | 3.24 | 3.34 | 3.42 | 3.55 | 3.26 | 3.49 | 3.72 | 3.95 |
| P6 | 3.13 | 3.22 | 3.31 | 3.45 | 3.53 | 3.29 | 3.42 | 3.56 | 3.57 | 3.39 | 3.64 | 3.88 | 4.12 | |
| Model | M10 | |||||||||||||
| Case | Reference | Top | Bottom | Critical | ||||||||||
| Hypothesis | H5 | H10 | H15 | H20 | H5 | H10 | H15 | H20 | H5 | H10 | H15 | H20 | ||
| Span | P5 | 3.28 | 3.37 | 3.47 | 3.56 | 3.66 | 3.40 | 3.52 | 3.65 | 3.77 | 3.50 | 3.71 | 3.93 | 4.15 |
| P6 | 3.23 | 3.32 | 3.42 | 3.52 | 3.65 | 3.33 | 3.47 | 3.65 | 3.77 | 3.45 | 3.67 | 3.88 | 4.11 | |
3.3 Vertical Displacements Deslocamentos verticais
Table 7 presents vertical displacements for the model slabs. Models M7 and M8 had displacements of 28.0 mm and 32.0 mm, respectively. These displacements occurred for all hypotheses and were within the limits set by standard NBR 6118 (ABNT, 2014). For all variations in eccentricity in the “Top” case, model M9 had displacements lower than 36 mm only in the “Central” span while Model M10 had displacements of less than 40.0 mm. Both of these values were limits set by standard NBR 6118 (ABNT, 2014)
Table 7 Vertical displacements on all model slabs (mm).
| Model | M7 | |||||||||||||
|---|---|---|---|---|---|---|---|---|---|---|---|---|---|---|
| Case | Reference | Top | Bottom | Critical | ||||||||||
| Hypothesis | H5 | H10 | H15 | H20 | H5 | H10 | H15 | H20 | H5 | H10 | H15 | H20 | ||
| Span | First | 18.5 | 18.8 | 19 | 19.2 | 19.4 | 19.1 | 19.6 | 20.1 | 20.7 | 19.3 | 20 | 20.8 | 21.5 |
| Central | 5.4 | 5.8 | 6.3 | 6.6 | 7 | 5.7 | 6 | 6.3 | 6.6 | 6.1 | 6.9 | 7.5 | 8.2 | |
| Final | 19.1 | 19.3 | 19.4 | 19.6 | 19.8 | 19.6 | 20.1 | 20.6 | 21.1 | 19.8 | 20.4 | 21.1 | 21.8 | |
| Model | M8 | |||||||||||||
| Case | Reference | Top | Bottom | Critical | ||||||||||
| Hypothesis | H5 | H10 | H15 | H20 | H5 | H10 | H15 | H20 | H5 | H10 | H15 | H20 | ||
| Span | First | 24.2 | 24.4 | 24.7 | 24.9 | 25.2 | 24.9 | 25.6 | 26.3 | 27.0 | 25.1 | 26.1 | 27.2 | 28.0 |
| Central | 4.8 | 5.1 | 5.5 | 6.5 | 7.1 | 5.3 | 5.6 | 6.1 | 7.1 | 5.8 | 6.7 | 7.7 | 8.7 | |
| Final | 23.9 | 24.2 | 24.6 | 24.8 | 25.1 | 24.7 | 25.5 | 26.3 | 30.0 | 25.0 | 26.1 | 27.1 | 28.1 | |
| Model | M9 | |||||||||||||
| Case | Reference | Top | Bottom | Critical | ||||||||||
| Hypothesis | H5 | H10 | H15 | H20 | H5 | H10 | H15 | H20 | H5 | H10 | H15 | H20 | ||
| Span | First | 35.7 | 35.9 | 36.5 | 36.8 | 37.1 | 36.1 | 36.7 | 37.0 | 37.9 | 36.3 | 36.8 | 37.9 | 39.2 |
| Central | 5.0 | 5.8 | 6.6 | 7.4 | 8.1 | 6.5 | 7.1 | 7.6 | 8.3 | 7.3 | 8.4 | 9.7 | 10.9 | |
| Final | 35.6 | 35.9 | 36.2 | 36.7 | 37.0 | 36.0 | 36.3 | 36.8 | 37.6 | 36.1 | 36.5 | 37.7 | 39.0 | |
| Model | M10 | |||||||||||||
| Case | Reference | Top | Bottom | Critical | ||||||||||
| Hypothesis | H5 | H10 | H15 | H20 | H5 | H10 | H15 | H20 | H5 | H10 | H15 | H20 | ||
| Span | First | 35.4 | 35.7 | 36.4 | 38.0 | 39.0 | 36.3 | 37.2 | 38.1 | 40.1 | 36.9 | 39.3 | 41.6 | 42.5 |
| Central | 2.7 | 3.3 | 5.0 | 8.9 | 10.1 | 3.3 | 5.9 | 9.0 | 10.3 | 4.0 | 6.6 | 9.9 | 12.0 | |
| Final | 34.8 | 35.2 | 35.9 | 37.4 | 38.3 | 35.8 | 36.7 | 37.6 | 39.6 | 36.1 | 38.9 | 40.0 | 42.1 | |
The effects of changes in eccentricity on displacement are better understood graphically from Figure 8. In the figure, the vertical axis contained the f/L ratio, which represented the equivalent center span displacement in denominator format: for example L/430 with L/250 being the limit. The horizontal axis contained the relative eccentricities, which were the variation in height of the strand (eccentricity) with respect to slab thickness. The dashed lines were placed in order to visually separate the slab models. The relative eccentricity (or its variation) could have more or less of an effect depending on the case study: examining the trends of Figure 8, it could be noted that, for all slab models, the “Critical” hypothesis produced the most variations in displacement.

For slab models M9 and M10, the “Top”, “Bottom” or “Critical” eccentricity positions had less of an effect than for models M7 and M8. The amplitude of variation of the center displacement increased as relative eccentricity increased. In the “Critical” case of model M9, the increase in relative eccentricity from 2.4% to 9.5% resulted in an increase in relative displacement from L/248 to L/230. For comparison, in the “Critical” case of model M7, the increase in relative eccentricity from 2.9% to 11.8% resulted in an increase in relative displacement from L/363 to L/325.
3.4 Load Balancing
Load balancing values increased when strands were inserted in order to attain the normal tensile stress limits at the top and bottom faces of the slab and in pre-compression. Table 8 shows a summary of load balancing values for all models. Only model M7 reached the recommended value between 60% and 80% of Loureiro (2006) and Aalami (2014). In the other models, load balance varied between 59% and 95% of permanent loads.
Table 8 Load balancing on all slab models (%).
| Model | M7 | |||||||||||||
|---|---|---|---|---|---|---|---|---|---|---|---|---|---|---|
| Case | Reference | Top | Bottom | Critical | ||||||||||
| Hypothesis | 0.5 | 1.0 | 1.5 | 2.0 | 0.5 | 1.0 | 1.5 | 2.0 | 0.5 | 1.0 | 1.5 | 2.0 | ||
| Span | First | 73 | 73 | 72 | 72 | 71 | 73 | 72 | 72 | 71 | 72 | 71 | 70 | 69 |
| Central | 74 | 72 | 71 | 69 | 68 | 72 | 71 | 69 | 68 | 71 | 68 | 64 | 61 | |
| Final | 80 | 79 | 79 | 78 | 77 | 79 | 78 | 77 | 75 | 78 | 76 | 74 | 72 | |
| Model | M8 | |||||||||||||
| Case | Reference | Top | Bottom | Critical | ||||||||||
| Hypothesis | 0.5 | 1.0 | 1.5 | 2.0 | 0.5 | 1.0 | 1.5 | 2.0 | 0.5 | 1.0 | 1.5 | 2.0 | ||
| Span | First | 82 | 81 | 80 | 79 | 78 | 81 | 80 | 78 | 77 | 80 | 78 | 75 | 73 |
| Central | 92 | 89 | 87 | 84 | 82 | 89 | 87 | 84 | 82 | 87 | 82 | 77 | 72 | |
| Final | 87 | 87 | 86 | 85 | 84 | 86 | 84 | 83 | 81 | 85 | 82 | 80 | 78 | |
| Model | M9 | |||||||||||||
| Case | Reference | Top | Bottom | Critical | ||||||||||
| Hypothesis | 0.5 | 1.0 | 1.5 | 2.0 | 0.5 | 1.0 | 1.5 | 2.0 | 0.5 | 1.0 | 1.5 | 2.0 | ||
| Span | First | 88 | 87 | 86 | 85 | 83 | 60 | 59 | 57 | 56 | 60 | 57 | 54 | 52 |
| Central | 94 | 92 | 90 | 88 | 85 | 61 | 60 | 58 | 57 | 60 | 56 | 53 | 50 | |
| Final | 87 | 86 | 85 | 84 | 83 | 59 | 58 | 57 | 56 | 58 | 56 | 54 | 52 | |
| Model | M10 | |||||||||||||
| Case | Reference | Top | Bottom | Critical | ||||||||||
| Hypothesis | 0.5 | 1.0 | 1.5 | 2.0 | 0.5 | 1.0 | 1.5 | 2.0 | 0.5 | 1.0 | 1.5 | 2.0 | ||
| Span | First | 97 | 96 | 95 | 94 | 93 | 95 | 93 | 91 | 89 | 94 | 91 | 88 | 85 |
| Central | 93 | 92 | 90 | 88 | 86 | 92 | 90 | 88 | 86 | 90 | 86 | 83 | 79 | |
| Final | 88 | 87 | 87 | 86 | 85 | 87 | 95 | 83 | 81 | 86 | 83 | 80 | 77 | |
3.5 Passive Reiforcement
Table 9 shows bottom passive reinforcement results for the slab models.
Table 9 Bottom passive reinforcement results
| Model | Hypothesiss and Cases | |||||
|---|---|---|---|---|---|---|
| Reference | H5 - Top | H5 - Bottom | ||||
| First and Final span | Central span | First and Final span | Central span | First and Final span | Central span | |
| Steel area (cm2/m) | Steel area (cm2/m) | Steel area (cm2/m) | ||||
| M7 | 2.54 | 2.11 | 2.54 | 2.11 | 2.64 | 2.22 |
| M8 | 2.72 | 2.10 | 2.72 | 2.10 | ||
| M9 | 3.26 | 2.40 | 3.26 | 2.40 | ||
| M10 | 3.74 | 2.46 | 3.74 | 2.46 | ||
In the case of hypothesis H5 and “Top” case, bottom passive reinforcements were unchanged with respect to Reference values. Changes in reinforcement were observed within a model but in different spans.
Table 10 Top passive reinforcement results
| Model | Hypothesis and Cases | ||
|---|---|---|---|
| Reference | H5 - Top | H5 - Bottom | |
| Steel area (cm2/m) | |||
| M7 | 7.4 | 7.4 | 7.7 |
| M8 | 10.5 | 10.5 | |
| M9 | 12.2 | 12.2 | |
| M10 | 15.6 | 15.6 | |
Table 10 shows results for the top passive reinforcement for all slab models. Similar to Table 9, the passive reinforcement rate used to cancel negative flexing remained unchanged for all models under hypothesis H5 and “Top” case with respect to Reference values. This was a consequence of the 5 mm reduction in height of the spacers over the pillars not inducing sufficient loads to demand an increase in steel. On the other hand, the variation of eccentricity in the “Bottom” case for model M7 resulted in an increase in reinforcement rate over the pillars to provide additional effect against negative flexing when compared to the Reference model with the same span.
4. Conclusions
This study analyzed four models of post-tensioned flat slabs with variations in the span between pillars and in strand eccentricity. The variations in eccentricity simulated errors in assembly and positioning of vertical spacers. Pre-compression stresses, normal tensile stresses in the top and bottom faces, load balancing and vertical displacements were analyzed. Top and bottom passive reinforcements were also analyzed.
A decrease in eccentricity of the strands had a direct effect on the slab loads: its main effect was a decrease in the ratio of normal stresses supported by post-tensioning. The decrease in eccentricity of the “Bottom” case had a stronger negative impact than a variation of eccentricity of the “Top” case and affected normal stress control, load balancing criteria and displacements.
Only model M7 with variations in eccentricity from hypothesis H5 were within limits set by standard NBR 6118 (ABNT, 2014) for the “Top” and “Bottom” cases. On other hand, models M8, M9 and M10, with variations in eccentricity from hypothesis H5 for the “Top” case presented normal tensile stresses below the 3.38 MPa limit of standard NBR 6118 (ABNT, 2014).
Pre-compression stresses in the structural element were affected only by the number of tendons and the load applied to them. There were no effects of variations in vertical height of spacers.
Vertical displacements of the slabs were affected by variations in eccentricity. Models M7 and M8 remained below the L/250 limit of standard NBR 6118 (ABNT, 2014) for all hypothesis of variations of eccentricity tested.
Load balancing criteria remained within recommended limits only for Model M7. However, since these criteria were complementary and not standardized, the other models could be acceptable for use nonetheless.
Reinforcement rate for top and bottom reinforcements were unchanged between the Reference model and all models with variations in eccentricity from hypothesis H5 and “Top” case.
The maximum variation of relative eccentricity so that the parameters of this study remained with established limits was 2.1% for the “Top” case. This was obtained by comparing the variation in eccentricity with respect to slab thickness.
Overall, results showed that flat post-tensioned slabs with unbonded tendons of type CP 190 RB, diameter of 12.7 mm and span between pillars between 7.0 m to 10.0 m could have a maximum tolerance of 5 mm in a decrease of vertical height of strands in the top face of the slab (“Top” case). This result was more restrictive than found in reference studies.

