


 text in
  English (pdf)
 Article in xml format
 Article references
 Send this article by e-mail
 Cited by SciELO
  Similars in
SciELO
Similars in
SciELO 
 Permalink
Introduction
Trees are considered the most important elements in a forest ecosystem, as they have different morphological characteristics that give rise to different structures in diameter, height and density. This last characteristic is very important for the assessment of competition among trees of a given stand or forest (Berger & Puettmann, 2000).
Density is a factor that regulates the productivity of a forest site and can be manipulated by the forest manager through thinnings (Daniel, Helms, & Baker, 1982). However, determining the appropriate stand density levels is a complicated process that depends on biological, technological and operational factors (Diéguez-Aranda et al., 2009). The density of a species, mixture of species or specific region is managed through different thicknesses that provide upper and lower limits for the application of thinnings. In order to achieve efficient management in the control of stand density, it is necessary for forest management to have quantitative tools such as DMDs.
DMDs reflect fundamental relationships between the number of trees, their size, the occupation of the growth space and self-thinning (Vacchiano, Motta, Long, & Shaw, 2008). In order to achieve optimal stand density, it is suggested to establish an upper limit that would correspond to the maximum density that a specific stand is capable of supporting in the different stages of development (Barrio-Anta, Balboa-Murias, Castedo-Dorado, Diéguez-Aranda, & Álvarez-González, 2006). A DMD is a graphical model that allows scheduling the thinnings in a stand to avoid tree mortality due to self-thinning; in addition, the effects of the cuttings can be simulated and predicted in a given time (Magaña-Torres, Torres-Rojo, Rodríguez-Franco, Aguirre-Díaz, & Fierros-González, 2008). Also, DMDs are useful tools for developing, evaluating and showing stand density management alternatives for several purposes from wildlife habitat optimization (Sturtevant, Bissonette, & Long, 1996) to aboveground biomass production (Castedo-Dorado, Crecente-Campo, Álvarez-Álvarez, & Barrio-Anta, 2009).
In Mexico, DMDs have been developed for even-aged forests with different species (Márquez-Linares & Álvarez-Zagoya, 1995; Santiago-García et al., 2013; Quiñonez-Barraza et al., 2018) and commercial plantations of Tectona grandis L. f. (Minoche, Risio-Allione, Herrero, & Martínez-Zurimendi, 2017); however, few studies have been published about natural forests with mixed species (Corral-Rivas, Álvarez-González, Corral-Rivas, Wehenkel, & López-Sánchez, 2015; Torres-Rojo & Velázquez-Martínez, 2000). Therefore, the objective of this work was to develop a DMD as a tool for planning and scheduling thinnings in mixed-species forests of the Borbollones ejido, in Pueblo Nuevo, Durango, as well as to illustrate the use of the DMD for a management scheme, for timber production purposes at the end of the forest rotation
Materials and methods
Study area
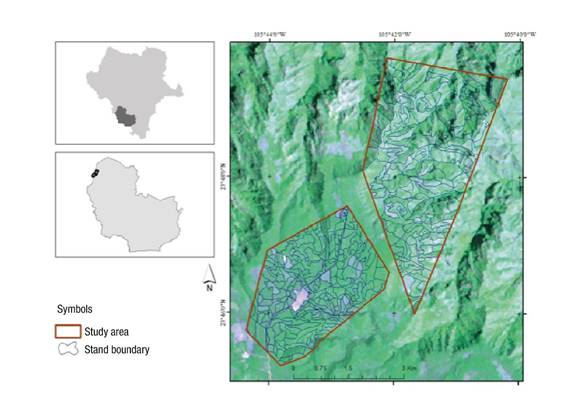
The study area is located in the southwestern region of Durango state, Mexico, specifically in the forests of the Borbollones ejido, Pueblo Nuevo (Figure 1), which is located at geographical coordinates 23º 30’ and 24º 15’ N, and 105º 15’ and 105º 45’ W. The predominant vegetation type corresponds to mixed-species forests with mainly species of the Pinus and Quercus genus. The elevation ranges from 1 400 to 3 000 m. The main climate is temperate semi-cold with an annual precipitation regime ranging from 900 to 1 200 mm and the mean annual temperature ranges from 8 °C in the upper areas to 24 °C in the lower ones (García, 1981).
Study data
The data come from 441 temporary circular sampling plots of 0.10 ha, collected in 2012 with a stratified random sampling design for timber management purposes, covering an area of 2 339.89 ha divided into 263 stands. With the information of all species recorded in each plot, the following stand variables were estimated: number of trees per hectare (N; trees·ha−1), basal area (G; m2·ha−1), quadratic mean diameter (dg; cm), dominant height estimated as the average of the 100 trees with the largest diameter per hectare (Hd; m) (Assmann, 1970) and total tree volume (V; m3·ha−1). The species composition was 84 % for the genus Pinus (P. ayacahuite Ehrenb., P. chihuahuana Schiede ex Schltdl. & Cham., P. cooperi Blanco, P. douglasiana Martínez, P. durangensis Martínez., P. engelmannii Carr., P. herrerae Martínez., P. leiophylla Schlecht. & Cham., P. lumholtzii B. L. Rob. & Fernald., P. michoacana Martínez., P. oocarpa Shiede. and P. teocote Schlecht. & Cham.); 8 % for the genus Quercus (Q. candicans Neé, Q. crassifolia Ehrenb., Q. durifolia Seem., Q. eduardii Trel., Q. scytophylla Liebm., Q. obtusata Bonpl., Q. rugosa Neé, and Q. sideroxila Humb. & Bonpl.); and 8 % for species such as Juniperus deppeana Steud., Cupressus lusitanica Mill. and Pseudotsuga menziesii (Mirb.) Franco. Table 1 shows a summary of the main statistics of the variables involved in the construction of the DMD.
Table 1 Summary of the database used in the construction of the DMD for mixed-species stands in the Borbollones ejido, Pueblo Nuevo, Durango, Mexico.
| Stand variables | Minimum | Maximum | Mean ± SD |
|---|---|---|---|
| N (trees·ha-1) | 173 | 1 180 | 503.73 ± 210.03 |
| dg (cm) | 15.40 | 46.20 | 26.83 ± 6.32 |
| Hd (m) | 11.20 | 20.70 | 15.70 ± 1.77 |
| V (m3·ha-1) | 40.60 | 343.10 | 142.65 ± 46.96 |
SD = standard deviation; N = number of trees per hectare; dg = quadratic mean diameter; Hd = dominant height; V = volume.
Equations used in the DMD
The basic structure of a DMD is composed of two allometric equations fitted from density data, and a stand thickness index that is usually used to characterize the silvicultural treatments to be performed. The first of the equations relates the diameter of the average tree with the density of the stand and a signal of its productivity. The second equation predicts the stand productivity volume based on the variables that define mean tree volume and density. In turn, the variables of the DMD axes are conditioned by the characterization index of the chosen thickness, which forces the density to be represented in terms of the number of trees per hectare. In this study we used the Hart-Becking index "HBI" (Wilson, 1946), also known as the relative spacing index, which is defined as the ratio (expressed as a percentage) between the average distance between the stand trees and the dominant height. The HBI is usually used to define the upper and lower density limits, as well as the need, intensity and frequency of thinnings (Diéguez-Aranda et al., 2009); in addition, it is independent of the age of the stand (Long, 1985) and can be adapted for even- and uneven-aged forests (Gadow & Hui, 1999), thus representing a good silvicultural tool for managing density in mixed-species stands (Barrio-Anta & Álvarez-González, 2005).Starting from two coordinate axes corresponding to the dominant height (x axis) and the number of trees per hectare (y axis), the isolines of the HBI values and the dependent variables of the allometric relationships are represented: one that relates the quadratic mean diameter with the number of trees per hectare and the dominant height, and another one that relates the stand volume with the number of trees per hectare, the quadratic mean diameter and the dominant height as an indicator of the site quality. The expressions of the equations used in the construction of the DMD are the following (isolating density):
where,
HBI |
Hart -Becking relative spacing index (%) |
d g |
quadratic mean diameter (cm) |
N |
density (trees·ha−1) |
H d |
dominant height (m) |
V |
total tree volume (m3·ha−1) |
β i (i = 1 - 7) |
parameters to be estimated using NLS |
These relationships have silvicultural and biological consistency; that is, the value of the quadratic mean diameter will be conditioned by the silvicultural treatments (which determine the residuals of the number of trees per hectare) and by the forest productivity (characterized by the dominant height). On the other hand, stand volume is directly related to the basal area (whose value depends on the number of trees per hectare and the quadratic mean diameter) and dominant stand height.
For the HBI calculation, the mean distance between trees corresponding to a stand with a triangular tree distribution has been used, which is more appropriate to the current state of the studied stands (Castaño-Santamaría, Barrio-Anta, & Álvarez-Álvarez, 2013). Considering the above equations, if N is isolated for each of them and different values of HBI, dg and V are set, expressions can be obtained that allow estimation of the isolines or trajectories that are subsequently superimposed on a cartesian coordinate system with Hd on the x axis and N on the y axis, thus defining the DMD.
The allometric system defined by equations 2 and 3 has dg as an instrumental variable; that is, dg is the dependent variable of equation 2, while in equation 3 it is an independent variable. Therefore, both equations were fitted simultaneously to avoid error correlation. The parameters were fitted using NLS with the 'nlsLM' procedure of the minpack.lm package (Elzhov, Mullen, Spiess, & Bolker, 2013) in R (R Core Team, 2014).
The establishment of the self-thinning line or DMD upper limit is considered of significant importance, given its usefulness in simulating natural mortality or self-thinning and prescribing thinning; if this line is not considered, there is a high probability of mortality due to competition. Quantile regression offers the possibility of obtaining the maximum density line and creating different quantile lines for stands that exceed the values observed within the diagram. The maximum density line was fitted by non-linear quantile regression (Koenker & Bassett, 1978) with a potential equation that relates the number of trees per hectare to the dominant height:
The value of the quantile (τ) used in the fitting process was 95 %, i.e. the upper limit of self-thinning is only exceeded by 5 % of the stands. Parameters a 1 and a 2 were estimated using the “nlrq” function of the “quantreg” module (Koenker, 2015) of program R (R Core Team, 2014).
Evaluation of Allometric Relationships
The analysis of the fitting statistic capacity of the allometric relationships was based on the graphs of the residuals and on statistics such as coefficient of determination (R 2) and Root Mean Square Error (RMSE), whose mathematical expressions are as follows:
Results and discussion
Allometric relationships
The estimates of the β i parameters of equations 2 and 3 that define the DMD (Table 2) were different from zero at a significance level of 5 % (P < 0.05). The analysis of the residuals showed that the regression equations did not present anomalous tendencies that implied non-fulfillment of the starting hypotheses of normality, homogeneity of variance and independence of errors. By means of the simultaneous fitting of equations 2 and 3, the independent variables were able to explain close to 87 % of the observed variability of the dependent variables, a common situation for static stand models (López-Sánchez & Rodríguez-Soalleiro, 2009), minimizing the value of RMSE to 2.3. These results are consistent with the ranges observed in the database and show a correct estimate of dg and V with the form of the equations. The accuracy in the fitting of equations 1 and 2 is acceptable when comparing the R2 values with those of other studies carried out on even-aged stands of one or two species (Barrio Anta & Álvarez González, 2005; Castedo-Dorado et al., 2009; Tewari & Álvarez-González, 2014) and on stands with a mixture of species of the genera Pinus, Quercus, Cupressus, Alnus and Juniperus (Corral-Rivas et al., 2015).
Table 2 Estimated parameters in the simultaneous adjustment of the equations* that define the DMD.
| Parameter | Estimator | SE | T | Pr > |t| |
|---|---|---|---|---|
|
|
1.735 | 0.4568 | 3.7996 | <0.0001 |
|
|
-0.188 | 0.0176 | -10.702 | <0.0001 |
|
|
1.409 | 0.0641 | 21.9578 | <0.0001 |
|
|
1.155 | 1.1462 | 1.0076 | <0.0001 |
|
|
0.8452 | 0.2244 | 3.7649 | <0.0001 |
|
|
0.305 | 0.0778 | 3.9176 | <0.0001 |
|
|
0.0654 | 0.3808 | 0.1717 | <0.0001 |
SE = standard error of the estimated parameters; T = Student's t-statistic; Pr > |t| = probability associated with the parameter estimator under a Student’s t distribution. *Equations:
Maximum density limit
The estimated parameters of the self-thinning line (
Density management diagram
In construction of the DMD, first the maximum density line was drawn using the equation
Figure 2 illustrates a case study for the use of the DMD in a management scheme, whose objective is to obtain mostly saw-timber at rotation age. In general, any density program in the diagram focuses on maximizing stand volume production; therefore, density management options can be represented graphically from the ordinate axis (assuming there is no natural mortality). Reducing density by thinning has no effect on the evolution of dominant height (abscissa axis), so the speed at which the mass moves (age of the dominant height) through the abscissa axis depends on the quality of the site or the growth (Reineke, 1933). Total stand production can be obtained directly from any point on the diagram from the isolines representing the total volume. The volume extracted, which results from the various interventions in the form of thinnings, can be estimated as the difference between the volumes before and after the intervention. The sum of these volumes throughout the forest rotation can lead to the estimation of total production under a given silvicultural management regime.
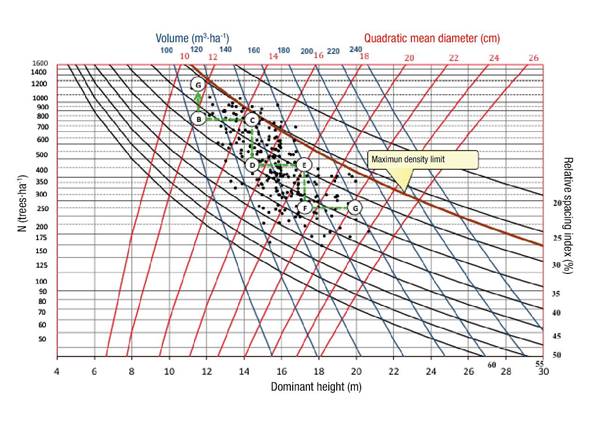
Figure 2 Example of the use of the DMD developed for mixed-species stands in a saw-timber production scheme.
Figure 2 shows a scheme of silvicultural treatments (routes between points A-B, C-D and E-F) in a particular stand with the purpose of obtaining saw-timber at the final harvest (point G of the diagram), which is defined by a dominant height close to 20 m and a quadratic mean diameter of 20 cm, which will give an average volume of 180 m3·ha−1. The scheme consists of three interventions (the first corresponds to a commercial thinning) arranged over time by means of the biological criterion of growth in dominant height of more than five years (routes between points B-C, D-E, F-G), a reasonable value for species that grow in good site conditions; to reach the final objective (point G), the scheme is presented in a stairway-shaped line (dotted line). The vertical segments represent the thinning cuts, while the horizontal ones reflect the intervals between thinnings in a 10-year cutting cycle, assuming that after thinning there will be no mortality due to competition among individuals; however, it should be considered that there is always mortality due to pests, diseases or meteorological factors, which is not considered in the DMD. Since the time variable to define the interval between cuttings is not shown in the diagram, the dominant height for the cutting cycle was estimated using the equation developed by Corral-Rivas, Álvarez-González, Ruíz-González, and Gadow (2004); in addition, the number of silvicultural treatments applied to the even-aged stands for a 60-year forest rotation period was considered. According to the diagram, the first intervention (point B) should be carried out when the stand reaches a quadratic mean diameter of 11 cm and 1 200 trees·ha−1 with an HBI of 25 % which, on average, represents a volume of 117 m3·ha−1. The intermediate cutting segments were represented parallel to the ordinate axis under the assumption that the thinnings at the bottom do not affect stand dominant height (López-Sánchez & Rodríguez-Soalleiro, 2009). As for production, this can be obtained at any point of the diagram using the stand volume isolines. It is also possible to estimate the wood volume, according to the industrial destination, from the commercial volume equations fitted for the main species of the study area (Pérez-Cruzado, Merino, & Rodríguez-Soalleiro, 2011). The interpretation of the thinning program can be seen in greater detail in Table 3.
Table 3 Cutting scheme through the use of the density management diagram.
| Operation | Hd (m) | dg (cm) | HBI (%) | N (trees·ha−1) | V (m3·ha−1) | GS (m) | ||||
|---|---|---|---|---|---|---|---|---|---|---|
| bc | ac | bc | Ac | bc | ac | bc | ac | |||
| Cut (A-B) | 11.8 | 11.7 | 12 | 26 | 34 | 1 100 | 750 | 115 | 105 | 3.06 |
| Cut (C-D) | 14.3 | 14.0 | 15 | 34 | 35 | 750 | 450 | 138 | 122 | 4.86 |
| Cut (E-F) | 16.7 | 16.5 | 18 | 29 | 38 | 450 | 260 | 150 | 140 | 4.84 |
| Final cut (G) | 19.5 | 21.8 | 33.5 | 260 | 170 | 6.53 | ||||
Hd = dominant height; N = density; dg = quadratic mean diameter; V = total stand volume; HBI = Hart-Becking index; GS = growth space; bc = variable before cutting; and ac = variable after cutting.
Conclusions
The results indicate that quantile regression offers an alternative to efficiently estimate the maximum density line. The DMD developed is useful for planning and evaluating intermediate treatments applied to mixed-species forests. The diagram is a practical tool for forest managers, as it assists in making decisions in managing stand density to achieve different objectives, which in this case was timber production. Dominant stand height is the main variable to consider in defining the period and frequency of thinnings. This variable depends directly on the quality of the site, species composition and age, which allows maximizing the use of the site through adequate control of point and relative density levels.

