


Services on Demand
Journal
Article
 text in
  English (pdf)
 Article in xml format
 Article references
 Send this article by e-mail
Indicators
-
 Cited by SciELO
 -
 Access statistics
Related links
-
 Similars in
SciELO
Similars in
SciELO
Share

 Permalink
Tecnología y ciencias del agua
On-line version ISSN 2007-2422
Tecnol. cienc. agua vol.9 n.4 Jiutepec Jul./Aug. 2018 Epub Nov 24, 2020
https://doi.org/10.24850/j-tyca-2018-04-10
Notes
Methodology for hydrological information management in waterways: Application to Bolivia
1Universidad de Cádiz, Centro Andaluz Superior de Estudios Marinos (CASEM), Puerto Real, Cádiz, España, bismarck.jigena@gm.uca.es
2Servicio Nacional de Hidrografía Naval de Bolivia (SNHN), La Paz, Bolivia, renamave@gmail.com
3Universidad de Cádiz, Centro Andaluz Superior de Estudios Marinos (CASEM), Puerto Real, Cádiz, España, juanjose.munoz@uca.es
4Universidad de Sevilla, Grupo TAR-Bioingeniería, Sevilla, España, sedceroya@us.es
5Universidad de Cádiz, Centro Andaluz Superior de Estudios Marinos (CASEM), Puerto Real, Cádiz, España, jorge.walliser@uca.es
6Universidad de Cádiz, Centro Andaluz Superior de Estudios Marinos (CASEM), Puerto Real, Cádiz, España, fatima.calderay@uca.es
7Universidad de Cádiz, Centro Andaluz Superior de Estudios Marinos (CASEM), Puerto Real, Cádiz, España, manuel.berrocoso@uca.es
The Hydrometric Network of the Bolivian Navy (RHAB) database lacks the ease of consultation required by a modern administrator for the optimization of the management of hydrological resources. Therefore, we presented a new methodology, generalizable to any country, to develop a multidisciplinary geographic information system (GIS) on the web. It is easy and intuitive to use and oriented to hydrometric information management for early warning, navigation support, and fluvial and lacustrine transport, and for projects and works involving research, engineering, cartography, fishing, tourism, etc. The geographic database containing the hydrological information is accessed through the internet with a geographical web viewer. Different free distribution software applications have been integrated together with different programming languages. The immediate provision of accurate data also helps in the prevention of flood disasters.
Keywords Water level; hydrological management; river navigation; early warning
La base de datos de la Red Hidrométrica de la Armada Boliviana (RHAB) carecía de la agilidad de consulta, por lo que precisa de un moderno gestor de información espacial y de base de datos para la optimización del manejo de los recursos hidrológicos. Por ello, se presenta una nueva metodología, generalizable a cualquier país, para desarrollar un sistema multidisciplinario de información geográfico (SIG) en Internet. Es de fácil e intuitiva utilización, orientado a la gestión de información hidrométrica para alerta temprana, apoyo a la navegación, al transporte fluvial y lacustre, para proyectos y obras de investigación, ingeniería, cartografía, pesca y turismo, entre otros. El acceso a la base de datos geográfica que contiene la información hidrológica se realiza mediante Internet, con un visor web geográfico. Se han integrado diferentes aplicaciones de software de distribución libre, junto con diversos lenguajes de programación. La disposición inmediata de datos precisos coadyuva en la prevención de desastres por inundaciones.
Palabras clave nivel de agua; manejo hidrológico; navegación fluvial; alerta temprana
Introduction
The needs to control water cannot be satisfied with the current means of management (Návar & Lizárraga, 2016). Early warning system for droughts and floods need to be designed in some countries under the supervision of national and international organizations, in order to prevent all kinds catastrophes (e.g.: OEA, 2010; Conagua, 2011; UNESCO, 2006; UNESCO, 2012). An automated hydrological information system (SAIH, in Spanish) (e.g. the report prepared by the National School of Civil Protection (Escuela Nacional de Protección Civil, 2015) provides the information management needed to facilitate the management of watersheds and decision making. Different types of strategies have been submitted by many authors, such as Lopez (2005); Baró, Delgado, Esteller and Calderón (2007); Campos-Aranda (2015), and Alvarez and Escalante (2016).
In Bolivia, the National Hydrographic Survey (SNHN) acquires, processes, and disseminates hydrometric information about the variability of levels of the main navigable bodies of water in the country. It was established by the hydrometric network of Bolivian Navy (RHAB), which currently has 45 stations. The first were installed in 1975 in Cáceres Lagoon (del Plata basin) and at the port of Guaqui (Titicaca Lake), which has more than 40 years of continuous daily records (SNHN, 2014). Starting in 1995, new hydrometric stations began to be installed at naval sites of the Bolivian Navy(AB). For example Naval Bases and Harbor Captaincies were established, taking advantage of the geographical distribution of them, because they are located in the three hydrographic basins in the country. Given the characteristics of the Naval Units, this will ensure the maintenance of the network and the safety of the equipment and facilities of the hydrometric station. Daily monitoring of water levels is performed by Bolivian Navy observers who took a previous training course. In addition, they perform the hydrometric record and daily transmission of these data to the SNHN (via radio, telephone or internet, depending on available communications). To date, the RHAB lacks the ease and availability necessary for fast consultation by users, requiring a modern system to optimize their management.
This article aims to present a new methodology, generalizable to any other country, to enable a geographic information system (GIS) on the web. This system must allow immediate access to the database of water levels and support making decisions for an Early Warning System (SAT) for extreme hydrological events.
Area of study
Description of the study area
The study area corresponds to the territory of the Plurinational State of Bolivia, with an area of 1 098 591 km2. Hydrologically, Bolivia is part of three of the major hydrographic basins of South America: The Amazon basin, the Plata basin and Endorheic or Altiplanic basin (see Figure 1a and Figure 1b, respectively).
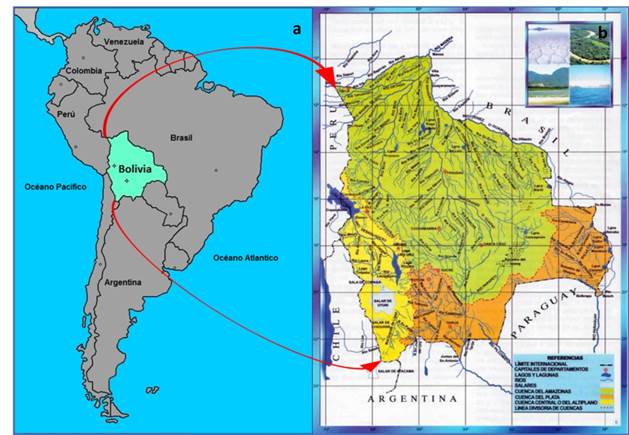
Figure 1 Area of study: a) location of Bolivia, b) hydrographic basin of Bolivia. Source: SNHN (2007).
According to SNHN (2014), the Amazon basin, the largest basin, occupies 65% of the territory. Its main rivers flow into Madera River which is one of the main tributaries of the Amazon river. The Plata Basin occupies the southeast of the country and covers 20% of the national territory. The Endorheic or Altiplanic basin is a closed basin which covers 14% of the territory and forms an axis between the endorheic lakes in the country, Titicaca Lake, Poopo, and Uru Uru. These basins consist of 10 sub-basins, 270 main rivers, 184 lakes and lagoons, some 260 wetland and two salt lakes. In the western part, the hydrographic basin flows into the Pacific Ocean, with less than 1% of the surface.
Hydrometric networks
For the study, 45 RHAB hydrometric stations have been included (33 in the Amazon basin, 7 in the Plata Basin and 5 in the Lacustrine basin). They are located in different parts of the navigable water bodies. Maintenance corresponds to the SNHN, the technical-scientific national agency of the Ministry of Defense of Bolivia. Of these 45 stations, 22 of them are part of the hydrological monitoring (SAT) Early Warning System, see Figure 2.
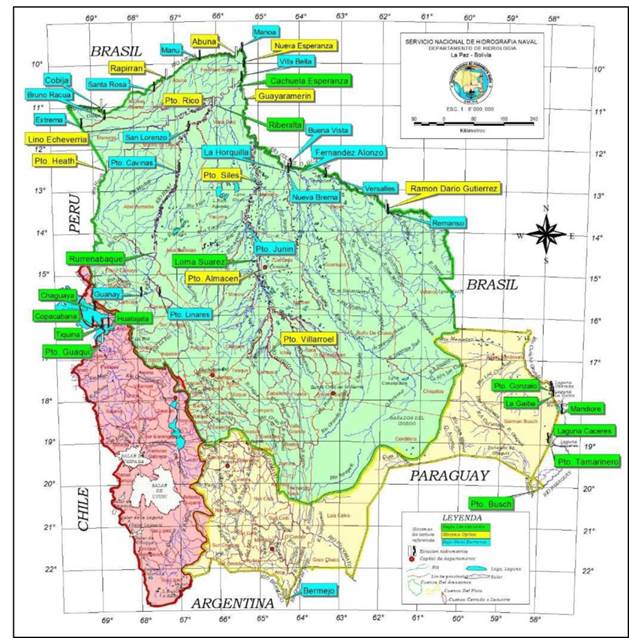
SAT establishes control mechanisms which are activated in case of floods or droughts with extraordinary emergency protocols. It is noteworthy that the navigable rivers constitute a real alternative within the structure of the sector transport in Bolivia for the 21st century.
Methodology
Location of the SAT hydrometric stations
The geographic position of the stations was determined using GNSS technologies, making observations with dual-frequency geodetic receivers. To obtain the absolute coordinates, the post-processing static geodetic method was used. The absolute geocentric coordinates related to MAGNA-SIRGAS and WGS-1984 Geodetic Reference System, ITRF2000.0 epoch. The calculation of coordinates was made by applying the methodology proposed by Berrocoso, Enríquez-de-Salamanca, Ramírez, Fernández-Ros and Jigena (2007); Berrocoso et al. (2008), and Jigena, Vidal and Berrocoso (2015b), using the Leica Geomatics Office software.
Altimetrically, the coordinates of the hydrometric stations were linked to the WGS-84 ellipsoid and the mean sea level (MSL) relative to tide gauge of Arica (Chile). The coordinates are shown in Table 1.
Table 1 Coordinates of SAT network stations.
| Station | River | Lat. (S) | Long. (W) | h (m) | H (m.a.s.l.) |
|---|---|---|---|---|---|
| Rurrenabaque | Beni | 14°26'35.87" | 67°31'59.06"O | 225.78 | 194.00 |
| Riberalta | Beni | 10°59'41.01" | 66°03'57.05"”06"0303'57.05" | 149.64 | 125.00 |
| Cachuela Esperanza | Beni | 10°32'8.33" | 65°34'55.39" | 138.95 | 116.00 |
| Puerto Heath | Madre de Dios | 12°30'07.94" | 68°38'33.29" | 197.68 | 168.00 |
| Lino Echeverría | Madre de Dios | 11°28'19.49" | 67°14'24.49" | 171.92 | 148.00 |
| Puerto Rico | Orthon | 11° 6'11.46" | 67°33'30.94" | 202.94 | 176.00 |
| Abuná | Abuná | 09°47'15.88" | 65°32'1.22" | 117.14 | 98.00 |
| Rapirrán | Abuná | 10°41'01.33" | 68° 3'49.88" | 196.51 | 170.00 |
| Cobija | Acre | 11°00'39.88"11111°00'39.88"1'1.33"0'39.88" 0'39.88"S | 68°45'24.81" | 222.24 | 191.00 |
| Puerto Villarroel | Ichilo-Mamoré | 16°50'12.03"11111°00'39.88"1'1.33"0'39.88" 0'39.88"S | 64°47'31.26" | 215.43 | 194.00 |
| Puerto Siles | Ichilo-Mamoré | 12°48'02.22"11111°00'39.88"1'1.33"0'39.88" 0'39.88"S | 65°00'19.50" | 183.02 | 138.00 |
| Guayaramerín | Ichilo-Mamoré | 10°48'44.91" | 65°20'34.29" | 142.25 | 120.00 |
| Puerto Almacén | Ibare | 14°52'07.61" | 64°58'12.91" | 181.30 | 155.00 |
| Loma Suárez | Ibare | 14°45'46.59" | 64°57'53.75" | 180.53 | 154.00 |
| Puerto Junín | Yacuma | 13°43'34.20" | 65°25'3.59" | 171.52 | 142.00 |
| Ramón Darío Gutiérrez | Iténez | 13°31'24.53" | 61°52'12.04" | 176.46 | 158.00 |
| La Horquilla | Itonamas | 12°32'23.14" | 64°22'5.12" | 156.17 | 133.00 |
| Fernández Alonzo | Blanco | 12°33'42.56" | 64°16'24.72" | 158.05 | 135.00 |
| Puerto Tamarinero | Canal Tamengo | 18°59'09.90"11111°00'39.88"1'1.33"0'39.88" 0'39.88"S | 57°42'24.97" | 94.86 | 80.00 |
| Puerto Busch | Paraguay | 20°03'55.60"3'55.60"11111°00'39.88"1'1.33"0'39.88" 0'39.88"S | 58°02'07.51" | 58.49 | 42.00 |
| Bermejo | Bermejo | 22°43'57.55"11111°00'39.88"1'1.33"0'39.88" 0'39.88"S | 64°20'58.98" | 433.76 | 407,00 |
| Puerto Guaqui | Lago Titicaca | 16º35’10.000 | 68º51’21.000 | 3856.02 | 3811.00 |
Coding of the Early Warning System (SAT)
For each station, four colors to alert risk levels were defined. These levels were determined by the water level reached in the river or lake (SNHN, 2017): green alert (no flood risk), yellow (low flood risk), orange (high risk of flooding) and red (flood is beginning), which is defined by the top of bank of the river or lake).
Hydrometric data acquisition
The data acquisition was performed at each hydrometric station by observation with direct readings obtained from one or several staff gauges (Limnimeter) with a centimetric precision of 0.01 m (Chamorro, 2008). In order to determine the vertical difference of the water level, the staff gauge was georeferenced according to the Reference Levelling Benchmark (BMRN), using the methodology proposed by Jigena, Vidal and Berrocoso (2015a). The BMRNs from each station were referenced to the Bolivian Altimetric Network and were provided with orthometric height (H) relative to mean sea level of Arica (Chile) tide gauge or to the ellipsoidal height (h) with respect to the WGS-84 ellipsoid. The hydrometric stations were installed according to Chamorro (2008). Examples of hydrometric facilities are shown in Figure 2.
Of the 45 hydrometric stations that define the RHAB, direct reading on the limnimetric staff was performed at 14 stations, with optical system at 11 stations and using the ravine as a reference level for the 20 remaining stations (SNHN, 2014).
Fixed limnimetric stations
The water level staff gauge (Limnimeter) was installed in a place of the river protected from currents, waves, hits and other dangers related to river hydrology. Its location depends on the existing bank slope and it usually settles in the vertical staff rule, fixed to a structure (Figure 3a). There is also the sectioned staff gauge installation, which is a vertical staff gauge but installed section by section, where all the staff gauge water level rules are vertically referenced. This type of installation is normally carried out in rivers in the Amazon or the Plata basins, because of changes in levels between floodwater and low water seasons, which often have a range of several meters (Figures 3a and 3b). The advantage of fixed stations is its low cost while its drawback lies in the need for an observer.
Limnimetric with optical system (mobile) station.
This type of station is located in places where the installation of a fixed hydrometric staff gauge water level is impracticable, or in order to protect the staff gauge water level from accidents caused by currents, waves, hits, etc., which usually occur during river flooding, as well as collisions with vessels or sailors who use them as mooring points. These stations consist of a system consisting of a mobile limnimetric staff gauge and a mobile optical level that is mounted on a tripod. The level measurements were linked to a fixed benchmark, BMRN, which is a marker made of 5-cm stainless steel or copper, built in a concrete base. The instantaneous water level is obtained by comparing simultaneous readings of the level staff on the BMRN against a previously levelled shore water level staff. This type of station has been established in the Amazon and the Plata Basins.
Reference bank level
In case of loss of the hydrometric station, the top level bank (NB) has been adopted as the altimetric reference. The reading of the water level can be done below the level bank in the low water level season or on the top level bank during floods (Figure 3b).

Current Protocol for acquisition and publication of the hydrological information
The Protocol to access and obtain the hydrological information is as follows (SNHN, 2014; SNHN 2017):
In the Harbor Captaincies and Naval Bases, there is a responsible person who performs the functions of an observer, who is responsible for reading the water level (either by the classical method for optical system of measurement or top level bank reference), recording data in the book of records.
The reading is transmitted to the Harbour Captaincy or Naval Base Communications Center, and from there to the SNHN in La Paz and then to Department of Hydrology (DH), where it is recorded and processed.
In the DH, the water levels variation curves are obtained, and according to the level of risk observed the respective alert will be transmitted to Naval Units that may be affected, who alert the riparian villages within their jurisdiction.
At the same time, reports are sent to institutions related to risk management: Ministry of Defense, Deputy Minister of Civil Defense (VIDECI), the headquarters of national emergency (COEN), General Command of the Bolivian Navy (CGAB), Navy Units, the pertinent local governments, and National Service of Meteorology and Hydrology (SENAMHI). Finally, it is communicated to the press, radio and TV channels.
Design of Hydrological Management of Early Warning System on the Web (SIGHW)
Geographic Information Systems (GIS) have multiple fields of application in the analysis and management of the risk of river flooding (Llorente, Díez-Herrero & Laín, 2009) from studies of endangerment to the adoption of prediction, preventive, or corrective (post-disaster) measures. The SIGHW system was designed for the management of the hydrological information of the SAT network and the risk of river flooding in the waterways of Bolivia, which is a geographic information system for distribution and access to the end user on the web.
The first stage of the design of the system was to define the geographical, hydrological and hydrometric information used, and give a standard format, since the original information is in different digital formats or on paper (such as tables, maps, charts, sketches, etc.) and must be scanned and then subjected to a quality control (GeoBolivia, 2014; Bernabé & López, 2012). Subsequently, the layers to be used in the system were defined. For the SIGHW, it had 22 stations that belonged to the network SAT. At some stations, such as the Guaqui, time series have more than 40 years of daily hydrometrics record. The following phases consist of the design of the architecture of the system and the functional, conceptual, logical and physical models, taking into account the recommendations made by GeoBolivia (2014), Franco (2016) and IDEAndalucía (2017).
Design of the architecture of the geographical information system
The architecture of the system levels are: user interface, application server and database.
User interface is composed of two types of applications:
- Heavy client: QGIS, ArcGIS or GvSIG applications can be used that have access to geographic geo-referenced information.
- Light client: access only to the geographic and tabular information using a web browser.
By means of these applications, it is possible to request the resources available on the web by means of the tools OpenLayers and GeoExt, which provide a set of widgets customizable for the visualization, editing and style of the information geospatial.
Server applications or middleware primarily provide and manage the resources requested and to handle the queries from the user. This level is a map server GIS that you access using the GeoServer.
Database: permanent storage of data and information management. The PostgreSQLPostgis software was used for its management.
Functional model
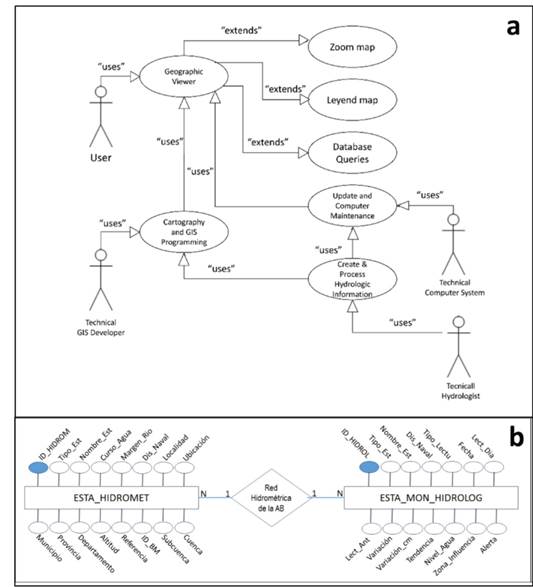
This model enables identifying the relationships between the user and the actors involved.
User: interacts directly with the Geographic Viewer, can display information, consult the legend and use the zoom and other buttons that facilitates interpretation and location of available geographic information.
Professional GIS: prepares the cartographic information required by the user, which is stored in thematic layers and includes gauge stations, hydrography, hydrographic basins, hydrological data, etc.
Professional Hydrologist: stores and processes the hydrometric data reported by AB units, for subsequent publication on the SNHN web site.
Professional computer systems engineer: is responsible for the information systems area, receives the hydrological information generated for publishing on the SNHN website and organizes it in a way that users of other organizations, such as the VIDECI, SENAMHI, AB, can access timely and up-to-date information.
Conceptual model
The conceptual model interrelates two databases: Esta_Hidromet, which corresponds to 45 hydro-meteorological stations in the RHAB network, and Esta_Mon_Hidrolog which corresponds to the 22 stations in the SAT system. Figure 4 shows the functional model with the different actors, and the conceptual model of the databases.
Logic model
The logic model defines the structure that contains the spatial database, taking into account the conceptual model for its development. Thus, the spatial database will permit consultations by means of SQL (Structured Query Language) across the PostgreSQL database manager. Consultations can also be performed with CQL (Contextual Query Language) by means of the geographic viewer. This was developed based on UML (Unified Modeling Language) nomenclature using Visio 2007.
Physical model
The last stage was the implementation of the physical model that defined the way of storing the information using the PostgreSQL relational database and the PostGIS spatial extension, considered to be the most suitable development tools for this project.
For the implementation of the SIGHW physical model, the "Hidrom" database was developed, which contains the layers based on information from the hydrological monitoring. The software used to manage and display the different geographic information layers is the QGIS, a client-server system licensed by GNU. You can perform SQL queries and identify the fields that describe hydrological aspects of the body of navigable water.
The GeoServer application takes care of displaying spatial information on the web, creating maps for different services, such as Web Map Service (WMS) and the standard Web Feature Service (WFS), allowing sharing and downloading of integrated data with OpenLayers.
To improve the visualization of the Cartographic elements in the GeoServer, the integrated programming language Styled Layer Descriptor (SLD) and the integrated development environment (IDE) tool NetBeans were used. In Figure 5 we show the physical model with different database fields.

Display of geographic information on the web
The purpose of this phase is to ensure that the information stored on the server maps GeoServer is available to end-users in the proper format, adjusting errors and defects found in acceptance testing, and verifying that the product complies with the requirements of the client user. Using the OpenLayers and GeoExt libraries developed in JavaScript, maps can be added to web pages under the NetBeans integrated development environment (IDE). To view the information at the Geoserver level, the Apache Tomcat web server was installed for tests in local host mode. Figure 5 shows a view of the geographic web viewer, which displays information from hydrological monitoring and secondary stations.
The geographic web viewer
This viewer is a tool that dynamically displays not only the information from hydrological monitoring stations in navigable water bodies, but also that of "secondary" hydrometric stations in the RHAB. The display is divided into six working sections: "Display name", "Main Panel", "Layers", "Legend", "Navigation tools" and "Options for hydrometric information access".
By selecting the option "stations for monitoring...", the table containing the hydrological monitoring data for current and previous water levels is displayed. Depending on the analysis of these data, details of the hydrological behavior in the navigable water body are provided.
Hydrological information management
In the viewer, a particular hydrological monitoring station can also be selected, and zoom can be used for the visualization and display of these data (see Figure 5).
In the architecture of the system, the database is identified as the core of the Information System. To do this, we used the PostGIS spatial database module, which is the tool to manage the hydrological information, allowing information to be accessible by the client using the web browser. PostGIS adds support for the creation of geographic objects to the object-relational database PostgreSQL, turning it into a spatial database for use in geographic information system. It is published under the General Public License (GNU).
However, updating the spatial database with new hydrological information only can be carried out by a user with administrator privileges (the Technical Professional GIS). This administrator accesses the "HIDROM" spatial database and modifies or updates data. This data modification is immediately displayed to the geographic web viewer.
Results and discussion
Among the final products obtained, we have a map of the hydrometric stations, which includes graphs of the river's hydrological behavior over the past 12 months and in the last 5 years. These products currently are not available to the end user, since they are products that have been made manually in paper format; but an additional application in the SIGHW is being developed to generate and distribute this information via the web. (Figure 6).

Figure 6 Geographic web viewer. Top: display and working sections. Bottom: Visualization of information related to the "Socrates Vargas" hydrological station.
The implementation and deployment of the SIGHW system will bring many benefits to the management of the hydrological information and water resources in the country, among which we can mention:
Minimization of the use of informatics for printing the document with hydrological information.
Reduction in cost for the implementation of the system.
Improvement in the management of the hydrological information.
Better use of installed technology resources.
Make use of the latest technologies through the implementation of a web-based GIS application.
Improvement in the quality of published hydrological information and optimization of time.
Publication and timely distribution of the hydrologic information on the web.
Improvement in scientific technical support for early warning systems and other applications.
Friendly and intuitive access to hydrologic information.
Hydrologic information management, using a spatial database management.
Conclusions
The international, mainstream development of new water management systems includes the particular case of data collected within the RHAB network. This network was lacking in terms of ease of use and access for consultation, requiring a modern manager for the optimization of the management of hydrological resources. For this reason, a new methodology was presented, which is a geographic information system (GIS) on the web that allows immediate access to the database of water levels by means of a geographic viewer that is easy to use. This system can be generalized to the hydrographic basin of other countries.
First, the classification of information as well as the levels of those receiving it needed to be established. Subsequently, the hydrologic information was organized with a geographic web viewer, with which publication and management of hydrological information was dynamically formatted and available and accessible from anywhere via the internet.
For the development of the system, different tools and applications software were integrated for free distribution, including the PostGIS spatial database manager, the GeoServer web maps server, the NetBeans integrated development environment and programming languages such as Java, HTML5, CSS, JavaScript, with OpenLayers and GeoExt libraries, as well as the Apache Tomcat web server.
This hydrological information system constitutes an indispensable element for early warning systems, which contributes to the prevention of disasters caused by extreme hydrological events, such as flooding or drought. The system is currently in production in stand-alone mode, and is scheduled for publication on the web in the near future.
The development of the SIGHW system was aimed at making the publication format and management of hydrologic information on the web very intuitive and easy to use, learn and manage. The database manager also provides immediate data for decision-making with respect to early warning systems, transportation and safe navigation in the navigable waterways of Bolivia, as well as for ports, tourism, fisheries, trade, and civil infrastructure, among others.
The next step is to migrate the current water level data acquisition system, which is a manual and analog system, to a real-time, digital, automatic data of recording system, after preparation and approval of implementation of the automatic system of the Bolivian Navy Hydrometric network.
Acknowledgements
The authors are grateful to Naval Hydrographic Survey (SNHN) of the State Plurinacional de Bolivia, for their support regarding the use of the RHAB hydrometric information, as well as in the use of equipment and technical literature.
REFERENCES
Álvarez, G., & Escalante, C. A. (2016). Análisis de frecuencias no estacionario de series de lluvia anual. Tecnología y Ciencias del Agua, 7(1), 71. [ Links ]
Baró, J. E., Delgado, C., Esteller, M. V., & Calderón, G. (2007). Curvas de daños provocados por inundaciones en zonas habitacionales y agrícolas de México. Propuesta metodológica. Ingeniería Hidráulica en México, 22, 91-102. [ Links ]
Bernabé, M. A., & López, C. M. (2012). Fundamentos de las Infraestructuras de Datos Espaciales (IDE). Ed. UPM Press. Madrid, España. [ Links ]
Berrocoso, M., Enríquez-de-Salamanca, J. M., Ramírez, M. E., Fernández-Ros, A., & Jigena, B. (2007). Determination of a local geoid for Deception Island (pp. 123). In: Antarctica: A keystone in a changing world. Washington, DC, USA: The National Academies Press. [ Links ]
Berrocoso, M., Fernández, A., Ramírez, M. E., Enriquez, J. M., Torrecillas, C., Pérez-Peña, A., Páez, R., García, A., Jiménez-Teja, Y., García, F., Soto, R., Gárate, J., Martín, J., Sánchez, A., De Gil, A., Fernández, J. A., & Jigena, B. (2008). Geodetic research on Deception Island and its environment during Spanish Antarctic Campaigns (1987-2007) (pp. 97-124). In: Reinhard Dietrich (ed.). Geodetic and Geophysical Observations in Antarctica. Berling, Heidelberg, Germany: Springer. [ Links ]
Campos-Aranda, D. F. (2015). Estimación del escurrimiento mensual en climas húmedos con base en modelos de regresión. Tecnología y Ciencias del Agua, 6(2), 113-130. [ Links ]
Chamorro, G. I. (2008). Guía de hidrometría de aguas superficiales. Medición del nivel de agua. Lima, Perú: Servicio Nacional de Meteorología e Hidrología. [ Links ]
Conagua, Comisión Nacional del Agua. (2011). Manual para el control de inundaciones. México, DF, México: Comisión Nacional del Agua, Secretaría de Medio Ambiente y Recursos Naturales. [ Links ]
Escuela Nacional de Protección Civil. (2015). Estado actual de los sistemas automáticos de información hidrológica (SAIH). En: Taller de actualización sobre gestión de riesgos hidrometeorológicos (72 pp.). Madrid, España: Escuela Nacional de Protección Civil. [ Links ]
Franco, R. (2016). Geoportales y visores geográficos en Colombia (pp. 144). Bogotá, Colombia: Universidad Distrital Francisco José de Caldas. [ Links ]
GeoBolivia. (2014). Implementación de la infraestructura de datos espaciales del estado plurinacional de Bolivia (IDE-EPB). La Paz, Bolivia: Vicepresidencia del Estado Plurinacional de Bolivia. Proyecto GeoBolivia. Recuperado de http://www.youblisher.com/p/731834-Publicacion-1/ [ Links ]
IDEAndalucía. (2017). Geoportal de datos espaciales de Andalucía. Andalucía, España. Recuperado de http://www.ideandalucia.es/portal/web/ideandalucia/ [ Links ]
Jigena, B., Vidal, J., & Berrocoso, M. (2015a). Determination of the tide constituents at Livingston and Deception Islands (South Shetland Islands, Antarctica), using annual time series. DYNA, Revista de la Facultad de Minas, 82(191), 209-218. [ Links ]
Jigena, B., Vidal, J., & Berrocoso, M. (2015b). Determination of the mean sea level at Deception and Livingston islands, Antarctica. Antarctic Science, 27(1), 101-102. [ Links ]
López, J. L. (2005). Estrategias de mitigación y control de inundaciones y aludes torrenciales en el Estado Vargas y Valle de Caracas: situación actual y perspectivas futuras. Revista de la Facultad de Ingeniería, 20(4), 61-73. [ Links ]
Llorente, M., Díez-Herrero, A., & Laín, L. (2009). Aplicaciones de los SIG al análisis y gestión del riesgo de inundaciones: avances recientes. Actas I Jornadas Técnicas SIGTEFOR. Cuadernos de la Sociedad Española de Ciencias Forestales, 29, 29-37. [ Links ]
Návar, J., & Lizárraga, L. (2016). Patrones temporales de flujo del río en las cuencas del norte de México. Tecnología y Ciencias del Agua, 7(1), 35. [ Links ]
OEA, Organización de Estados Americanos. (2010). Programa Centroamericano para la alerta temprana ante inundaciones en pequeñas cuencas (SPV) y reducción de la vulnerabilidad: Desarrollo de una Plataforma Nacional (edición especial). En: Manual para el Diseño, Instalación, Operación y Mantenimiento de Sistemas Comunitarios de Alerta Temprana ante Inundaciones (81 pp). Washington, DC, USA: Organización de Estados Americanos. [ Links ]
SNHN, Servicio Nacional de Hidrografía Naval. (2007). Hidrografía de Bolivia. La Paz, Bolivia: Ministerio de Defensa, Servicio Nacional de Hidrografía Naval. [ Links ]
SNHN, Servicio Nacional de Hidrografía Naval. (2014). Memoria Hidrométrica 2001-2014. Informe Técnico. La Paz, Bolivia: Servicio Nacional de Hidrografía Naval. [ Links ]
SNHN, Servicio Nacional de Hidrografía Naval. (2017). Portal del Servicio Nacional de Hidrografía Naval. Recuperado de http://hidronav.org/?q=node/33 [ Links ]
UNESCO, United Nations Educational, Scientific and Cultural Organization. (2006). Water, a shared responsibility. The United Nations World Water Development Report 2. New York, USA: UNESCO. [ Links ]
UNESCO, United Nations Educational, Scientific and Cultural Organization. (2012). Sistemas de alerta temprana 10 preguntas y 10 respuestas para la comunidad educativa de Panamá. Proyecto Regional DIPECHO VII UNESCO-CEPREDENAC. San José, Costa Rica: UNESCO. [ Links ]
Received: May 31, 2017; Accepted: January 26, 2018
 Este es un artículo publicado en acceso abierto bajo una licencia
Creative Commons
Este es un artículo publicado en acceso abierto bajo una licencia
Creative Commons
