


 text new page (beta)
 English (pdf)
 Article in xml format
 Article references
 Send this article by e-mail
 Cited by SciELO
  Similars in
SciELO
Similars in
SciELO 
 Permalink
1 Introduction
With the adoption of microservice architecture, a major paradigm shift has been observed in the way applications are managed traditionally in monolithic architecture. Here, each service is considered as an independently deployable component those perform a specific function.
In a well-designed microservice based architecture each service is designed to manage its own data.
Because of the implementation of independent components, a lot of flexibility has been observed in feature addition/removal, maintenance and debugging [13].
With all these advantages, microservice based architecture also comes with a lot of challenges especially from monitoring point of view. Because of their highly dynamic nature, large volume of multivariate and multi-dimensional data is generated which is almost impossible to be handled using traditional forms of monitoring.
So, in case any fault arises, due to the large number of correlated components, the fault can be replicated on multiple endpoints and finding the source of error becomes too difficult [12].
In a large scale production environment, the performance is monitored using Service Level Objectives (SLO) and Service Level Indicators (SLI) where SLO acts as a statement of desired performance and SLI acts as a measurement of performance [8]. Whenever there is any fault in the system, there is a possibility of multiple anomalies getting detected due to the large number of correlated, interdependent components and the complexities in modern day infrastructure deployments.
In such a scenario finding or closing down to the exact root cause of the fault/problem by correlating the detected anomalies has become one of the primary requirements of engineering. In recent years, faster root cause analysis has become a major research area as it will help in better MTTR.
1.1 Motivation
In order to ensure a smooth functionality along with a high uptime, looking into the performance issues, tracing down to the root cause and pin pointing the origination of the problem must be done in an urgent basis [1]. However, a very less number of works have been done till date to find the root cause analysis on a complex production infrastructure due to the following challenges:
Inter-linked and inter-dependent services: A large number of interdependent services can be available in a typical microservice based architecture. Thus, in case of failure or degradation of one of these services can have a cascading effect on other dependent services resulting in anomalies in multiple services which creates a complex situation to track the root cause.
Availability of large number of monitoring metrics: In order to take care of the performance related issues, large number of monitoring metrics is used. It generates a huge overhead for the root cause analysis purpose as lots of parameters and logs are generated.
Support for multiple languages: Services deployed in a microservice based architecture can be developed using multiple technology stacks and various programming languages which makes it difficult to correlate the errors as each languages and technology have their own way of reporting problems.
Microservices get frequently updated: To cater to the needs of the customers (based on their feedbacks) updates for microservice are released very frequently. Thus it makes the environment changing very often and makes the root cause analysis arduous.
Complex Infrastructure: With more distributed computing, complex IT infrastructure usage as well as extensive use of virtualization, finding out the actual cause of any issue has become a humongous task.
1.2 Objective
The objective of this work is to reduce the MTTR by correlating all the raised anomalies and pinpointing the cause of the issue leading to shorter turnaround time.
The remaining of the paper is organized as follows – Section 2 cites the related works done till date. The proposed work is stated in Section 3. The implementation of the proposed work, experimental setup, and analysis of results are presented in Section 4. Section 5 covers the conclusion and future work.
2 Related Work
Even though, Root Cause Analysis (RCA) has been a subject of research since past decade, the contribution could not be significant due to the unstructured, highly variant and multivariate nature of the data. All the works done in the field of RCA can be categorized into Deterministic and Probabilistic family of models. Deterministic models are based on the certain known inferences and facts where are as Probabilistic models are able to handle uncertainties.
Various versions of Bayesian network with different subtypes and properties with varying learning or inference complexities, Markov Logic Networks, Sum-Product Networks, Relational Sum-Product Networks were the various models with logics like Dempster-Shafer Theory, Non-axiomatic Logic, Fuzzy logic were used in Probabilistic models whereas SVM, Neural Network, Decision Tree models were implemented using logics like First Order Logic, Abductive Logic Program, Fault tree and Propositional Logic were used in Deterministic model [5].
Even though so many approaches have been used, most of them are based on time series data generated from various logs, execution traces and also work on the already available and fixed training data. Most of them are not being able to handle the unstructured, highly changing, and multivariate data getting generated in a microservice based environment and are not efficient to work on unsupervised models.
The models those are based on the unsupervised learning turn out to be costly as the time complexity calculated to be of exponential order.
In ExplainIt! [2], Jeyakumar et al. proposed an unsupervised, declarative RCA engine. The time-series monitoring data from data centres in large complex systems have been used as data source. The use of causal hypothesis specified by empowered operators is ranked thereby reducing the number of causal dependencies significantly.
The researchers have used SQL as an effective tool to enumerate hypothesis which can be instrumental in creating the graph based causal model of the prospective system. For the inference of root cause Monitor Rank [15] – a customized random walk algorithm was proposed by Kim et al.
Using this model, a list of possible causes ranked by the order of viability is generated by using historical and current time series metrics. MicroScope [14] is applied on a microservice based environment to produce a ranked list of possible root causes.
Lin et al. have inferred the causes of problems related to performance in real time by drawing a causal graph. In MicroRCA [1], Wu. L. et al. proposed a root cause analysis engine for microservice in case of performance issues. The authors used correlation of application performance symptoms with actual consumption of resources for inferring the root cause. Attributed graph has been implemented for localizing the anomaly propagation across systems.
Event graph based approach was adopted by Wang. H. et al. for developing GROOT [3]. Here, taking inputs from various logs, metrics and activities from the underlying system, a real-time graph is constructed. Based on the faulty points the root cause is traced from this causality graph.
Saha, A. et al. proposed an Incident Causation Analysis (ICA) engine where they have used SoTA neural NLP techniques for necessary information extraction from Problem Review Board (PRB) Data. Using this information, a structured Causal Knowledge graph was constructed by the authors. The researchers used ranking algorithm to trace to the root incidence [4].
3 Proposed Model
This section contains the detailed explanation of the process of correlating the detected anomalies and the root cause analysis. Recently, more and more large business enterprises are moving towards adoption of microservices. The components used in microservices can be easily built, tested, and deployed independently without affecting the existing parts of the entire application much. This flexibility and easier management make the architecture simple, agile, scalable and more secured [6].
The deployment strategies for microservices play a very important role in ensuring reusability, agility and lowering the impact on the application [7]. A glossary of the terms used in this work is explained below for better understanding of the model.
Pod refers to a group of single or multiple containers on a single host machine. A Pod has a unique IP address which shares the same specification for running and shares the storage and network resources. An application running on a set of Pods performing same functions can be referred to as Service. Services are normally abstracted from outside the cluster.
Only an external IP address is exposed. A worker machine is called a node in a cluster setup. Depending on the cluster, a node can be a physical machine or it may be a virtual one also which is managed by the control plane. One or multiple pods may run on a single node.
In a cluster, scheduling of the all pods present across the Nodes is done by the orchestration tool. A sample deployment of microservices is shown in Figure 1.

The proposed Root Cause Analyzer (RCA) engine – trACE, takes the input from the Anomaly Detection Engine, which is first passed through the Node Detection Engine to detect the chances of any node related or hardware faults. If it is not a hardware or node related problem, then the anomalies are passed through the Service Detection Engine to trace down to the fault originator service or defective pod.
A block diagram of the proposed model of trACE is shown in Figure 2.
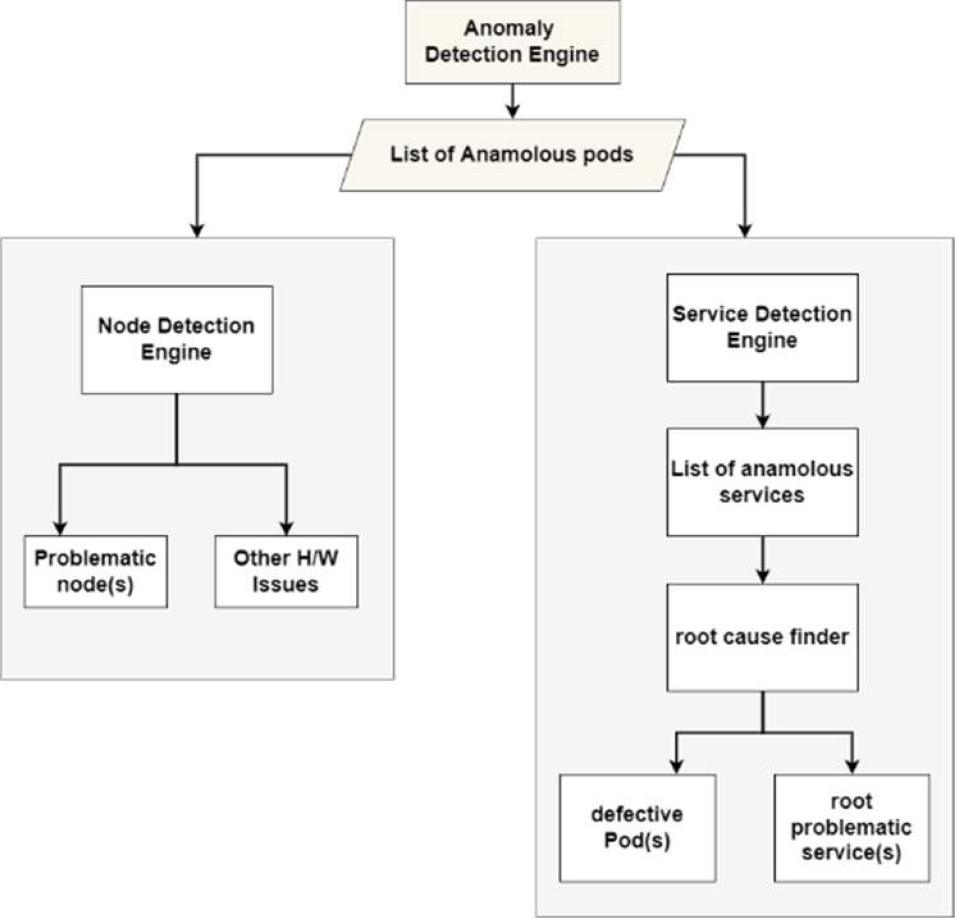
The detail description of each of the engine used in the model is given in section 3.1.
3.1 Anomaly Detection Engine
ADE is responsible for generating anomalies across services. These anomalies can help us to understand which pods are not behaving on expected lines. There are various methods which can be used to generate anomalies which includes percentile methods [10], isolation forest method [11], one class SVM [9] etc. The details of the various methods to find anomaly is beyond the scope of discussion.
Once the anomalies are collected, these are passed to trACE. A flow chart of the proposed model is shown in Figure 3 and Figure 4. The steps shown in Figure 3 check whether the anomalies raised in the system are generated due to any hardware problem or configuration or not.


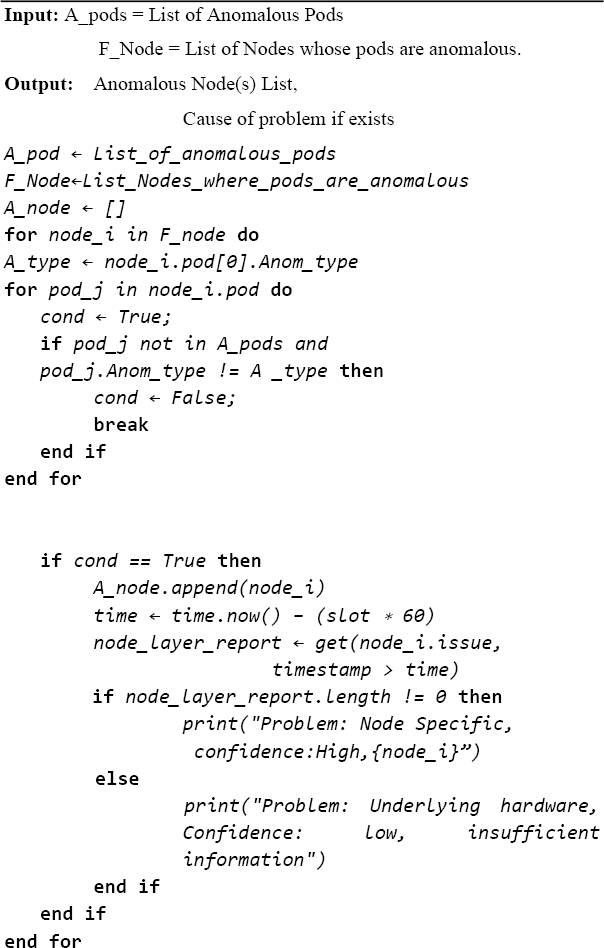
The main purpose of the model is to narrow down the actual cause of the reported faults and anomalies. To begin the process, possibilities that the reported failures are caused by any hardware faults are eliminated. In this context, whether the problem lies in the worker node is checked as they host all services. For this purpose, a Node Detection Engine is proposed and the design of the code is given in Algorithm 1.
If the problem is not originated from any hardware fault, then the service from where the fault is originated is located. In this regard, a Service Detection Engine is proposed as per the design explained in Algorithm 2. This engine is designed to find the affected services, and pinpointing exactly which service(s) is/are causing the issue.
3.2 Node Detection Engine
The root cause analyser first checks for the chances of problem arising from hardware fault. If the problem primarily lies in the hardware, then all the services hosted on it as well as all the services which are dependent on these set of services will be affected and show anomalies. Thus, hardware related issues are detected first.
The list of pods that show anomaly are taken as input to the trACE by Anomaly Detection Engine. This list of anomalous pods is named as ‘Anomalous pods list’ in this work. Then this list is taken as an input to the proposed Node Detection Engine where each worker node is checked.
Assuming that there are p number of pods are running on worker node Hk such that P(Hk) = {P1, P2, P3, ....., Pp } where, P represent the total set of pods on a worker node. Then it is checked whether all the pods of this worker node are present in the anomalous pods list or not. If ‘no’ then the checking for next worker node is made.
If ‘yes’ then it is checked whether all the anomalies generated in the pods of that worker node are similar or not. If not, then it moves on to the next worker node else that worker node is appended to a list called Anomalous node list.
After the iteration is completed, the next level of checking is done by iterating through the Anomalous node list to find out whether the issues are reported in the node layer or not. If ‘no’, then the problem might exist in underlying hardware; however, if the condition is true then problem is node specific. If the Anomalous node list is empty, then the service issues are checked.
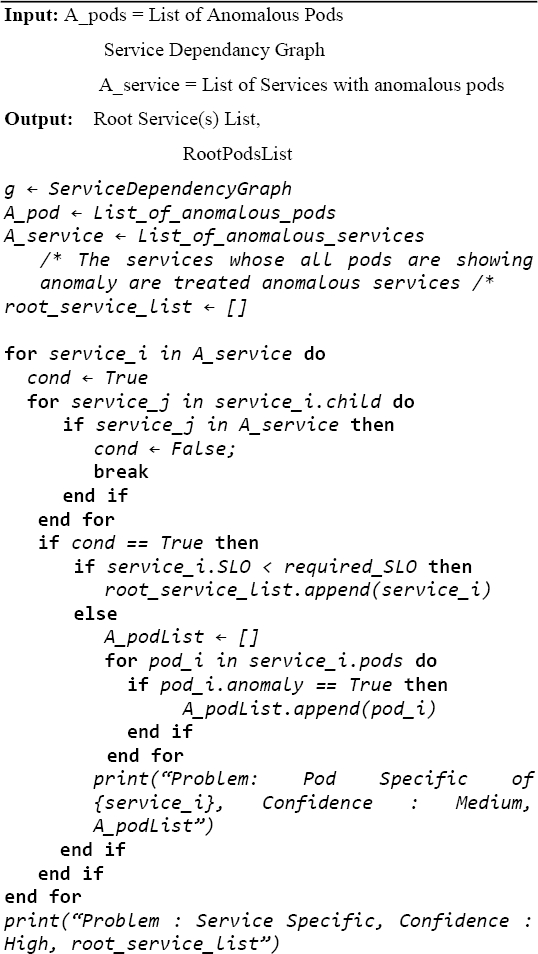
3.3 Service Detection Engine
Service Detection Engine (SDE) takes the list of anomalous pods as input and creates clusters to find the services those are either not meeting the SLO or on the threshold of not meeting it. All the anomalous services are added to Anomalous service list. A service dependency graph is taken as input which shows the connectivity between services where failure of one service will lead to the other.
Next, all the services in the Anomalous service list are iterated to check whether any of the child of this service exists in the list or not. If any of the children exists in the Anomalous service list, then the next service is considered and the process repeats. If none of the child is present in the list or if this service doesn’t have any child then, the percentage of the anomalous pods affected in the service are found. If this percentage is lower than accepted threshold value then the root cause of the issue is stated as pod specific, however if this percentage is higher than the threshold then the root cause is stated as specific to the service(s).
4 Experimental Analysis
For a concrete evaluation of the proposed model, test runs were carried out on a real life system as well as on a testbed created similar to those of the existing work [1] for performance comparison. The details of experimental setup, dataset collection, implementation, and performance evaluation are described in this section.
4.1 Experimental Setup
4.1.1 End-to-End Environment Used for Testing
The proposed RCA algorithm was evaluated on a real-time on premise server environment. The algorithm was applied on SOA University Server System that serves more than 30,00,000 requests per month and has a user base of 50,000 users. Specifically, its RCA algorithm was applied on several complex microservices ecosystem that runs more than 10 services like frontend, User Profile for students, Attendance, Accounts, Examination, Admission, User Profile for Professors, ERP Service, Notice board, Placements, etc.
Each of these services are running on two data centres for several institutes across the University including Faculty of Engineering Studies, Faculty of Medicines, Agriculture, Business Administration, Law, and Hotel Management to name a few.
These are interactive services those are built on different tech stacks including Java, NodeJS, ReactJS, and MySQL. The inter service communication is established with the help of different types of service protocols.
A list of several services those are running in the server where anomalies were detected, number of times in a day when an anomaly was raised, and the number of times the root cause could be successfully localized using our proposed trACE is depicted in Table 1.
Table 1 The service-based anomalies data detected on the SOA end-to-end test environment
| Sl. No. | Services on the end-to end environment | No. of times anomaly was detected per day | Number of times root cause was correctly localized |
| 1. | Frontend | 12 | 9 |
| 2. | Students Profile | 10 | 10 |
| 3. | Attendance | 16 | 11 |
| 4. | Accounts | 7 | 6 |
| 5. | Admission | 7 | 7 |
| 6. | Examination | 3 | 3 |
| 7. | Professors Profile | 7 | 7 |
| 8. | ERP Service | 3 | 1 |
| 9. | Departments | 5 | 4 |
| 10. | Notice board | 3 | 3 |
The current environment consists of a Kubernetes cluster, Prometheus as monitoring system and Istio as service mesh. There are ten worker nodes and three master nodes in the cluster. The detailed hardware component description for the master nodes and the worker node setup environment with the operating system (OS) is illustrated in the Table 2.
4.2 Dataset Collection
The entire input for creation of dataset was given by the Operations and management team at SOA data centre. A labelled dataset was created which contained 296 incidents over 12 months (Jan 2021 –Jan 2022) where 192 root cause on service related incidents and 104 root cause on incidents related to nodes were logged.
The required input to the algorithm like pods causing anomaly, service dependency graph, and the root cause were manually labelled. Two categories of root-cause those could be traced are mentioned in the dataset as root cause on service and root cause on nodes.
Root cause on Services: The incidents are detected based on anomalies from the in services. For example: problem due to deployment, request timeout, and memory leak etc.
Root cause on Nodes: The incidents are detected due to errors in Nodes. For example: CPU hog, memory failure, disk crash, and network fault, etc.
The collection, validation and manual labeling of root causes were made by the operations team who handle the site incidents on a daily basis. In case, there were multiple causes, only the best relatable cause with the most prominent event was tagged as the root cause.
These incident contexts and labeled root causes were considered as the parameter to judge the effectiveness of the suggested algorithms in the evaluation process.
The entire dataset was used for testing purpose and the results were validated by comparing results obtained on applying the proposed algorithm against the labels already given in the dataset.
4.3 Performance Evaluation Metrics
For the performance evaluation of proposed RCA algorithm, the results were analyzed over defined set of metrics like accuracy, mean-accuracy and time-cost involved. A detailed description of the various metrics used for performance evaluation of the proposed algorithm is given below.
Accuracy: Accuracy is defined the degree to which the result of the RCL algorithm conforms to the correct value or to the actual root cause:
Accuracy = (TP + TN)/ (TP+ FP+ FN+ TN), where True Positive (TP): the algorithm has localized the correct root-cause which is the actual root cause. True Negative (TN): the algorithm has given clean chit to a node/service and in reality also the node/service are meeting the hardware or service requirement. False Positive (FP): the algorithm has pin pointed a root cause, but the reality being something else. False Negative (FN): the algorithm has given clean chit to a node/service but in reality that node/service is the root cause.
Mean_Accuracy: Mean Accuracy sums up the average performance accuracy of the algorithm over the Dataset used above and the real-world end-to-end test environment:
Mean_Accuracy(Am) = summation of (Ad + Ae) / 2,
where Ad= Accuracy achieved in the test-dataset, Ae= Accuracy achieved in the real-world end-to-end environment.
Time-costs: The time-costs are the total run-time cost associated for running the RCL algorithm on the test datasets as well as the real-world test environments (S ‘O’ A University Server). It is calculated in seconds:
Run-time Costs(RTC)= Tf –Ti,
where Tf= Final timestamp when algorithm ends, Ti= Initial timestamp when algorithm starts.
4.4 Results and Analysis
The RCA Algorithm was tested on the given test dataset prepared by the operation and management team at SOA University Server containing past data of failure incidents.
It was also deployed on a real-world running microservice environment that is SOA University Server that hosts nearly 10 different services on two datacenters and has nearly 30,00,000 requests per month and a user base of 50,000 users.
The results of the RCL algorithm for each dataset instance were carefully observed and then analyzed based on several parameters discussed above like Accuracies, Mean_Accuracies, and Time-cost.
The detailed performance or the experimental results for the RCA algorithm on the test dataset and real-world end-to-end environment is depicted in the Figure 5. It presents an overall time-cost of the algorithm when it was run multiple times on different server environment under varied conditions obtained by trACE. From Figure 5, it can be stated that the proposed algorithm worked really well for both of the testing environment that is on the Test Dataset as well as the real-world End-to-End Environment.

Fig. 5 Accuracies of the trACE implemented on the end-to-end environment and predefined dataset for both Service-based and Nodes-based datasets
trACE when implemented on the prepared dataset obtained 97.4%, 91.8% for the service based and node based root cause types respectively. Similarly, accuracy obtained were 92.03%, 89.7% when applied on the end-to-end environment for service based and node based root cause types.
Thus results found indicate an overall accuracy of 94.72% and 90.75% on both the experiment types root-cause on Services and root-cause on Nodes, which makes it fit for to working in real world complex microservice environments.
The MMTR in seconds after running the algorithm on different instances of the prepared dataset and in the real-time end-to-end environment as given in Table 3 are found to be optimal when compared to other baseline and state-of-the-art models.
Table 3 The runtime cost of trACE applied on dataset and end-to-end environment
| Experiment # | MTTR in seconds(s) | |
| Dataset | End-to-End Environment | |
| 1 | 1.180 | 4.279 |
| 2 | 1.072 | 4.204 |
| 3 | 1.31 | 4.310 |
| 4 | 1.26 | 4.813 |
| 5 | 1.105 | 4.763 |
| Average | 1.1854 | 4.4738 |
This cost efficiency attained through trACE in terms of real-time makes the algorithm suitable to work in any real-world microservice environment. Even though the proposed RCA algorithm is implemented on a containerized environment monitored by Prometheus with Istio, it works good even if when implemented without any special type of monitoring tool.
4.4.1 Simulated Environment for Comparative Performance Evaluation
A testbed with similar infrastructural provisions and tools as used in MicroRCA [1] was configured on Amazon Web Service (AWS) and the same benchmark demo application was used for a comparative analysis. In this experimentation a comparative study of trACE is done with some of the state of the art graph based methods like Microscope [14] and MicroRCA [1] and a baseline method as applied in Monitor Rank [15].
A comparison of the root cause localization performance based on the Mean Average Precision (MAP) recorded by some baseline methods such as MonitorRank and Microscope as well as a state-of-the-art method MicroRCA is given in Table 4.
Table 4 The MAP comparison of trACE with other state of the art and baseline methods
| Model | Metric | ||||
| CPU Hog | Memory Leak | Latency | Overall | % of improvement in trACE | |
| Monitor Rank | 0.77 | 0.68 | 0.73 | 0.73 | 34.25 |
| MicroScope | 0.92 | 0.95 | 0.7 | 0.85 | 15.29 |
| MicroRCA | 0.97 | 0.98 | 0.97 | 0.97 | 1.03 |
| trACE | 0.98 | 0.98 | 0.97 | 0.98 | |
From the performance shown, both MicroRCA and trACE have shown better results when compared to Microscope and MonitorRank.
However, it has been observed that all the works done have experimented on service based faults and none of them have taken care of finding the root cause for issues generated due to any hardware or node related faults, which has been duly taken care by trACE.
5 Conclusion
In this work, authors proposed a technique for determining the correlation between alerts or anomalies from all the subsystems and tracing down the root-cause of the anomalies in a modern infrastructure deployment, where a lot of anomalies can be generated at multiple endpoints due to a single fault.
The experimental findings led to the conclusion that any infrastructure system failure can have one of the four possible root causes: a pod failure, a service failure, a node failure, or a data center failure. The proposed method finds or closes down the source root cause of the fault or problem by correlating the detected anomalies.
An effort has been made to rule out the potential reasons starting at the bottom in order to localize the root cause. The trACE ensures that platform or data center level faults or degradations can have a cascading effect and result in a number of anomalies, all of which can be connected at once and resolved.
This will not only improve the MTTR but also ensure smooth functionality of the system with a high uptime, thus resulting in a more reliable and efficient system.

