


 text new page (beta)
 English (pdf)
 Article in xml format
 Article references
 Send this article by e-mail
 Cited by SciELO
  Similars in
SciELO
Similars in
SciELO 
 Permalink
1 Introduction
Floods are natural events that occur around the world. They are derived from extreme precipitations of hail, rain or snow, waves or failures in hydraulic structures.
For Consequently, they cause the increase of surface water levels in rivers, lakes, lagoons or oceans. These events cause serious damage to agriculture, livestock and infrastructure with great costs to people and the economy of the countries [5]. Likewise, they cause human losses and lead vulnerable populations to poverty.
According to the United Nations Office for Disaster Risk Reduction (UNDRR), more than 45% of the world’s population has been affected by floods [32]. In Mexico, floods are constant in different áreas. Particularly, the south of Mexico has been an área affected by floods [20].
These events originate in the rainy seasons, which begin in May and end in November, having repercussions in the rise in river levels and the spillage of their flows on tracts of land dedicated to productive activities or in áreas with urban settlements: the most recent case occurred in November 2020fn.
With the development of new satellite platforms and tools and increasingly advanced sensors, it is possible to collect a large amount of data from the earth and capture very useful information [30]. Earth observation satellite programs have allowed numerous investigations focused on flood detection, soil analysis, natural damage monitoring, etc.
The Information acquired by satellites has different properties such as: 1) spatial resolution, which determines the área of the earth’s surface covered by each pixel of the image; 2) spectral resolution, which represents the electromagnetic spectrum captured by the remote sensor, the number and width of regions, and 3) temporal resolution, which determines how long satellite information can be obtained from the same location with the same satellite and radiometric resolution [15].
Among the Earth observation satellite programs is Copernicus. It has great capacity in the acquisition of remote data with high temporal and spatial resolution useful for mapping floods. It is made up of 5 satellites developed for different purposes: Sentinel-1, provides Synthetic Aperture Radar (SAR) images useful for observing land and oceans; Sentinel-2, provides multispectral terrestrial optical images; Sentinel-3 and 6, for marine observation and Sentinel-4 and 5 for air quality monitoring [7, 29, 13].
The optical images show the variations depending on the cloud, which does not allow to penetrate the cloud layer that is usually present during precipitations.
On the other hand, SAR images are based on the reflectance of energy, which makes it effective during the day and at night. Consequently, they are not affected by weather or atmospheric conditions.
These characteristics make them used for flood mapping or environmental monitoring. Different methods have been proposed in the literature for the detection and monitoring of water bodies. Some use multispectral optical images and SAR data using supervised and unsupervised algorithms.
Thresholding techniques, such as the Otsu method, are widely used for the detection of bodies of water [19, 28].
However, when perturbation factors are present in SAR images that influence the backscatter, it may be less effective [16]; when using optical imaging, threshold spectral indices may be off due to the sensitivity of NIR (near-infrared) reflectance.
On the other hand, Deep Learning (DL) techniques have emerged in recent years.
This has allowed the development of new methods using SAR images for various objectives such as the classification of land cover [25], extraction of water bodies [11], etc. Semantic segmentation algorithms have been the main factors in automated analysis of remotely sensed images to find and delimit a specific área.
In particular, Convolutional Neural Networks (CNN), a specific type of DL, have gained wide acceptance due to their good performance and ease of training compared to other types of DL [2]. CNN’s are made up of multiple layers of processing, which are the result of performing spatial convolutions; usually followed by trigger units. On the other hand, Recurrent Neural Networks (RNN) [27] are also being used in remote sensing since they can handle data sequences (for example, time series), in such a way that the output of the previous time step is fed as input to the current step.
With the recent rise of Deep Convolutional Neural Networks (DCNN), several network models have been proposed for segmentation tasks such as: pyramidal networks, such as PSP-Net [35]; based on dilation convolution, such as DeepLab [6]; encoder-decoder based, such as HR-Net [26], U-NET [27], etc.
This research presents a strategy for detection and monitoring of flooded áreas using the U-NET deep learning model and Sentinel-1A SAR satellite images. The study área is the Ríos zone in the state of Tabasco, Mexico. This document is structured as follows: Section 2 shows the related works; in Section 3, the materials and methods implemented to carry out the investigation are presented; in Section 4, the results obtained are presented; and finally in Section 5 the conclusions obtained in the research work are presented.
2 Related Works
SAR data and artificial neural networks, particularly convolutional neural networks (CNN), have been implemented in various studies and have been found to be effective in tracking land cover, this is due to their great ability to capture information in the earth’s surface regardless of weather conditions.
In recent years, researchs focused on the analysis, monitoring and review of damage caused by floods has been carried out [4, 33].
Twele et al. [29] developed a fully automated processing chain to map flooded áreas from Sentinel-1 images. They combined the threshold, the HAND index and the classification based on fuzzy logic, with which they achieved an overall precisión between 94% and 96.1%, and a kappa coefficient between 0.879 and 0.91.
Fernández et al. [9] and Pech-May et al. [21] present studies carried out in Tabasco, Mexico. In both works they provide an analysis on the use of SAR satellite images and their usefulness for monitoring terrestrial phenomena.
They highlight the advantages of using SAR satellite images, under cloudy and rainy conditions; In addition, they developed a methodology to determine the behavior of floods that occur in the rainy season using machine learning.
Zhao et al. [36] used convolutional networks and SAR images to classify buildings, vegetation, roads, and bodies of water. They used TerraSAR images of the city of Wuhan to train their algorithm. Training was in horizontal image patches using 2244 sheets of 100 x 100 pixel images. The precisión obtained was 85.6%.
On the other hand, Scepanovic et al. [37] created a land cover mapping system with 5 classes. They applied several deep learning semantic segmentation models pretrained with SAR Sentinel-1 imagery.
They used the following deep networks: UNet, DeepLabV3+, PSPNet, BiSeNet, SegNet, FCDenseNet, and FRRN-B. Based on their results, FC-DenseNet. They achieved a better overall precisión of 90.7%.
Konapala et al. [14] presented a strategy for the identification of floods from SAR satellite images. In [23] they use Sentinel-1 and Sentinel-2 to identify flooded áreas. Likewise, Yu Li et al. [17] conducted a study where they analyze hurricanes.
Finally, Recurrent Neural Networks (RNN) are being used for the analysis of water bodies and land cover using Sentinel images [3, 12]. In [24, 18, 31] they have proposed approaches that incorporate recursive and convolutional operations for spatiotemporal data processing.
3 Materials and Methods
The proposed strategy has three main phases. Figure 1 shows the methodology with each of the activities of each phase. Each stage is explained below.

3.1 Study Area
Tabasco is located in the southeast of Mexico, on the coast of the Gulf of Mexico. In terms of surface, it ranks 34th at the national level with a territorial extension of 24,661 km2, which represents 1.3% of the country.
Two regions are recognized in the entity: Grijalva and Usumacinta, which contains two subregions (swamps and rivers). Together they form one of the largest river systems in the world in terms of volume.
In addition, the average precipitation of the state is three times higher than the average precipitation of Mexico and represents almost 40% of the country’s fresh water.
The abundance of water and the impact of dams on the region’s hydrology alter the natural flow of rivers, causing flash floods that affect drinking water, health and the lives of thousands of people [8]. Therefore, flooding is common in the region.
However, in the fall of 2020, several cold fronts and hurricanes caused the worst flooding in decades, causing human and economic losses.
The study área is centered on the Ríos subregion (see Figure 2). It is located in the Eastern of the state, on the border with the state of Campeche and the Republic of Guatemala.
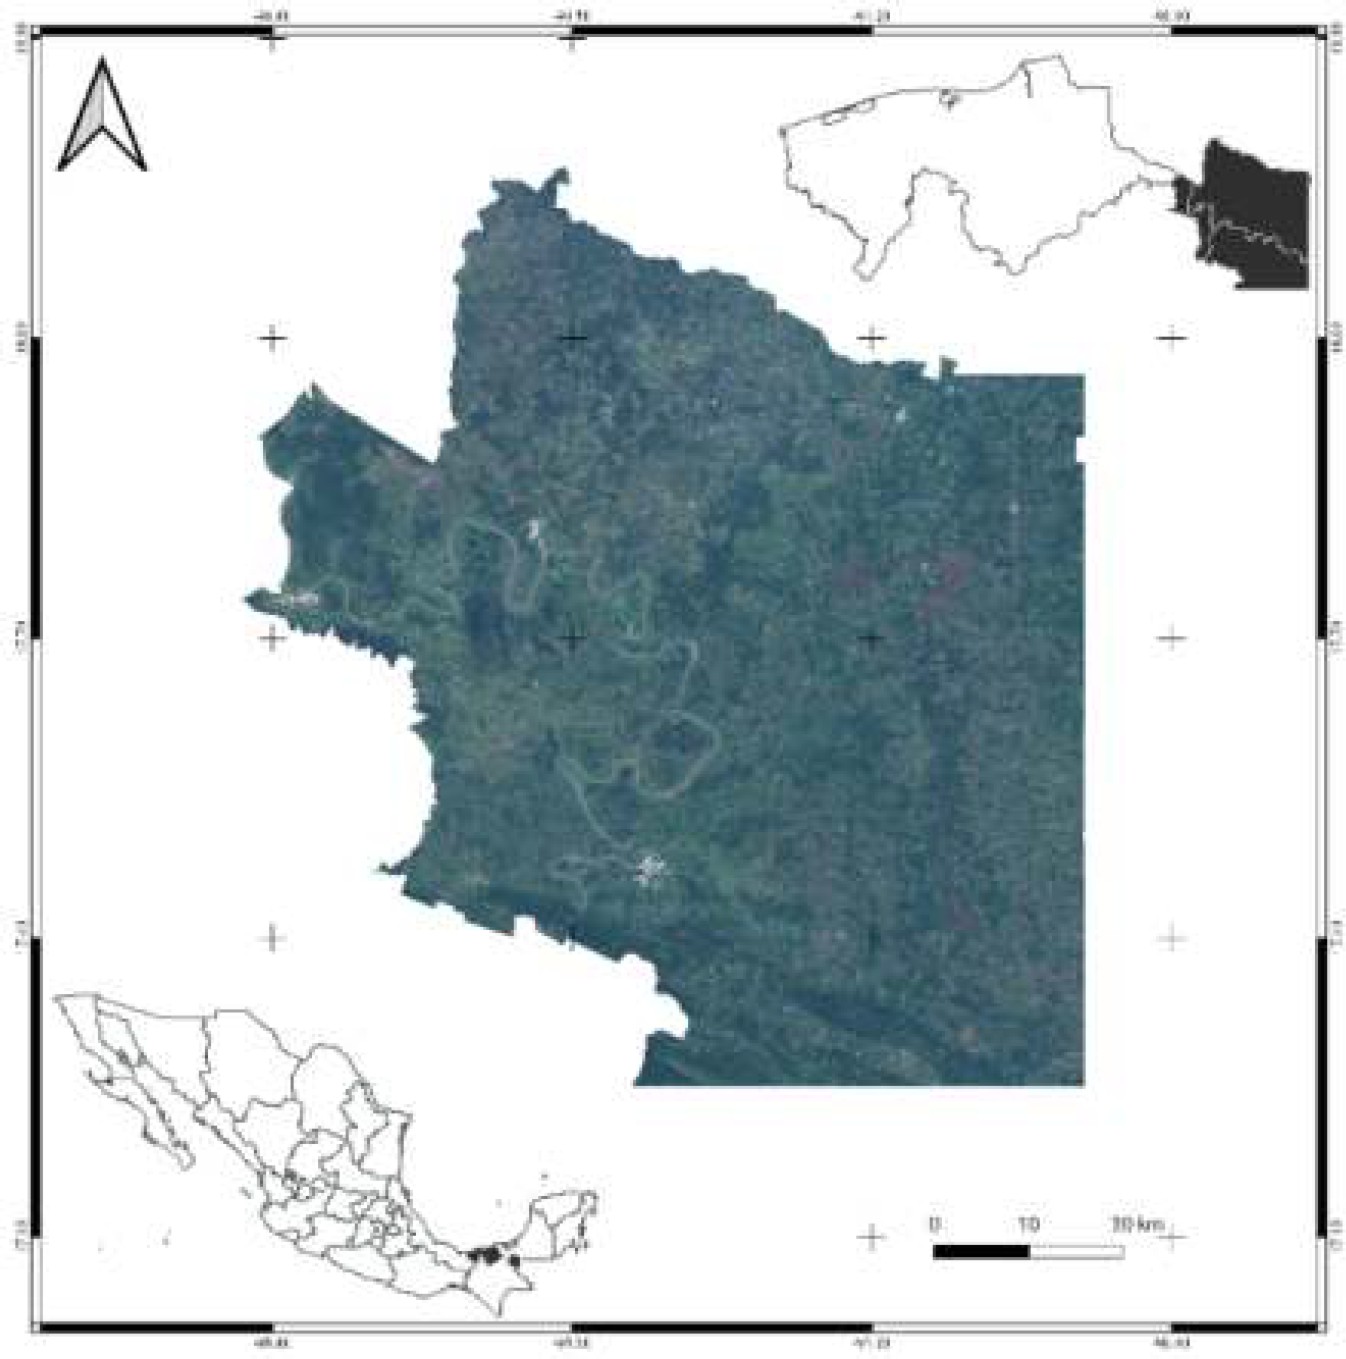
It is named for the large number of rivers that cross it, including the Usumacinta River, the largest in the country, and the San Pedro Mártir River.
The municipalities that make up this subregion are: Tenosique, Emiliano Zapata and Balancán. Its surface is approximately 6000 km2, which represents 24.67% of the total state.
3.1.1 Image Acquisition
Cross-polarized (VH) SAR images obtained from the Sentinel-1 satellite through the Copernicus Open Access Hubfn platform were used to map the floods. These images are found within a tile that covered the states of Campeche, Chiapas and Tabasco (See Figure 3).

The images used correspond to the date November 2020 and September 2022, this is because during these periods there were medium-scale floods in the study área. In addition, the estimated flood map generated by the National Civil Protection System (SINAPROC-MEXICO) was used.
3.1.2 SAR Images Proprocessing
To eliminate distortions, flaws or noises that interfere in the treatment, pre-processing was applied to the SAR images (see Figure 4):
– Radiometric correction. It was applied to correct the distortions of the radar signal caused by alterations in the movement of the sensor or instrument on board the satellite. It should be noted that the intensity of the image pixels can be directly related to the backscattering signal captured by the sensor. Figure 4a and 4b show an example of an image before and after correction.
– Speckle filter application. Speckle filtering was applied, non-Gaussian multiplicative noise, which indicates that the pixel values do not follow a normal distribution, which causes the images to have a salt and pepper effect. Consequently, the 7x7 Lee [22] filter was used to standardize the image and reduce this problem (see Figure 4c).
– Geometric calibration. SAR images may be distorted or rotated, requiring rearrangement. To make the geometric correction, the Digital Elevation Model (DEM) of the SRTM (Shuttle Radar Topography Mission)fn was used. Figure 4d shows the rearrangement of the SAR image of the study área.
– RGB layer generation. An RGB mask of the SAR image was made to detect pixels where bodies of water, vegetation and flooded áreas occur. Figure 4e shows the result of the image with the RGB layer.
– Binary layer. To separate the water from what is not, a threshold was used. For this, the histogram of the filtered backscattering coefficient of the previously treated images was analyzed and the minimum backscattering values were extracted, since these correspond to the pixels with the presence of water.

Fig. 4 SAR image example. (a) no processing, (b) with radiometric processing, (c) with speckle filter, (d) with geometric correction, (e) with RGB layer, and (f) binary layer
Figure 4f shows the binary layer obtained from thresholding. Areas with shades of red indicate the presence of water while other deck objects are ignored. The purpose of this layer is to perform the training samples that will be used in the deep learning model. This is complemented by the 2020 flood map generated by SINAPROC.
3.2 Training
Training deep learning models requires the conversion of Geographic Information Systems (GIS) to a format that can be used to classify images. Creating good training examples is essential when training a deep learning model or any image classification model. To carry out the labels and training of the model, SAR images of the floods of the study área of the year 2020 were used.
3.2.1 Creation Training Samples
Images preprocessed with the binary layer were used to create training samples. Figure 5 shows some of the training samples captured in the SAR images.
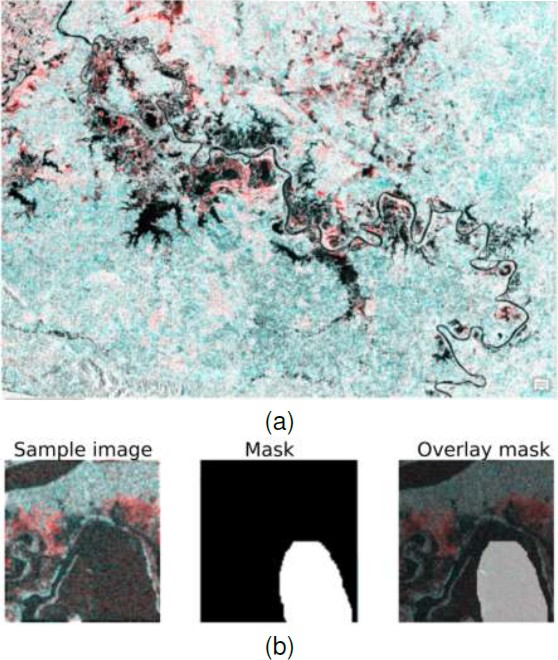
Fig. 5 Training samples: (a) image used for the creation of the training samples, (b) sample of one of the regions used as sample together with the generated mask
Once the training samples have been established, the data is exported to a format understandable by the model with the following parameters: 1) raster image, where the training samples were taken; 2) image size, with a value of 256 pixels; 3) offset distance for the next image, with value of 128 pixels; 4) metadata format, Classified Tiles type and 5) image format, TIFF type.
The output of this process are sets of small images of the sample sites (image chips), labels in XML format, metadata file, parameters and statistics of the captured samples.
3.2.2 Classification Model Training
This step was performed using the Train Deep Learning Model geoprocessing tool. This tool allows to generate a model based on deep learning using as input data the collection of samples (image chips and labels) that were captured in the training process.
CNN U-NET type were used, which despite being one of the simplest models, tend to offer more accurate or adjusted results than those offered by other models. To carry out the training of the model, a series of parameters were adjusted:
– Times. The maximum number of cycles or iterations back and forth of all training samples through the neural network. Different values were taken: 25, 50, 75 and 100 epochs.
– Processing batch size. Number of samples to be processed at the same time and depend on the hardware, number of processors or GPU available. A value of 8 was taken.
– Chip size. Value equal to the size of the images of the sample sites or image chips, this value corresponds to 256.
As a residual network or backbone, the ResNet-34 model was used [10].
The model is made up of a network of 34 pre-trained layers with over a million images from the ImageNet database. On the other hand, as recommended by [1], a value of 10% was established for the validation data, which specifies the number of training samples that are used to validate the model during the learning process.
Finally, it was established that the learning process does not stop even though the learning curve begins to flatten. The training was carried out with the U-NET model with SAR images. Table 1 shows the number of samples used by times implemented.
Table 1 Number of samples and times used in training the flood classification model
| # Epochs | # Samples |
| 25 | 256 |
| 50 | 566 |
| 75 | 716 |
| 100 | 1,036 |
The output produces a file containing information about the generated model with the following information:
– Learning rate. Magnitude of change or update of the model weights in the backpropagation of data by the neural network during the training process.
– Training and validation loss. Training and validation loss function, which indicates how well the model fits the training data and the validation data.
– Accuracy. The average accuracy score refers to the percentage of correct detections that the model made based on the results obtained with the internal validation samples.
4 Validation
4.1 Classification Model Training
It should be noted that the results are partial. For each epoch in the training of the classification model, its perfermance was obtained.
– Training algorithm parameters. To train the neural network, ArcGIS platform with PyTorch library was used. The ima size of the dataset used for train is 256 x 256 pixels. Table 1 shows images used for training by epochs. The model parameters were initialized with a standard normal distribution.
Parameters optimization was perfoermed using a bnary cross entropy function to compare. Parameter optimization was performed by cross entropy to compare the predicted values with actual ground values. Subsequently, the parameters were optimized using Adam method [34].
Tables 2 shows the results obtained from the neural model training. As can be seen, the best results were with 1036 chips and 100 epochs. The precisión was 93%, recall 92%, and F1 93%.
Table 2 Number of samples and epochs used in training the flood classification model
| Chips: 266. Epochs: 25 | |
| Evaluation | Class: Flood |
| Accuracy | 82% |
| Recall | 40% |
| F1 | 53% |
| Chips:566. Epochs: 50 | |
| Accuracy | 81% |
| Recall | 78% |
| F1 | 78% |
| Chips:716. Epochs: 75 | |
| Accuracy | 74% |
| Recall | 72% |
| F1 | 73% |
| Chips: 1036. Epochs: 100 | |
| Accuracy | 94% |
| Recall | 92% |
| F1 | 93% |
– Flood mapping. The floods detection using SAR images obtained good results. It is highly dependent on the increase in training data and epochs. However, it does better in detecting non-flooded áreas, this is due to the small dataset to train the deep learning model.
Figures 6 and 7 show the results obtained in the flooded áreas detection. The left image corresponds to the ground truth and the right to the prediction made by the model trained at 25, 50, 75 and 100 epochs.

Fig. 6 Result of the trained neural model. (a,b-left) shows the truth of the ground. (right) Corresponds to the prediction of the model with 25 (a) and 50 (b) epochs, respectively
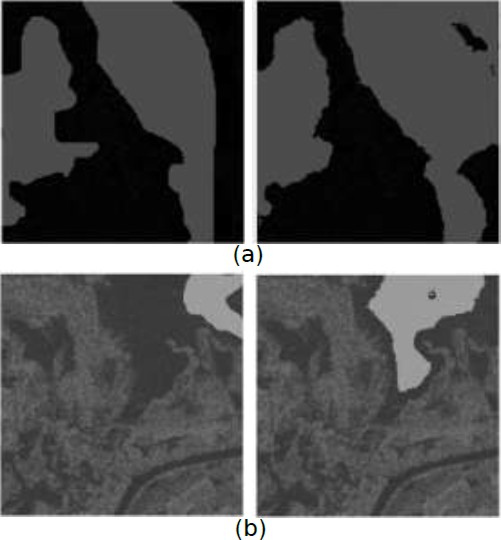
Fig. 7 Result of the trained neural model. (a,b-left) shows the truth of the ground. (right) Corresponds to the prediction of the model with 75 (a) and 100 (b) epochs, respectively
Figure 7(b) corresponds to 100 epochs and 1036 training samples. It can be seen that it obtains better results in flood detection. It should be noted that a larger data set is being developed for model. This with the aim of obtaining better results in flood detection. Figure 8 shows the values obtained from the trained model in relation to the amount data lost in validation and training.

5 Conclusions
The use of satellite data for flood detection is a task that requires understanding between the characteristics of a flood and the data obtained by the satellite. In this research it was found that the SAR images noise affects the performance in mapping floods.
Consequently, it requires image processing for noise correction. Likewise, the use of deep learning, for flood detection, can be considered efficient in terms of time, cost and performance. When satellite SAR data is available during and after floods this methodology can be very useful to provide rapid flood mapping results in emergency situations.
On the other hand, UNet-type networks proved to be efficient when working with SAR images and with a data minimum amount. The accuracy of our model went from 53% to 93% F1 score as training data and epochs increased; Therefore, it is assumed that the results are satisfactory given the amount of data with which the model was trained. Finally, it is proposed to create a more extensive data set in order to apply more complex neural networks for the detection of flooded áreas.

