


 text new page (beta)
 English (pdf)
 Article in xml format
 Article references
 Send this article by e-mail
 Cited by SciELO
  Similars in
SciELO
Similars in
SciELO 
 Permalink
INTRODUCTION
Biological systems deal with the understanding of biological processes at the systems level. The initial ideas were established by Dr. Norbert Wiener in his book published in the 1940s [1]. However, the execution and confirmation of these ideas did not flourish due to technological (low availability of sensors, actuators, and computer systems), and scientific limitations (for example, the theory of nonlinear systems was in its infancy). It was not until early in this century that these ideas were taken up by the scientific community encouraged, primarily, by advances in molecular biology. The current availability of high-performance computer systems capable of processing copious amounts of data and of information-processing methods like machine learning, as well as the development of sensors capable of measuring biological variables in real time, have all fostered advances in biological systems. In addition, modern systems theory provides a broad platform of methodologies for the analysis, mathematical modeling, and control synthesis of highly-complex processes, including linear, nonlinear, continuous, discontinuous, and interconnected behaviors, to name a few [2].
The study of biological systems proposes a four-part paradigm for understanding a biological process at the systems level [3]. (1) System structure: identifying the elements of a process that interact and modify its physical properties. (2) System dynamics: understanding under what conditions certain properties of the process change in time and the repercussions of those changes for the functioning of the process. (3) Control method: once the natural dynamics of the biological process are known, it may be interesting to modify specific properties so that, depending on its structure and dynamics, it may become possible to propose a method for the systematic manipulation of a property. (4) Design method: strategies for the physical implementation of the resulting control scheme according to the first three points. The advantage of this paradigm over the qualitative trial-and-error method used so widely in the biological sciences, is that it provides quantitative descriptions of the process that make it possible to predict the behavior of the properties of interest. Thus, it generates quantitative information, or design parameters, for experimental protocols that help optimize characterization methods and/or design and, more generally, our understanding of the biological process involved. Examples of applications of this paradigm can be consulted in the pioneering papers reported by Kitano [2] [3]. The area of biological systems devoted specifically to human health is called systems medicine, a field that studies physiological processes, pathological conditions, and recommended treatments with the goal of providing quantitative elements to optimize medical treatments [4].
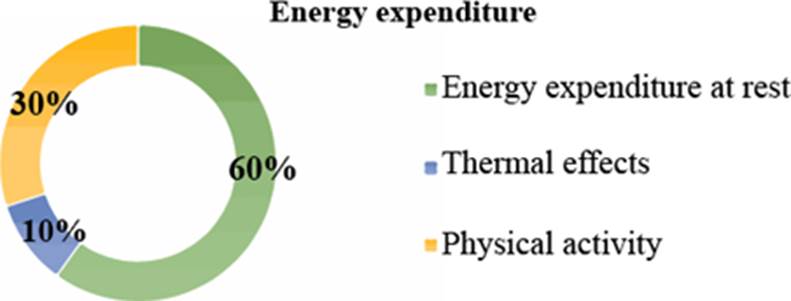
This article discusses a specific case of analysis of a biological process from the perspective of biological systems: energy consumption in a sarcomere, the basic functional unit of the contraction of skeletal muscle. The expenditure of energy is defined as the number of calories that people utilize to perform their basic vital functions, and to participate in physical activities [5]. Total energy expenditure depends on the total energy acquired from food. It is expended, approximately, in the percentages depicted in Figure 1[6].
Today, energy expenditure is measured by indirect calorimetry, a method that estimates the number of calories the human body consumes while performing a physical activity like walking or running by measuring oxygen consumption (VO2) and carbon dioxide production (VCO2). This allows researchers to calculate the total energy expenditure of an entire human body [6]. Regarding knowledge of the structure of the human body, biological systems conceptualizes this as a system of systems, that can be analyzed on different scales of organization: molecular, cellular, tissue, or organ and, finally, as an integrated organism [4]. Indirect calorimetry gathers data on energy consumption at the level of the organism; that is, the highest level of analysis of the structure of a biological process, but in certain cases it may be important to determine the functioning of this process on another scale. For this reason, this article focuses on the question of the amount of energy consumed by a sarcomere during muscular contraction. To this end, we proposed a methodology of analysis centered on the structure and function of the process at the cellular level. The approach consist of a mathematical model of the contraction cycle of a sarcomere of skeletal muscle, which represents the dynamic behavior of the troponin units during the contraction cycle. Such dynamics determines the force generated and the velocity of the sarcomere, which are the elements to quantify the energy consumed by the sarcomere during contraction. Moreover, an activation scheme is presented in this paper, to model the voluntary activation of contraction cycle after the arrival of an action potential to the neuromuscular junction. The content of this article is as follows. The next section describes the physiological principles that lead a sarcomere to contract, a physiological function that provides muscular force and the energy required to generate such force. The section that follows outlines the methodology of mathematical modeling used to calculate the energy that a sarcomere requires to execute the contraction, and the conditions of the numerical implementation of the model utilized. The final part presents the results, discussion, and conclusions of the study.
MATERIALS AND METHODS
Muscular contraction
A skeletal muscle is a tissue that specializes in producing contractions. It is made up of cells called muscle fibers that have the capacity to contract individually. It is the synchronized contraction of the muscle fibers of a skeletal muscle that generates the force required to produce movement of the articulations to which it is joined. The movement produced by the skeletal muscle system is voluntary and results from the contraction and relaxation of these cells. To achieve movement, the muscle performs a series of functions that include generating force, transmitting the force, consuming, and storing energy, and producing heat.
During embryonic development, a series of myoblasts fuse to form a muscle fiber, so each fiber is a cell with multiple nuclei. The sarcolemma is cell membrane of the muscle fiber and the cytoplasm is known as the sarcoplasm. The organelles that provide muscle fibers with their contractile structure are called myofibrils. They are made of proteins that extend over the entire length of the muscle fiber. Myofibrils are formed by two elements denominated thick and thin filaments, which are organized in compartments called sarcomeres. Because contraction occurs in the sarcomeres, they are known as the basic functional units of the myofibrils [7]. Figure 2 illustrates the organization of a skeletal muscle, from the complete muscle down to the sarcomere.

Three types of proteins define the structure and function of the sarcomere: (1) Contractile proteins are responsible for generating force during contraction. (2) Regulator proteins are in charge of activating and deactivating the contraction process. (3) Structural proteins form the thick and thin filaments that give the myofibrils their elasticity, extensibility, and ability to bond to the sarcolemma. The structure of the sarcomere is shown in Figure 3. The thin filaments (yellow) are composed mainly of a contractile protein called actin, while the thick filament (red) is formed by the contractile protein myosin. When a muscle is relaxed, the thick and thin filaments are superimposed in an area of the sarcomere called band A. The central part of band A contains the line M, formed by myomesin, a structural protein [7]. The regulator proteins, troponin and tropomyosin, form part of the thin filament, together they make up the troponin-tropomyosin complex. The structure of the sarcomere allows it to contract; that is, to shorten itself by overlapping the thick and thin filaments by through the transformation of energy, from chemical into mechanical [5] [6]. The contractile cycle is activated when an action potential reaches the neuromuscular union and depolarizes the sarcolemma of the muscle fiber, releasing calcium (Ca2+) into the sarcoplasm. Ca2+ prepares the thin filament so that the thick filament can bond to it through the association of actin proteins with the heads of the myosin. Actin occupies a site related to myosin that is protected by tropomyosin during relaxation. When Ca2+ is available in the sarcoplasm, it associates with troponin such that the tropomyosin exposes the sites of the myosin-related actin sites to allow the heads of myosin to bond to that protein. These unions are called crossbridges. The troponin-tropomyosin complex is recognized as the regulator proteins of muscular contraction due to its function of preparing the thin filament to associate with the thick filament [7].
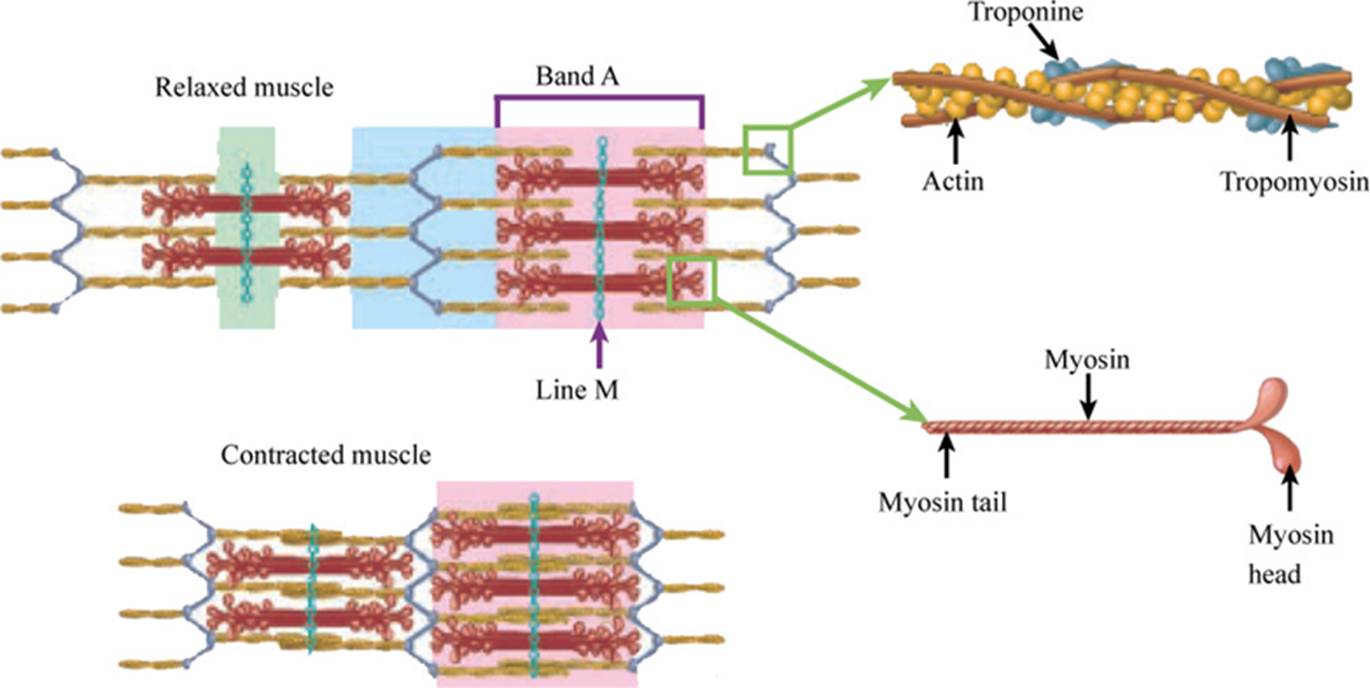
Figure 3 Thick and thin filaments in relaxation and contraction. Figure edited from Tortora et al.[7].
The contractile cycle refers to the sequence of events that takes place during the movement of the filaments. It consists of four stages (see Figure 4. In the first stage (1), myosin becomes charged with energy through the hydrolysis of adenosine triphosphate (ATP) molecules in its head. In this stage, the heads of the myosin are oriented towards the thin filaments. In the second stage (2), the energy-charged myosins adhere to the actin in the thin filaments to form crossbridges. In the third (3), the thick filament generates the traction necessary to move the thin filaments towards the line M, causing them to overlap and produce force in the sarcomere. When this movement concludes, in stage four (4), the myosin u ncouples from the actin, ending the cycle. The contractile cycle is repeated as long as ATP molecules are available and the concentration of Ca2+ in the sarcoplasm remains high. The shortening of the sarcomeres in the myofibrils causes the muscle fiber -and then the complete muscle- to contract [7].
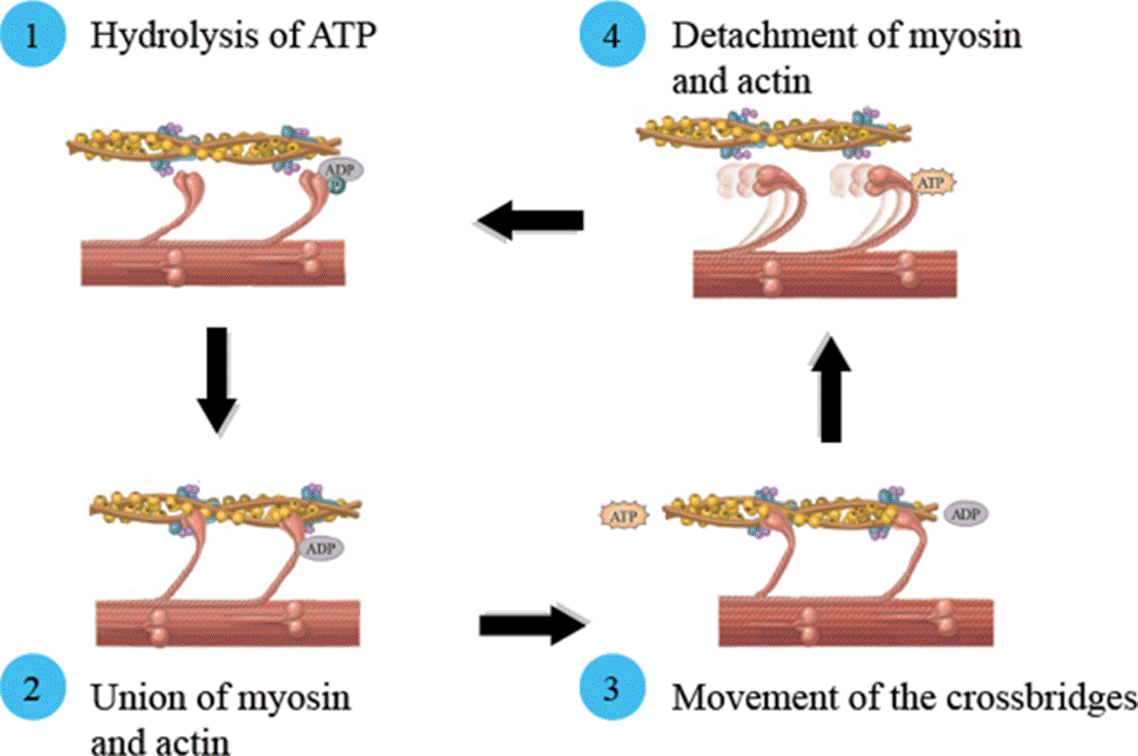
Figure 4 Stages of the contractile cycle: (1) hydrolysis of ATP, (2) formation of crossbridges, (3) movement phase, and (4) detachment of myosin and actin. Figure edited from Tortora et al. [7].
Muscular contractions are classified as either isotonic or isometric. In the former, the force of contraction developed by the muscle is constant, and the length of the muscle changes. This type of contraction generates movement of the joints and the force required to move loads or objects. In the latter, the force of contraction is insufficient to move a load or object; it only generates sufficient force to sustain it, not move it. In this type of contraction, the muscle does not change its size [7]. Next, the mathematical modeling of muscular contraction is revised.
Mathematical model of contraction
Most of the mathematical models proposed in the literature to emulate the mechanical behavior of skeletal muscles are based on the one posited by Hill et al. [8]; that is, addressing the mechanical response of muscle at the tissue level [9] [10]. Mathematical modeling of the mechanical response of the muscle, in contrast, is based on the physiological principles of the origin of muscular contraction in the sarcomere of the skeletal muscle. This physiological approach has been used in mathematical modeling of cardiac muscle; the approaches ranges from initial models proposing the mechanical response of a single sarcomere of cardiac muscle [11], multi-scale mathematical modeling of the heart mechanics [12] [13] to current in silico models used in preclinical trials to assess drugs for cardiac diseases [14]. While our approach sets out from current physiological models of the sarcomere of cardiac muscle, it proposes an adaptation to represent the contractile response of the sarcomere of skeletal muscle. The main function of both types of tissue is to generate muscular contraction, but their activation mechanisms differ: the heart muscle is activated involuntarily, while activation of skeletal muscle is voluntary, triggered by the emission of an action potential from the motor cortex to the neuromuscular union. This permits control of the onset of the contractile cycle through the release of Ca2+ into the sarcoplasm. The model proposed herein includes the effect of the voluntary activation of muscular contraction through the signal generated in the neuromuscular union while also quantifying the energy consumption that this process requires.
Landesberg et al. proposed a physiological model of the contraction of the sarcomere based on an analysis of the dynamics of the regulator protein troponin during the contractile cycle [11]. They called the relaxation stage the phase of ATP hydrolysis. Here, the sarcomere is relaxed, the crossbridges are in a weak conformation (not force-generating), and Ca2+ is not bonded to troponin. They defined the parameter R (in μM) as the number of units of troponin available in this stage. The bonding of Ca2+ to troponin defines the activation stage, when the crossbridges prepare to generate force. The variable that measures the number of troponin units associated with Ca2+ is A(t) (in μM). The time variation of A is defined by the next differential equation:
where the left-side of the Equation (1) stands for the accumulation of A (number of troponin units per unit of time), and the right side stands that such accumulation is directly proportional to Ca2+ concentration in sarcoplasm and the number of troponin units available in the relaxation stage. The rate of association of troponin units with Ca2+ is represented by k L (in μM-1s-1). Accumulation of A could decrease by the disposition of troponin units, the rate of Ca2+ dissociation (k -l in s-1), and the transition rate of the crossbridges between conformations (f in s-1). f is defined by f=f0-f1V(t), where f0 (in s-1) is the transition rate in isometric state, and f1 (in μm-1) is the rate of dependence on the velocity of the shortening of the sarcomere (V(t) in μm/s). Accumulation of A are also promoted by the number of troponin units defining the strong crossbridges T(t) (in μM). This relation is proportional to the transition rate of the crossbridges from strong to weak conformation (g in s-1), defined as g=g0 +g1V(t), where g0 (in s-1) is the rate of the weakening of the crossbridges during isometric contraction, and g1 (in μm-1) defines the velocity on the rate of the crossbridges in the weak conformation.
The traction of the thick filaments over the thin filaments through the available crossbridges results in the movement of the latter, generating force in the sarcomere. This is the stage where the crossbridges change from their weak (not force-generating) to strong (force-generating) conformation. The accumulation of troponin units in this stage is defined by the next differential equation:
Such accumulation is directly proportional the number of troponin units associated to Ca 2+ at the transition rate of the crossbridges between conformations. The accumulation of T can be decreased by the number of troponin units in this stage at the rate defined by the addition of the transition rate of the crossbridges from strong to weak conformation and the rate of Ca2+ dissociation. Nevertheless, accumulation of T is also promote by the number of troponin units that regulate crossbridges still in the stage of strong conformation, but in which the Ca2+ has not been disassociated, defined by U(t) (in μM). This last promotion is proportional to the Ca2+ concentration and the rate of association of troponin units with Ca2+. Regarding the accumulation of U, it is defined by the next differential equation:
This equation represents the time variation of U, in which the accumulation is defined by a function directly proportional to the units of troponin in the strong crossbridges and the rate of Ca2+ dissociation. The accumulation of U can be decreased by the unit U available in this stage at a rate defined by the addition of the association rate of troponin units with Ca2+ and the transition rate of the crossbridges from strong to weak conformation.
Finally, the dynamical behavior of the troponin units in all stages of the contractile cycle is determined by the concentration of Ca2+ in the sarcoplasm, which accumulation is defined as:
where Iin e Iout (both in μMs-1) are the flow currents of Ca2+ through the sarcoplasm and the sarcoplasmic reticulum, activated by the depolarization of the sarcolemma when an action potential reaches the neuromuscular union. Tro (in μM) represents the number of troponin molecules present in the entire contractile cycle: Tro=R(t)+A(t)+ T(t)+U(t). Equations (1)-(4) define the mathematical model of the contraction of a sarcomere [11]. In the next subsection, the equations to compute the force generated by the sarcomere are presented. Force is related to the velocity of the shortening of the sarcomere, V(t), as well as the troponin units T and U defined in Equation (2) and (3).
Force-velocity relation
Setting out from the assumption that each crossbridge is a pseudoviscous Newtonian element, the force generated by the sarcomere is defined as (Assumption 5 in Landesberg et al. [15]):
where Ls (in μM) is the length of the overlap between the thin and thick filaments, (T+U) is the total number of crossbridges in the strong conformation, and
and Vu (in μm/s) is the maximum velocity of the shortening of the sarcomere [16].
The sarcomere at rest constitutes the stationary state of the system of differential Equations (1)-(4), so A*, T*, U* and Ca2+* are the values of the equilibrium point -or stationary state- that satisfy the system of algebraic equations which emerges upon setting the derivatives of the system (1)-(4) to zero; that is:
Calculating the force-velocity ratio requires Equation (5) and the substitution of T* and U* from the system defined by Equations (1)-(4). This produces the following equation:
Landesberg et al. [17] accommodated the terms such that Equation (11) is expressed in the form of Hill’s force-velocity ratio equation [18], where Fh is the force in the stationary state:
and Fm is the force generated by the muscle during isometric contraction:
with Tro*=R+A*+T*+U*, kl =kLCa2+*, where ah and bh are Hill’s parameters, defined as follows:
and
Upon initiating a movement, the muscle passes from the relaxed to the contracted state, where the muscle fibers change their length by contracting, thus producing movement (isotonic contraction).
The velocity generated by the sarcomere in the isotonic state is given by the expression [17]:
where Vh is the velocity in the stationary state, defined as:
V0 =V(0) (in μm/s) is the initial condition (in t=0) of the velocity of the shortening of the sarcomere. Upon integrating Equation (16), we obtain the change in the length of the shortening of the sarcomere, given by the expression [17]:
This equation makes it possible to obtain the length of a sarcomere (SL) at a certain time as: SL(t)= SL(0)+L(t), where SL(0) is the initial length of the sarcomere. In addition, the length of the overlap required to calculate the force generated by the sarcomere, defined in Equation (5), is obtained from the length of the sarcomere, given by the following ratio [19]:
where Lφ is the length of the filaments of actin and myosin in a simple overlap during contraction. Likewise, the force generated by the sarcomere due to isotonic contraction at a certain moment (also called transitory force) is given by the expression [17]:
where F0 =F(0) is the initial condition (at t=0) of the force generated by the sarcomere.
Energy consumed
As mentioned in the description mathematical model of contraction of a sarcomere defined by Equations (1)-(4), the number of crossbridges that pass from the weak to the strong conformation is represented by the variable A(t); that is, the troponin molecule linked to Ca2+ (t) each one of which corresponds to a crossbridge.
The crossbridges in the strong (force-generating) conformation are represented by the variable T(t). Each crossbridge in the strong conformation requires a unit of ATP hydrolysis and the release of phosphate, in order to pass from the weak to the strong conformation [20] [21]. Hence, the rate of energy consumption
where EATP is the free energy released from the hydrolysis of a simple ATP molecule, given by [15]
where ρ= 1/g1.
Model of Ca 2+release
Finally, we propose an adaptation of the contraction model defined by Landesberg et al. and represented by Equations (1)-(4)[11]. As it was mentioned before, the model proposed by Landesberg reproduces the dynamics of contraction of a sarcomere of cardiac muscle; although both cardiac and skeletal produce contraction, their activation mechanisms are different. In the cardiac muscle, the contraction is carried out automatically as long as there is Ca2+ in the sarcoplasm; this is, there exist a constant influx of Ca2+ currents, then the term (Iin -Iout) in Equation (4) is constant. The activation mechanism changes in skeletal muscle, where the contraction is activated when an action potential pulse arrives at the neuromuscular junction and this generates a variation of Ca2+ currents, that is, the term (Iin -Iout) in Equation (4) is a time-varying function depending on the action potential. For this reason, to reproduce the contraction in a sarcomere of skeletal muscle, the force that it generates and, finally, the energy that it consumes during contraction, it is necessary to have a mathematical model to emulate the dynamic response of Ca2+ currents (Iin -Iout) caused by the depolarization of the sarcolemma in response to the arrival of the action potential (AP) at the neuromuscular junction, and then producing voluntary contraction of skeletal muscle.
For this end, we propose an activation scheme based on a mathematical model to reproduce the input-output response of the dynamics of calcium release in the sarcoplasm. Figure 5 shows this proposal in which the objective is to have a dynamic model based on a transfer function, called model of Ca2+ release, whose output is the calcium currents through the membrane, this term (Iin -Iout).
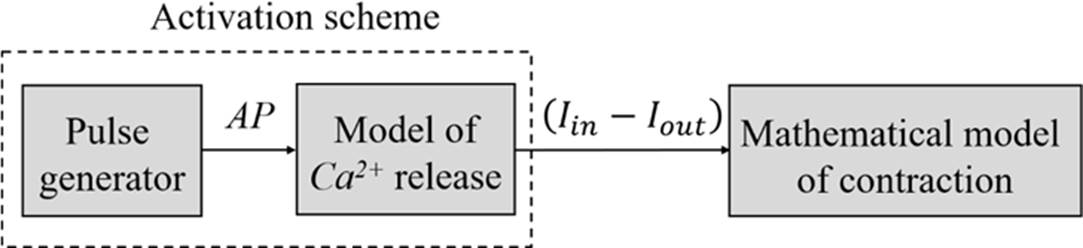
Figure 5 Activation scheme of the mathematical model of contraction of a sarcomere of skeletal muscle. The scheme is based on a transfer function with input data form a train of pulses (AP), the output data correspond to the total Ca2+ current (Iin-Iout) reported by Beuckelmann et al. [22].
In turn, this term is the one that initiates the contraction cycle defined by the model defined in Equations (1)-(4) represented by the right block of Figure 5 (mathematical model of contraction). The input of the model of Ca2+ release is a pulse generator emulating the AP, illustrated by the left block of Figure 5. Thus, the problem is to compute an input-output model of Ca2+ release based on available data of AP and (Iin -Iout).
The input data of the model of Ca2+ release is represented by a train of pulses that emulates the AP which reaches the neuromuscular junction. Regarding output data, existing literature has no separate measurements of the currents of Ca2+ entering (Iin) or leaving (Iout) the sarcoplasm, but experimental studies have measured the total influx of Ca2+ current, that is (Iin -Iout). Thus, the output data used to compute the model of Ca2+ release are experimental measurements of the total Ca2+ current (Iin -Iout) reported by Beuckelmann et al. [22].
RESULTS AND DISCUSSION
To devise the model that reproduces the dynamics of total Ca2+ current in the sarcoplasm, the diagram in Figure 5 posits a problem of system identification. To resolve it, we set out from the disposition of input and output data from the process analyzed. Thus, we propose that the input data take the form of a train of pulses of unitary amplitude with a work cycle of 0.5, to emulate the wave form of the AP that reaches the terminal of the neuromuscular union. The output data (Iin -Iout) are taken from Beuckelmann et al. (see Figure 5 in [22]). Based on a set of points in the referenced figure, we obtained a sufficient series of data (1000 samples) by adjusting a polynomic curve using MATLAB’s® polyfit library. Based on observations of the input and output data, we propose that the mathematical model take the form of a transference function. To define the order of the polynomials of the function, and their parameters, we employed MATLAB’s® ident systems identification tool, which resulted in a second-order transference function that defines the dynamics of the total Ca2+ current in the sarcoplasm after the arrival of the stimulus of the action potential at the neuromuscular union:
The percentage of fit between the proposed model and the experimental data was 84%. Using Equation (23) we can calculate (Iin -Iout) and substitute it in Equation (4) of the mathematical model of contraction to obtain the elements required to numerically simulate the dynamics of contraction of the sarcomere defined by the sys tem of Equations (1)-(4). The numerical solution was elaborated using MATLAB® and Simulink®. Initial conditions were: A(0)=0, T(0)=0, U(0)=0 and Ca2+(0)=0. The numerical method applied to solve the differential equations was the Runge-Kutta approach, available in MATLAB’s® ode45 library. The solution interval was 0-3 seconds, and the integration step was 0.0001 s. The nominal parameters used to solve the system of the dynamics of muscular contraction, to calculate the force-velocity relation, and to obtain the energy consumed during contraction, are summarized in Table 1.
Table 1 Values of the nominal parameters used in the numerical simulations.
| Parameter | Value | Reference |
| Dynamics of contraction of the sarcomere | ||
| kL | 200 µM-1s-1 | [15] |
| k-l | 20 s-1 | [19] |
| f0 | 50 s-1 | [15] |
| f1 | 2.5 µM-1s-1 | [15] |
| g0 | 10 s-1 | [15] |
| g1 | 35 µM-1s-1 | [15] |
| Force-velocity radio | ||
|
|
2 pN | [23] |
| η | 0.28 pNs/µm | [17] |
| Tro | 53 mM | [15] |
| Vu | 7 µm/s | [19] |
| V0 | 0 µm/s | [19] |
| SL(0) | 2.2 µm | [15] |
| Lφ | 0.8 µm | [19] |
| Energy consumed | ||
| EATP | 1.92 mM | [17] |
Figure 6 presents the results of the current of Ca2+ in the sarcoplasm in response to three nervous impulses that reached the neuromuscular junction. These results are considered reliable for simulating the input of Ca2+ (t) to the model (1)-(4) since the basal Ca2+ concentration in the cells is approximately 0.1 μM [20].
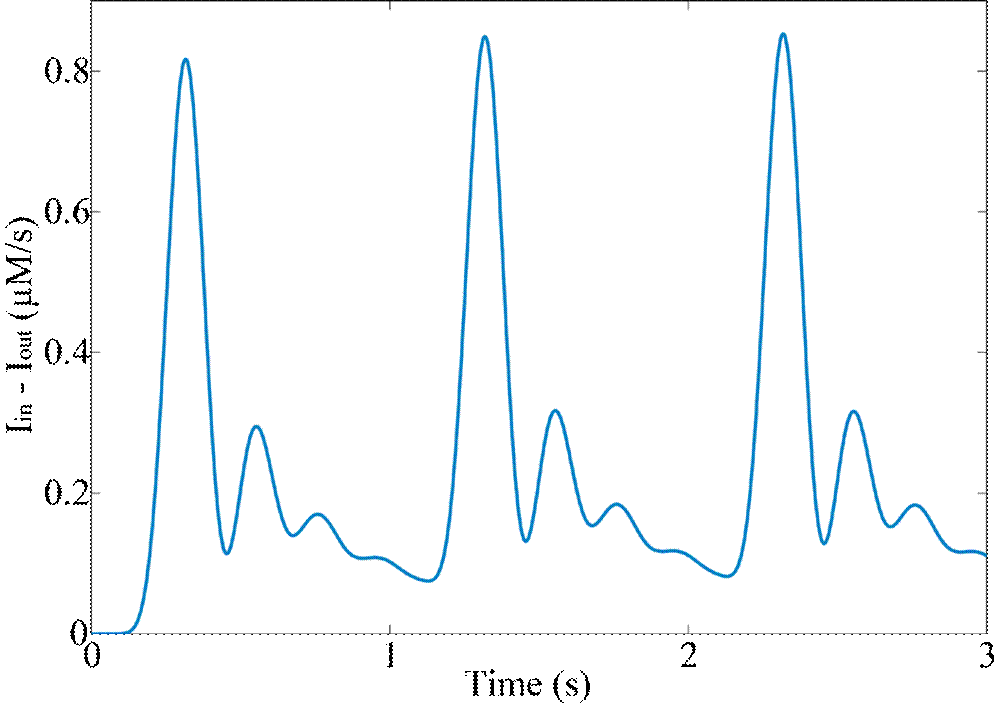
Figure 6 Currents of Ca2+ in the sarcoplasm (Iin-Iout) when three impulses of AP are generated in the activation scheme of Figure 5 considering the model of Ca2+ release in Equation (23).
Figure 7 shows the solution of the dynamic model of muscular contraction of the system of Equations (1)-(4) using the Ca2+ current (Iin -Iout) obtained from Equation (23).
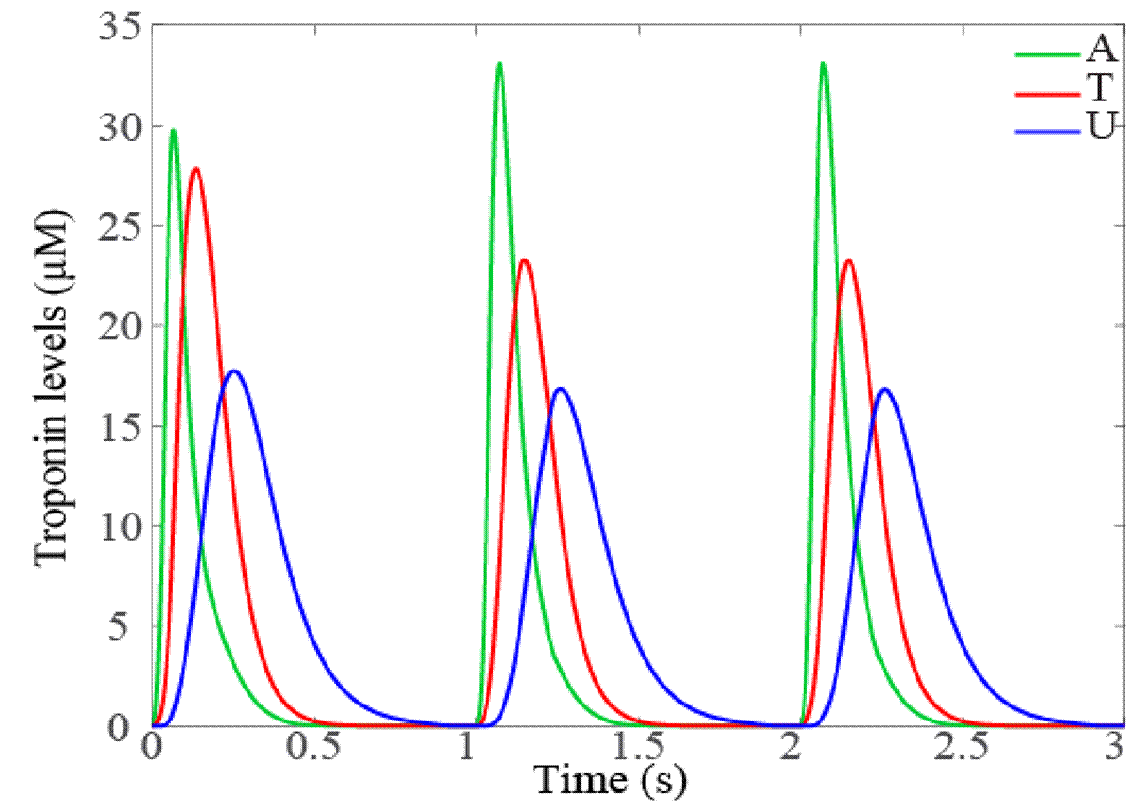
Figure 7 Numerical solution of the mathematical model of troponin units in the activation stage of the crossbridges of the contraction cycle. A(t) and T(t) are the troponin units during the strong conformation of crossbridges; U(t) are the troponin units in the strong conformation of crossbridges without associated Ca2+.
Figure 8 presents the force generated by the sarco mere during a 3-second period, determined by Equation (20).
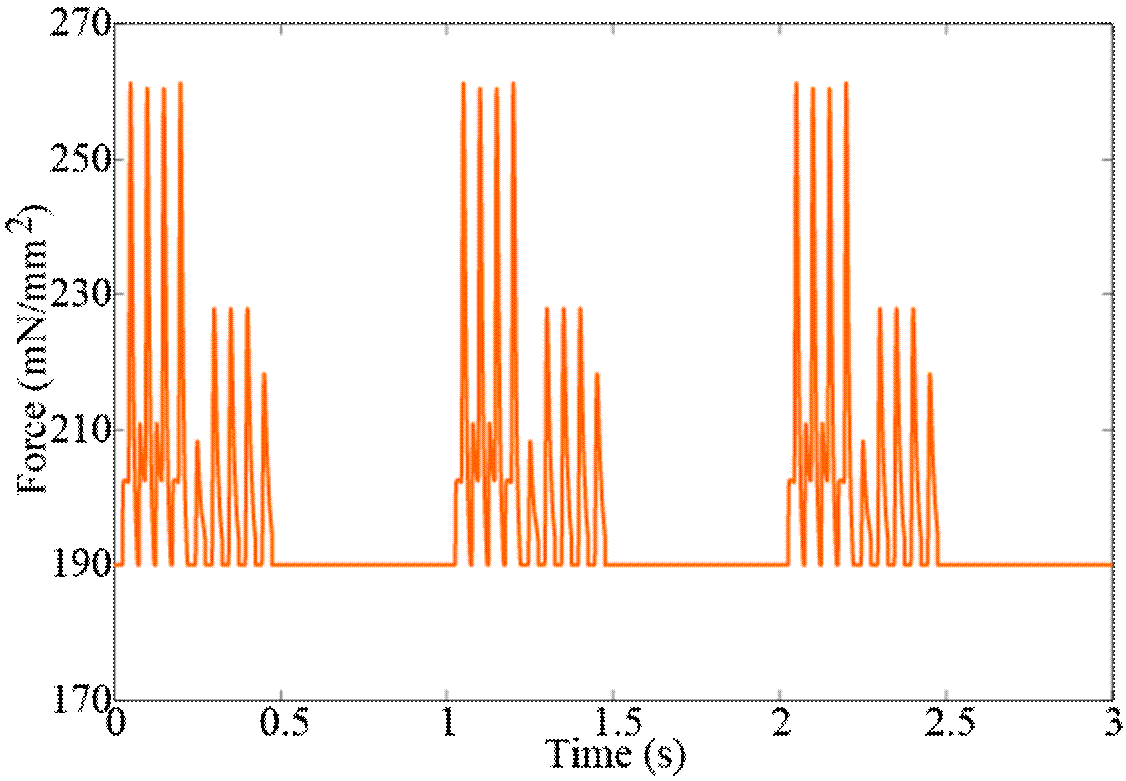
Figure 8 Force generated by the sarcomere of skeletal muscle during activation of three action potentials.
Figure 8 shows that when Ca2+ levels are high (see Figure 6, the force is greater and remains constant during the 0.5-second period in which Ca2+ is 0.1 μM. Likewise, the variables A(t), T(t) and U(t) tend to return to their initial values in that period, as Figure 7 shows. Figure 9 indicates the shortening velocity obtained from the simulation of Equation (16).
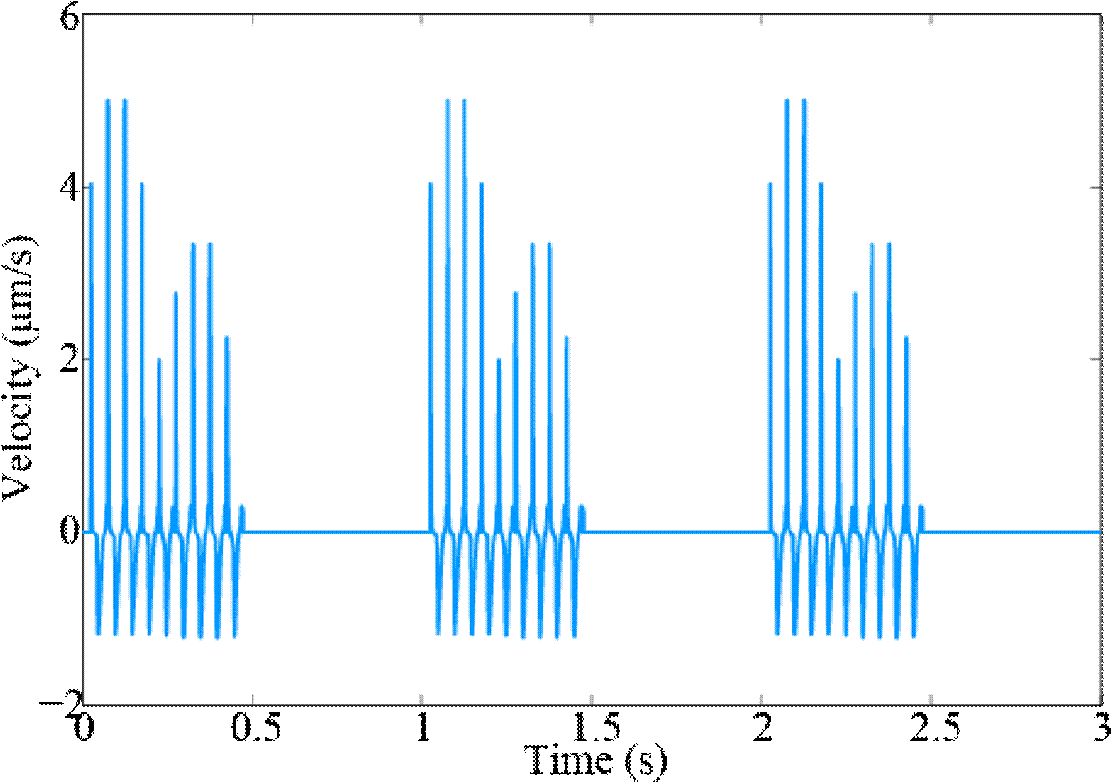
Figure 9 Shortening velocity of the sarcomere of skeletal muscle calculated by Equation (7) and considering three action potentials for the activation of muscular contraction.
Figure 10 displays the variation in the length of the sarcomere during each contraction. Shortening de- pends on the input of Ca2+, since the greater the concentration of Ca2+ the greater the shortening in the overlap region. During the period from 0.5-1 s, no shor- tening is produced, and the sarcomere remains in its resting position because during that period Ca2+ is at its basal value.

Figure 11 shows the force-length ratio of the shortening of the sarcomere; that is, the muscle’s capacity to generate force regardless of the degree of shortening [24] [25]. The amount of tension generated by the muscle depends on how much it can contract or shorten during stimulation.
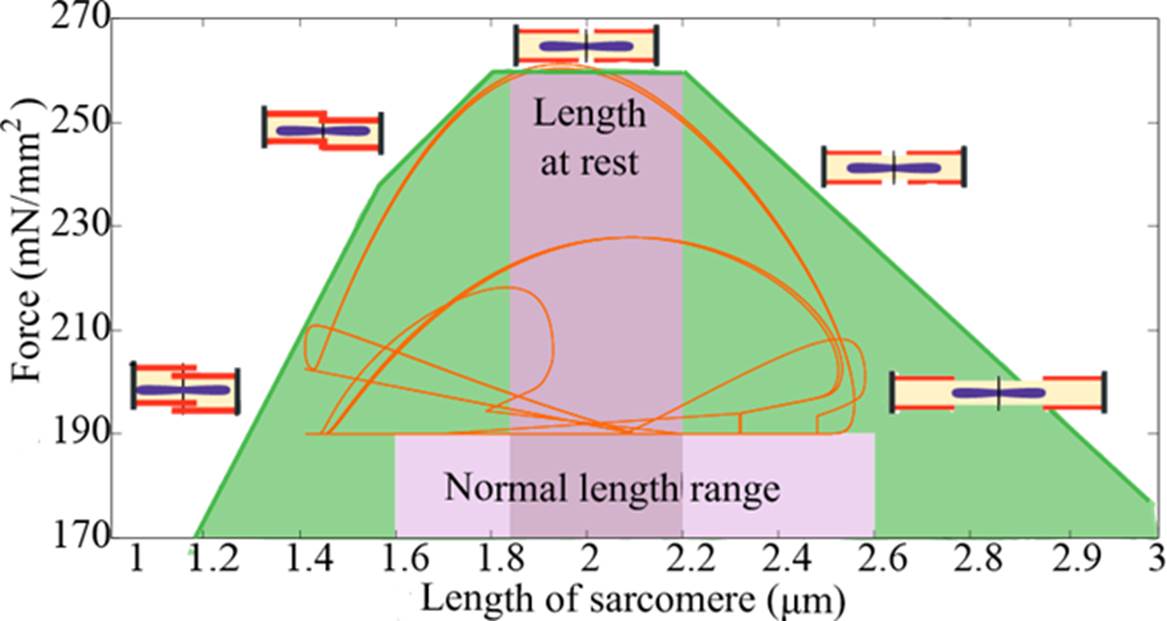
The orange line represents the result of the simula tion by Equations (17) and (18). Figure 11 compares the results to the simulation reported in Tortora et al. [7], who proposed only minimum and maximum values of the force generated by the sarcomere (image in green). A sarcomere in a relaxed state measures 2-2.2 μm. Figure 11 shows that the maximum force occurs when the sarcomere returns to its normal position (at rest). The normal length range of the sarcomere during the contractile cycle runs from 1.6-2.6 μm. Figure 11 also reveals that the force which decreases the length of the sarcomere is outside the normal range; that is, the length exceeds the value at rest (eccentric contraction), as occurs in extreme contractions.
Figure 12 presents the force-velocity ratio. Clearly, during the velocity of shortening (V(t)>0) -that is, contraction- the force tends to remain at its initial or minimum value, before increasing during relaxation.
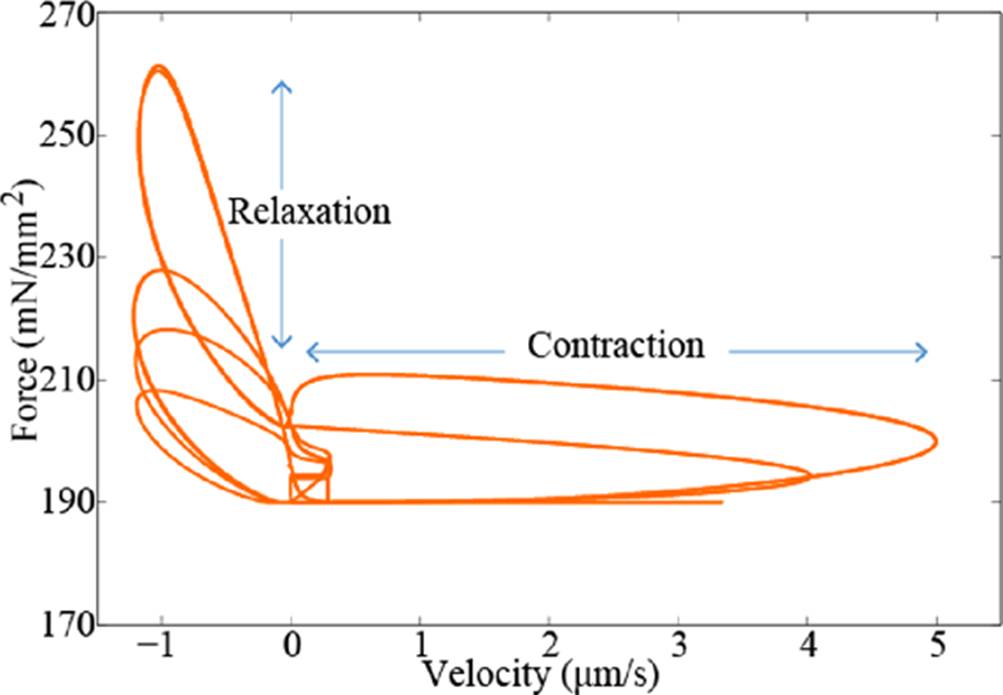
Figure 12 Force-velocity ratio of the sarcomere of skeletal muscle. The orange line represents the force generated during contraction, in terms of the velocity of the shortening of the sarcomere.
This is because the force is generated in the stage of the change from the strong to weak conformation of the crossbridges when the union and separation of the molecules of myosin and actin is strong. This coincides with the force-shortening ratio.
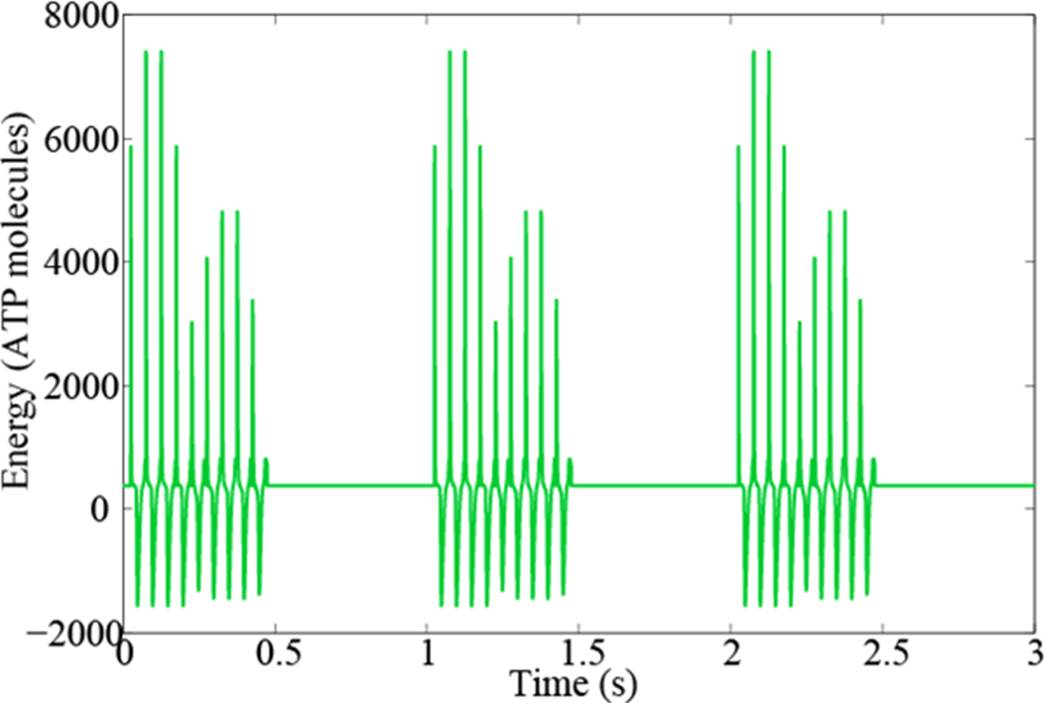
Finally, the energy consumed by the sarcomere can be seen in Figure 13. The negative results are due to the sign of the velocity of shortening. Here, after 0.5 s, the rate of consumption is small and does not vary, since in this period the Ca2+ remains in its basal state, and there is no contraction.
CONCLUSIONS
The study of the mechanical properties of the sarcomere of skeletal muscle based on the biological systems paradigm is interesting for characterizing and quantifying the dynamic behavior of muscle cells.
Moreover, the ratio between the mechanical response and the energy consumed by the sarcomere can provide valuable information on the efficient use of energy in cells. The results obtained from the numerical simulations of force are considered acceptable since they coincide with the maximum and minimum ranges of force generated by a sarcomere, according to experimental values reported in the literature [26] [27]. The availability of experimental data on the maximum and minimum force that the sarcomere can perform is a disadvantage for the validation of the dynamic response of the proposed model.
Therefore, to overcome this disadvantage, experimental studies at sarcomere level must be carried out to account with data to validate the dynamical behavior of force generated by the sarcomere. The findings on the length of the sarcomere during the contractile cycle are also deemed acceptable. Experimental reports indicate that the length of a sarcomere at rest phase is 2-4 μm, but when this exceeds the normal state of relaxation, during an extreme contraction, length may decrease to just 1 μm [7].
Figures 6, 7 and 8 show that when the levels of Ca2+ input are high, the force generated is greater, but that when Ca2+ is at its basal value, the force remains at its minimum value. Once the model of energy consumption at the level of sarcomere is fully resolved, future work will focus on modeling the coupling rules between sarcomeres that allows the mechanical response of a complete muscle fiber, and on proposing rules for the recruitment of fibers to model the mechanical response and energy consumption of a complete muscle. The challenge seems achievable, since currently studies have been reported addressing this problem of inter-scale modeling, for example, the one reported by Marcucci et al. [28], where they propose a scaling from muscle fiber to full muscle just considering the mechanical response, without considering energy consumption.
The significance of solving the mathematical modeling of energy consumption by skeletal muscle would be to have quantitative methods, rather than indirect estimations, of a person's energy consumption. This could be of relevant importance in pathologies related to energy management in the human body, from overweight, obesity, metabolic syndrome and diabetes. In addition to the representation in mathematical models of energy consumption, it would allow the design of patient-oriented energy consumption optimization schemes that could be useful, for example, for high-performance athletes.

