


 text new page (beta)
 English (pdf)
 Article in xml format
 Article references
 Send this article by e-mail
 Cited by SciELO
  Similars in
SciELO
Similars in
SciELO 
 Permalink
INTRODUCTION
The concern of agroindustry must be the conservation and transformation of raw materials, as well as the extraction, enrichment and concentration of the components that give value to them. Agro-industrial activity is closely related to urban development and the environment.
Basanta et al. (2007) pointed out that at global level, environmental issues of the greatest concern like the degradation and alteration of the environment by agroindustrial residues such as liquids and solids, which contribute to water pollution both in surface and ground water, are of public concern.
In this sense, agriculture is intricately enmeshed in the environmental issue due to the processes required for transforming raw material. Among them, sugar mills emit ash into the atmosphere consisting of a high volume of particulate matter together with a high concentration of heavy metals such as cadmium (Cd), copper (Cu), lead (Pb) and zinc (Zn). High concentrations of heavy metals converge in exposed areas, such as dwellings, material goods and, especially, agroecosystems. In addition, nearby areas become very vulnerable to these concentrations because of their non-biodegradable nature; also, the negative effects they exert on different crops and their bioavailability may be hazardous to environmental and human health (Prieto et al. 2009).
The sugarcane industry is of great importance from the social, cultural, political and economic viewpoints, since it is a very important source of jobs. This agroindustry generates around two million direct and indirect jobs, with prevalence in most tropical and subtropical areas (SE 2012). This leads to severe pollution problems due to the increase in the volume of industrial, agricultural and domestic particulate matter produced by sugarcane activity, which adversely affects the health of the environment (Basanta et al. 2007).
Determining the concentration of heavy metals present in the volatile particles emitted by the La Gloria mill not only serves to assess their toxicological potential and implications for the environment, but also contributes to the development of strategies to reduce and mitigate environmental pollution (Rovira et al. 2010). Therefore, the aim of this research was to determine the concentrations and spatial distribution of the heavy metals Cd, Cu, Pb and Zn present in particulate matter emitted by the La Gloria sugar mill and sugarcane burning in regional agroecosystems, as a function of the distance at which such material was deposited during the emission process.
MATERIALS AND METHODS
Selection of the study area
This study was carried out from December 2015 to April 2016 in the supply and housing areas of the La Gloria mill, Veracruz. These areas are geographically located between 19º 29’-19º 23’ N, and 96º 21’-96º 31’ W in the central coastal plain region of the state of Veracruz, Mexico, where the average wind speed is 43 km/h. In the studied area there are some rural communities close to La Gloria mill, along with the rural community called La Gloria, which is practically adjacent to it.
The predominant climate is Aw1, being warm subhumid with a mean annual temperature greater than 22 ºC and a coldest month temperature greater than 18 ºC. The precipitation of the driest month is less than 60 mm; the summer rainfall occurs with precipitation/temperature index between 43.2 and 55.3; the annual precipitation is around 1400 mm according to the Köppen climate classification (García 2004). There are three clearly distinguished seasons throughout the year: drought, rainy and with strong northerly winds.
Collection of particulate matter samples
This activity was carried out during and after the sugarcane harvesting, because in this time the sugarcane mill was operating day and night. This gave rise to the particulate matter (ashes) emission from La Gloria mill. Sometime after this process was completely established, the sample collection started in each selected site.
Two studied areas, zone A and zone B, were selected for the collection of the particulate matter samples, with a total amount, for both zones, of 51 sampling sites, being zone A the closest to the La Gloria mill (Fig. 1). During the operation of La Gloria mill, 50 samples were collected for each site, each one consisting of 20 g/d. After each sampling, all particulate matter samples were taken to the laboratory, until the 50 samples for every site on zones A and B were collected. Subsequently, all particulate matter accumulated during the sampling was carefully mixed up, from which a composed sample of 500 g was obtained and then sieved with 250 μm (No. 60) mesh for the removal of undesirable material. The resulting samples were taken to the laboratory for further analyses. The collection of particulate matter samples in all the 51 sampling sites of zones A and B was done in relatively small cylindrical containers with the following dimensions: 40 cm of base diameter and 15 cm of height. These sampling containers were placed 30 cm above the soil surface to reduce, as much as possible, the entrance of any particles that could contaminate the particulate matter samples gradually entering into the referred containers. From each sieved sample, 50 g were taken and packaged in a previously labeled 16.5 × 14.9 cm Ziploc bag. These bags were stored in closed desiccators to avoid moisture absorption from the environment and remained there until their analysis in the laboratory (Fig. 2). These analyses were performed using the atomic absorption spectrophotometry technique.
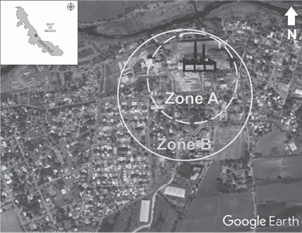
Fig. 1 Distribution and location of zones A and B where the ash collection sites were distributed in the study area (self-elaboration with information provided by Google Earth)

Samples homogenization
Each sieved and homogenized 50-g sample was taken and deposited in a 1-L Imhoff cone containing 500 mL of distilled water. Then it was stirred up using a glass rod and allowed to rest for 1 min. The fine particles that were not ashes precipitated to the bottom of the cone, while ashes floated and were decanted immediately on a long neck glass funnel, upon which a filter paper was placed to retain them. Subsequently, the ashes were placed in a porcelain capsule to be dried up in an oven at 100 ºC until a constant weight was reached. The dry ash sample was prepared to carry out its digestion in the CEM trademark microwave oven.
Chemical analysis of particulate matter samples
To carry out the laboratory analyses, a Thermo Scientific iCE 3500 AAS System atomic absorption spectrophotometer was used, which is installed and operated in the laboratory of the Technological Institute of Boca del Río, Veracruz. The following analysis technique was applied to the ash samples:
1. Preparation of laboratory material for analysis of the particulate matter (ash) samples. The preparation of the material used in the laboratory was carried out under the specifications established by NOM-117-SSA1-1994 and NOM-242-SSA1-2009 for the analysis of heavy metals, in which the various methods for determining Cd, Pb, Cu, and Zn in food, drinking water, purified water and specific substrates by atomic absorption spectrometry are described.
2. Cleaning of Teflon and glass materials for sample analysis. The cleaning of the Teflon materials for digestion and glassware was carried out with phosphate-free mild (neutral pH) soap at 10 % per liter of distilled water. This soap was used in order to avoid ionic interferences in the spectrophotometer reading. After soaping the material and rinsing it with tap water, it was immersed in a distilled water solution with 20 % nitric acid (HNO3) (per liter).
The Teflon beakers remained for 1 to 2 h in this solution, while the glassware remained for 24 h. Once the process of removing any metal residue in the HNO3 solution was completed, the materials were immersed in type II or double-distilled water. The glassware and Teflon beakers remained there for up to 24 h to ensure a complete removal of the acid.
Finally, the materials were removed from the type II water and drained onto the absorbent material. The clean and dry material was suitably placed in duly labeled, airtight (Ziploc) bags or containers with a lid.
3. Digestion of particulate matter samples. First, 0.5 g of a particulate matter sample were weighed. Each sample was then placed in an HP-500 Teflon beaker, to which 10 mL of 70 % (suprapur) reactive grade HNO3 were added. Previously, a safety membrane was placed inside each valve or blue plug. The valve was placed in the beaker cup and gently adjusted to the bottom. The beakers were then placed in a CEM MARS X microwave oven.
All samples were analyzed with a blank sample containing 0.5 mL of double-distilled water and 10 mL of HNO3 of the same characteristics, as well as a reference control. Programming of the digestion process was made by the Soil-3051 HP500 method.
The power was adjusted based on the number of beakers used: 1-3 (300 W), 4-6 (600 W) and 6-12 (1200 w) (Table I).
TABLE I PROGRAMMING OF THE MICROWAVE OVEN SOIL-3051 HP500 METHOD FOR SOLID WASTE
| Stage | Power | Ramp | PSI | ºC | |
| Max | % | ||||
| 1 | 1200 W | 100 | 2:00 min | 300 | 165 |
| 2 | 1200 W | 100 | 10:00 min | 300 | 175 |
Note: The power was adjusted based on the number of beakers used: 1-3 (300 W), 4-6 (600 W) and 6-12 (1200 W)
PSI: pressure per square inch, Ramp digestion time in each stage
Once the digestion was completed, the Teflon beakers were removed from the oven and placed in the fume hood for toxic vapors, using the required safety measures such as the use of glasses, mask and gloves, in order to facilitate the handling of the samples. The blue valve on the beakers was carefully opened to gradually lower the pressure. Subsequently, the beakers were carefully opened to prevent the change of pressure derived from ejecting the sample outside of them.
The samples obtained were filtered using a Nalgene bottle with a 0.45 μm Millipore filter and a vacuum pump. The filtrate was poured into a 25 mL volumetric flask and brought to volumetric level with type II or double-distilled water. The filled flasks were stirred to homogenize the sample, which was then poured into a previously labeled glass or plastic amber container. Finally, parafilm was placed in the mouth of the amber containers, which were then placed in airtight (Ziploc) bags for storage at about 4 ºC until read on the atomic absorption spectrophotometer.
Prior to the sample reading, a calibration curve had to be prepared for each metal analyzed, for which certified standards of trademark High Purity Standards were used. Thus, the sample readings and standards used for each metal are described as follows:
Cd: a wavelength of 228.8 nm with a 50 % current lamp, a flame of air-C2H2, with a lighter height of 4.1 mm and a combustion flow of 1.0 L/min were used.
Cu: a wavelength of 324.8 nm with a 75 % current lamp, a flame of air-C2H2, with a lighter height of 4.1 mm and a combustion flow of 1.0 L/min were used.
Zn: a wavelength of 213.9 nm with a 75 % current lamp, a flame of air-C2H2, with a lighter height of 7.0 mm and a combustion flow of 1.0 L/min were used.
Pb: a wavelength of 217.0 nm with a 90 % current lamp, a flame of air-C2H2, with a lighter height of 5.4 mm and a combustion flow of 1.3 L/min were used.
In addition, the optimization of instrumental specifications such as airflow, acetylene gas, lamp wavelength and lighter height for each metal was done. After this, the equipment became stable and the corresponding standards (with known concentrations and a lower to higher concentration range of analyte) were read for each studied metal. To obtain a calibration curve with a correlation coefficient greater than 0.99, the reading of the digested samples absorbance was made. Hence, the obtained results remained within the concentrations of the calibration curve.
RESULTS AND DISCUSSION
Concentration of heavy metals in particulate matter
Cadmium (Cd)
It was found that the concentrations of Cd in the analyzed samples ranged from 0.451 to 432.81 µg/g for both zones where samples were collected (Fig. 3). The highest Cd concentrations were recorded in zone A.
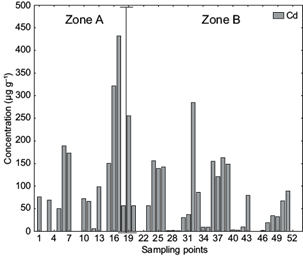
It was also found that Cd exceeded the maximum allowable limit for industrial use according to the Official Mexican Standard NOM-147-SEMARNAT/SSA1-2014, which is 39 µg/g. The obtained concentrations of Cd also exceeded the 6 µg/g limit established by the Federal Commission for Protection from Health Risks (COFEPRIS, Spanish acronym) for the consumption of bivalve mollusks, hence it is considered a risk to public health when the particulate matter containing Cd is deposited in water streams or water bodies (Lango-Reynoso et al. 2010). It is important to emphasize that these concentrations were only found in 50 g of particulate matter.
Likewise, heavy metals have been found in different concentrations in fish, meat and milk resulting from bioaccumulation and transport processes from the environment to water sources. Some species such as oysters, shellfish and mollusks accumulate Cd from water in the form of linker peptides until reaching concentrations between 100 and 1000 µg/g (Luo et al. 2009). Reyes et al. (2016) mentioned that Cd concentration values higher than 50 μg/g in industrial activities represent a risk to public health if inhaled by exposed workers.
As a result of population growth, human beings have been the most affected by industrial development. In this regard, several studies have detected that the organ most susceptible to potential damage caused by Cd inhalation is the lung. Chronic obstructive airway diseases associated with prolonged exposure to intense Cd inhalation have also been reported. Among other conditions, lung cancer development has also been documented (Gomez-Caminero et al. 2001).
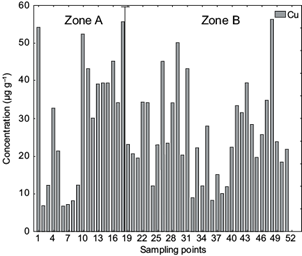
Copper (Cu)
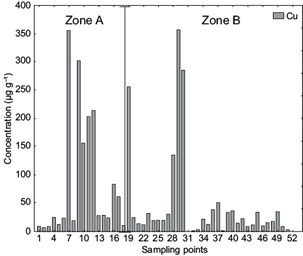
Figure 4 shows that the Cu concentration values ranged from 0.034 to 356.91 µg/g. The sampling points closest to the emission source had the highest concentrations of this metal. Mohanraj et al. (2004) reported that heavy metals in airborne particulate matter, such as Cu, can also be attributed in part to vehicular emissions. This finding can be supported by the fact that there was a permanent traffic of 530 big lorries transporting harvested sugarcane from the fields to the sugar mill. Moreover, the traffic of public transportation and private local vehicles was also observed.
Kabata-Pendias (2000) reported a Cu concentration of 0.2 μg/g in agricultural soils in the Aconcagua River basin (Valparaíso region, Chile), which causes plant susceptibility due to the phytotoxic effects of this metal.
The arrival of Cu to water bodies and, subsequently, to underground streams is the result of agricultural and industrial activities that emit this element in the form of particulate matter (Herrera-Núñez et al. 2013). The average Cu concentration found in the waters of the Chico River, Venezuela, was 11.52 μg/g, similar to the maximum value established for non-polluted environments. It was also reported for the Boca River in Paparo, Venezuela, that the Cu level was higher than 46.1 μg/g because it is in an area polluted by industrial activities (Sadiq 1992, Acosta et al. 2002).
In this sense, the Cu concentration found for a 50 g sample in this study area could imply a harm to either human health or the environment. However, there is a potential future risk, due to the adhesion of this heavy metal to human, animal and plant tissue.
The exposition to Cu and other heavy metals adhered to particulate matter and released to the atmosphere as a result of sugarcane burning and the agroindustrial activity of La Gloria mill pose a high risk and harm to human health. Regarding the latter, NOM-010-STPS-1999 sets the maximum permissible limits for Cu smoke exposition during eight daily or 40 weekly hours. The maximum permissible exposure limit (PEL) is 0.2 μg/m and the short-term exposure limit (STEL) is 2 μg/m.
Since the devices used herein had a total volume of 0.018 m3, in which a weight of about 20 g of particulate matter was collected in each sampling for each site, when converting the container volume to cubic meters the amount of ashes as well as smoke was about 1061 g. Therefore, the obtained results may be clearly suggesting that most of the concentrations of Cu obtained in this study are greater than the permissible limit established by NOM-010-STPS-1999 (Fig. 4). The reason for writing down the former paragraph in such way is that the particulate matter sample was not directly measured in cubic meters as mentioned by the referred NOM.
Lead (Pb)
The Pb results obtained herein showed an upward behavior in concentrations, which were observed in a range from 101.45 to 1892.1 μg/g (Fig. 5).
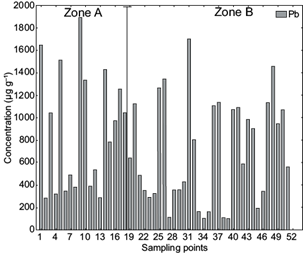
NOM-147-SEMARNAT/SSA1-2014 sets a maximum permissible limit of 600 μg/g for the concentration of Pb in industrial zones. From the results observed in the studied area surrounding La Gloria mill, it can be observed that concentration levels are higher than those established by the standard. This indicates that the environment is being affected by Pb concentrations present in particulate matter emitted by the mill and sugarcane burning.
Pb that is dispersed into the atmosphere, which adheres to particulate matter resulting from industrial and agroindustrial processes, is responsible for harmful health effects in people, animals and plants (Sánchez 2000). It has been reported that some plant species have a tolerance level of less than 1 μg/g of Pb bioaccumulation in the soil. When this Pb concentration is exceeded, plants organs do not assimilate this metal and therefore they die. In addition, the Joint FAO/WHO Expert Committee on Food Additives and Codex Alimentarius (JECFA) established the maximum permissible limit of Pb in horticultural plants in the range of 100 to 300 μg/g (CAC 2011).
The maximum permissible limits set up in these standards are used as a reference for establishing safety criteria for agricultural products projected for human consumption. In this sense, the Pb concentrations found within the study area were higher than those indicated in these standards. Therefore, horticultural plants planted inside or close to the study area are exposed to contamination by Pb adhering to particulate matter.
Zinc (Zn)
This element presented the lowest concentrations with respect to the other heavy metals determined in the studied area. These concentrations were found in the range of 6.83 to 56.39 μg/g (Fig. 6). Both NOM-127-SSA1-1994 and the Ecological Criteria for Water Quality (CE-CCA-001/89) establish a maximum permissible limit of 5 mg/L, which is approximately equal to 5 μg/g. When this particulate matter is deposited in any water body that can be eventually used for human consumption, it becomes a risk to public health.
In this regard, Machado et al. (2008) reported concentrations of 7.41 μg/g in particulate matter within an industrial area of the city of Buenos Aires, Argentina, where there was also high diesel-powered vehicular traffic.
Even though the Zn concentrations observed in this study were lower than those found for Cd, Cu and Pb, this does not ensure that the agroecosystems are not at risk, since prolonged exposure to this metal may cause alterations or decreases in agricultural production (Risser and Baker 1990).
Tembo et al. (2006) also reported that the concentration of this element decreases in soil, plants and water bodies, due to factors such as temperature, rainfall and soil moisture, as well as to leaching and dispersion processes of this element by air. This latter process is also a function of the distance from the sampling sites to the emission source.
The concentration values of Cd, Cu, Pb and Zn found in the particulate matter samples collected in sampling areas A and B of the studied area, do not show significant statistical differences. This could be partially attributed to the fact that only a single mill with an emission source of considerable importance was considered. However, in this analysis it was found that Pb had a higher concentration in comparison to the other heavy metals identified in this research work.
Distribution and levels of contamination by heavy metals
A heavy metals index was constructed through a principal component analysis (PCA) for the concentrations of particulate matter collected at the sampling sites under study. By means of this analysis, the eigenvalues for each component were identified. Subsequently, component one (C1) was chosen because of its greater explained variance (Table II). According to the PCA, this indicates that the first component (factor) has the highest eigenvalue of all factors, differentiating the highest and lowest value of the components.
TABLE II ANALYSIS OF THE EXPLAINED VARIANCE MATRIX
| Variable | Factor 1 | Factor 2 | Factor 3 | Factor 4 |
| Lead | 0.825 | -0.174 | 0.169 | -0.511 |
| Cadmium | 0.032 | -0.910 | 0.320 | 0.261 |
| Copper | -0.006 | -0.395 | -0.912 | -0.108 |
| Zinc | 0.815 | 0.209 | -0.190 | 0.506 |
| Exploratory variable | 1.345 | 1.058 | 0.999 | 0.597 |
| Total proportion | 0.336 | 0.265 | 0.249 | 0.149 |
The PCA also allowed the acquisition of the factorial loads (index) for each variable, in which the sites with the highest and lowest concentration of heavy metals were detected (Fig. 7).
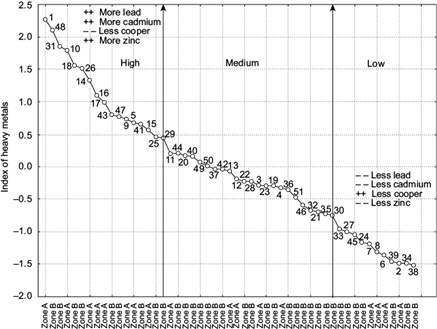
Fig. 7 Classification of contamination levels in high, medium and low groups, according to the index obtained from the principal component analysis
In this sense, it is convenient to emphasize that the source of energy to operate La Gloria mill is the combustion of fuel oil combined with bagasse of cane; this results in the emission of large volumes of particulate matter containing heavy metals (i.e., Pb and Zn). In the opinion of the authors, this causes the adherence of Pb and Zn during the process.
In addition, it has been reported that Zn concentrations in the environment are increasing due to anthropogenic activities. A considerable amount of Zn is added as a result of industrial and mining activities as well as carbon combustion (Pacyna 1996, Shallari et al. 1998, He et al. 2005, Arruti et al. 2010). Therefore, when one can see the results derived from the principal component analysis, it is observed that Pb and Zn show a good correlation with factor 1. Therefore, it is reasonable to asseverate that the source of major impact in the Pb and Zn concentration is fuel oil and bagasse combustion, which is enhanced by sugarcane burning and the permanent traffic of lorries transporting the harvested sugarcane and particular vehicles from local inhabitants.
Furthermore, the PCA was a useful statistical tool to group the concentrations of the analyzed heavy metals into the following categories: high, medium and low. It also made possible to build up a map that included isolines for Cd, Cu, Pb and Zn.
Table III shows that factor one has a high correlation with Pb and Zn, which makes them the most representative metals.
Distribution of particulate matter
Particulate matter is emitted through the industrial chimney stack. The higher the chimney is, the greater the probability that pollutants will be dispersed and diluted before affecting neighboring populations. The chimney’s visible emission is called plume, and its height is determined by the speed and thrust of the gases coming out of the chimney (Lou et al. 2009). According to the distance at which the highest concentrations of particulate matter occur these are not dependent on wind speed (Solís y López 2003). The highest concentration is maintained at a distance of 500 m from the emitting source. Usually wind favors the dispersion of pollutants and humidity plays a negative role in the dispersion, due to the concentration of smoke and particulate matter.
The distribution of particulate matter in the surrounding area of La Gloria sugar mill and the sugarcane burning area presents a high level of concentration in places closest to the emission source, with distant sites presenting medium and low concentrations. This is attributable to the dispersion, i.e., the transport of particulate matter in the air, which depends on the prevailing weather conditions such as wind speed and direction that were observed while collecting the particulate matter samples. This information was not available for the studied zone and it was not possible to retrieve it from institutions like the Water National Commission (CONAGUA, Spanish acronym), hence it was not included in the article. The different types of volatile particle dispersion phenomena caused accumulation in areas close to the source of emission and their transport to closer areas. Figure 8 shows the location of the sampling sites; the high, medium and low concentration levels are indicated by using the following geometric figures: circles, squares, and triangles.

Fig. 8 Geographic distribution of sampling sites and concentration levels of the metals found in this study
It is necessary to clarify that the scope of this study was constrained to the determination of concentrations and spatial distribution of the heavy metals Cd, Cu, Pb and Zn present in particulate matter emitted by the La Gloria sugar mill and sugarcane burning in regional agroecosystems, as a function of the distance at which such material was deposited during the emission process. The reason to stress this issue is the lack of financial support, which hindered the extension of this research work to other aspects.
By means of an analysis of variance of the high, medium and low concentration types, it was found that there were significant statistical differences (p = 0.0001) between types (Fig. 9).

CONCLUSIONS
Each of the metals had different concentrations. Cd exceeded the maximum permissible limits established by the Official Mexican Standard NOM-147-SEMARNAT/SSA1-2014, in terms of heavy metal concentrations in industrial zones. This standard also establishes the maximum permissible limits for Pb, which in this study exceeded the norm. Both Cu and Zn had low concentrations; however, their minimal presence does not make them less dangerous for regional agroecosystems.
Particulate matter emitted by La Gloria mill shows high concentrations of the studied heavy metals, which affect - as mentioned in previous paragraphs - the flora, fauna and water of the region’s agroecosystems, due to the fact that plants undergo modifications in their stomata opening, photosynthesis and transpiration, and their ability to synthesize chlorophyll is inhibited. Moreover, these concentrations degrade the soil and change its alkalinity.
Carrying out this research project posed a great challenge due to the presence of strong northerly winds, which greatly hampered the collection of ash samples in the studied sites. This leaves us with the task of developing appropriate equipment and instruments to carry out the monitoring of concentrations of heavy metals and other elements in the particulate matter emitted by La Gloria mill and sugarcane burning. Heavy metals such as Cd and Pb are considered carcinogenic to humans and represent a latent risk of causing bronchopulmonary and ocular diseases to residents living in the area where this study was carried out.

