


 text new page (beta)
 English (pdf)
 Article in xml format
 Article references
 Send this article by e-mail
 Cited by SciELO
  Similars in
SciELO
Similars in
SciELO 
 Permalink
1. Introduction
Drought is a climate feature that occurs occasionally. This phenomenon, which affects more people than any other hazard, is considered by many to be the most complex but least understood of all the natural vulnerabilities (Mishra and Desai, 2005). In Iran, arid climate extends to an area of 573 884 km2 (35.54% of the territory). The Maharlu-Bakhtegan basin is located in this area; therefore, precipitation and water shortage in this region are very problematic. Meteorological drought occurs when the precipitation average is less than the precipitation average during the long-term period. In Iran, we are confronting challenges in many areas that have arid and semi-arid climates and suffer drought events, so it is necessary to pay more attention to precipitation. Pre-knowledge of the possible amount of precipitation is important in planning water recourses, management of agriculture and droughts, etc. Previous studies show that large-scale climate modes (e.g., North Atlantic Oscillation [NAO], South Oscillation Index [SOI]) have an influence on climate and precipitation in different parts of the world (Nazemosadat and Cordey, 2000; Karabörk et al., 2005; Gaughan and Waylen, 2012; Berg et al., 2013; Choubin et al., 2014b).
In this study, we used large-scale climate indices for predicting the standard precipitation index (SPI). Among the several proposed drought monitoring indices, SPI has widespread application for describing and comparing droughts among different time periods and regions with different climatic conditions (Cancelliere et al., 2007). SPI prediction is a critical issue that has attracted much attention in recent decades all over the world in order to carry out hydrological modeling in arid and semi-arid regions (Rezaeian-Zadeh et al., 2012). Today, more non-linear models are applied to prediction. In previous studies, Dahamsheh and Aksoy (2009), Azadi and Sepaskhah (2012), and Rezaeian-Zadeh et al. (2012) used artificial neural networks (ANNs), and El-Shafie et al. (2011), Sanikhani and Kisi (2012), Jeong et al. (2012), and Choubin et al. (2014a) successfully applied the adaptive neuro-fuzzy inference system (ANFIS) to predict precipitation. In eastern Australia, Deo and Sahin (2015) investigated the application of the ANN model for the prediction of monthly SPIs using hydrometeorological parameters and climate indices. The results showed that the ANN model is a useful data-driven tool for forecasting monthly SPIs.
In the Awash River Basin (Ethiopia), Belayneh et al. (2014) forecasted the long term SPI drought using wavelet neural networks. The forecasted results indicated that the coupled wavelet neural network (WA-ANN) models were better than all the other models in this study for forecasting SPI 12 and SPI 24 values. Ruigar and Golian (2016) predicted the precipitation in the Golestan dam watershed using climate indices: their results indicated that the MLP model is capable of accurately predicting monthly maximum precipitation.
In this study we compared the performances of three modeling techniques for predicting drought in a 43-yr period (1967-2009) in the Maharlu-Bakhtegan basin of Iran. We used the M5P model tree in addition to ANFIS and the multilayer perceptron (MLP) network to predict the SPI using large-scale climate indices as input data, over lead times of 1 to 12 months.
2. Methodology
2.1 Study area
The Maharlu-Bakhtegan basin spreads over 31 000 km2. This area located in southwestern Iran (29° 00' to 31° 14' N, 51° 42' to 54° 31' W), with annual precipitation of270 mm, is one of the most important agricultural centers of Iran (Fig. 1). In this paper, precipitation data were collected from the Iranian Water Resource Management Company (TAMAB) for four meteorological stations: Shiraz synoptic station, Dashtbal, Ali Abad Khatr and Dehkade Shahid. First, station data were analyzed and missing data were reconstructed by using the correlation method; then homogeneity and independence of data were evaluated using the run-test method. Homogeneity and dependence were accepted at a high level. We used Thiessen polygons between stations to calculate the average of watershed precipitation.

2.2 Standard precipitation index
The SPI was formulated by McKee et al. (1993) in the Colorado Climate Center. It is a relatively new drought index based only on precipitation, which is very important to farmers and responds fairly immediately to rainfall or dryness. This index is the number of standard precipitation deviations that the observed value would deviate from the long-term climatological average. Either a gamma distribution or a Pearson type III distribution is used for its transformation into a normal distribution (Guttman, 1999). It can be calculated for any time scale; yearly, seasonally, monthly or for various months. In this study, a monthly SPI was obtained based on the average rainfall over the basin for a 43-yr period (1967-2009).
2.3 Large-scale climate indices
Climate signals are oceanic and atmospheric patterns that affect the Earth's climate in different regions. In this study, the 25 indices were obtained from the National Oceanic and Atmospheric Administration (NOAA) site (http://www.esrl.noaa.gov/psd/data/climateindices/list/). Then, factor analysis was used to choose the most effective climate index by reducing the complexity of input variables when there are large volumes of information, thus allowing a better interpretation of variables.
2.4 MLP network
ANNs are simplified versions of a human brain and consist of input, hidden and output layers (Gunaydin, 2009). MLP is the most common neural network model (Zurada, 1992; Hagan et al., 1996).
In this paper, we used the Levenberg-Marquardt (LM) training algorithm to obtain the weight of the MLP network. LM can be thought as a combination of steepest descent and the Newton method. The MLP network consists of an input layer of source neurons, at least one middle or hidden layer of computational neurons, and an output layer of computational neurons. The output of an artificial neuron can be expressed as follows:
 (1)
(1)
where n is the total number of inputs, x 1,x 2,...,xn are the inputs, w1, w2,...,wn are corresponding weights for the inputs.
In this study, the optimum number of hidden neurons and transfer functions was obtained by experiments or by trial and error. Logsig and Purelin transfer functions were used in the hidden and output layers, respectively.
2.5 M5P model tree
Model trees were developed by Quinlan (1992). M5P is a tree-based model used for prediction. Instead of discrete class labels, it uses linear functions at the leaves. M5P is based on the assumption that the functional dependency is not constant in the whole domain, but can be considered on smaller sub domains (Dimitri and Xue, 2005).
2.6 ANFIS model
ANFIS is a kind of neural network based on the Sugeno fuzzy inference system (Takagi and Sugeno, 1985), and was first introduced by Jang (1993). This system uses either back propagation or a combination of least squares estimation and back propagation for estimating the membership functions' parameters.
Since the number of inputs in our study was greater than six, we cannot use grid partition because the number of fuzzy rules would be too large (Farokhnia et al., 2011). So substractive fuzzy clustering algorithms were used to establish rules based on the relationship between input and output variables (Jang and Sun, 1995). Subtractive fuzzy clustering was introduced by Chiu (1994). In this study, the hybrid optimization method, which is a combination of least-squares and back propagation gradient descent method was used as an optimization method; also, Gaussian and linear membership functions were selected as optimum for input and output data, respectively; and the number of membership functions was determined through trial and error by varying the range of influence from 0.5 to 1.5.
In the present paper, we used Matlab R2010b for simulating the ANFIS and MLP models, and the Weka package for the M5P model tree. The input data were divided into two parts: training and testing data in an 85 and 15% combination, respectively.
2.7 Data normalization and evaluation criteria
Climate data in a semi-arid region are sparse and irregular in distribution; the best way to improve the robustness of climate information would be data normalization. The best range for data normalization is 0.05-0.95 (Hsu et al., 1955), as follows:
 (2)
(2)
where, xnorm and xr are the normalized and the original inputs, and xmin and xmax are the minimum and maximum input ranges, respectively.
Some of the common parameters, including root mean square error (RMSE), mean error (ME) and percent bias (PBIAS) were used to check the performance of the applied models. These indices are valuable because they disclose errors in the units (or squared units) of the constituent of interest, which aids in the analysis of results (Moriasi et al., 2007). The PBIAS measures the average tendency of the simulated data to be larger or smaller than their observed counterparts; the optimal value is 0.0. Positive values indicate a model bias toward underestimation, whereas negative values indicate a bias toward over-estimation (Gupta et al., 1999). These parameters were calculated as follows:
 (3)
(3)
 (4)
(4)
 (5)
(5)
where N is the number of data points considered, and Oi and Pi are the observed and predicted values, respectively.
3. Results
Factor analysis showed that the Kaiser-Meyer-Olkin (KMO) statistic equals to 0.69, so the input variables are suitable for factor analysis (Shrestha and Kazama, 2007). Eight components had eigenvalues greater than 1 and contained 81% of the total variance. Thus, eight climate signals (AMO, AMM, BEST, NINO3.4, NINO4, NTA, SOI, TNA) were selected as most effective after a Varimax rotation with factor loadings of 0.904, 0.826, 0.952, 0.918, 0.855, 0.908, -0.849, and 0.927, respectively.
Table I shows the performance of the ANFIS, M5P and MLP models in predicting SPI time series 12 months in advance. Regarding data testing, the best performance of ANFIS was found for eight-months in advance prediction, with RMSE, ME and PBIAS values of 1.032, 0.011, and 3.55, respectively (Table I). For the M5P model tree, the minimum values of RMSE, ME and PBIAS are related to 10-months in advance predictions (RMSE = 0.828, ME = -0.007, and PBIAS = -2.12). For MLP, the best performance of prediction was obtained one step ahead compared to other models (RMSE = 0.802, ME = -0.002, and PBIAS = -0.47) (Table I). PBIAS indicated that predictions are mostly overestimated (about 85, 54 and 70% for ANFIS, M5P model tree and MLP, respectively).

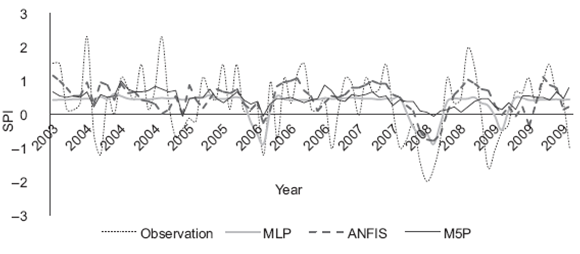
In this paper, we used a Taylor (2001) diagram (Fig. 2) to evaluate the accuracy of ANFIS, MLP, and the M5P model tree. This diagram provides a visual framework for comparing different model results to a reference model or, mainly, to observations. The Taylor diagram is drawn by standard deviation (STD), centered root mean square error (RMSE) and correlation (COR) between different models and observations. Statistics of STD, RMSE and COR were computed for ANFIS, the M5P model tree and MLP from one to 12 months in advance (Fig. 2). The position of each model in the plot shows how closely the simulated SPI pattern matches with observations. From Fig. 2 it can be seen that predictions of ANFIS and MLP are in agreement with observations, unlike the M5P model tree. Although predictions in ANFIS and MLP are quite similar, some step predictions in MLP are closer to observations (e.g., one-month-in-advance predictions). Standard deviation of prediction data indicated that none of the models was able to predict fluctuations in observation data. Figure 3 compares the observed and predicted SPI for the testing set in a one-month lag time.

Fig. 2 Comparisons of observed and predicted SPIs by MLP, ANFIS and the M5P model with a one-month delay.
4. Discussion
In this study we used climate indices to predict SPI. Factor analysis was used to determine the most important of large-scale climate signals. Sea surface temperature (SST) on the Pacific Ocean and ENSO (including the BEST, NINO3.4, and NINO4 signals), the southern oscillation index (SOI) and SST on the Atlantic Ocean (including the AMO, AMM, NTA, and TNA signals) were selected as the most important signals. In previous studies, Nazemosadat and Cordey (2000), Mariotti et al. (2002) and Pongracz and Bartholy (2006) showed the direct effect of ENSO on precipitation. Karabörk et al. (2005) indicated an inverse relationship between SOI and precipitation.
The ANFIS model was found to have the best performance for the eight-month in advance predictions, whereas the M5P model performed better for 10-month in advance predictions and the MLP network for one-month in advance. Error parameters (Table I) indicated that the MLP network performance was a little better than the other two models, while Dastorani et al. (2010) showed that the potential of ANNs with the ANFIS model is almost the same in predicting dry land precipitation. The Levenberg-Marquardt training algorithm (used in the MLP network) is more powerful and faster than the standard back-propagation algorithm (used in ANFIS) (Abyaneh et al., 2011). This may be the reason for the better efficiency of the MLP model compared to ANFIS. Also, we used the Taylor diagram (Fig. 2) to investigate the accuracy of the models. It is clear that MLP has a better aptitude in comparison with the M5P model tree and ANFIS.
5. Conclusion
Modeling is important in hydrology. This study investigated the prediction of SPI by using several models based on large-scale climate indices. Results showed that the performance of MLP was better than the M5P model tree and ANFIS (Table I). The best performance of the MLP model for SPI prediction was achieved with eight inputs, two hidden and one output neuron (MLP [8, 2, 1]) for a one-month-in-advance prediction. Also, the Taylor diagram (a very useful tool that compares the performance of different models) indicated that MLP is more efficient than the M5P and ANFIS models. There are many parameters for the determination of models' performances, but hydrologists need a tool that can compare different models. The Taylor diagram would be helpful for this purpose. We hope modelers further use this tool in natural sciences and hydrology modeling.

