


 text new page (beta)
 English (pdf)
 Article in xml format
 Article references
 Send this article by e-mail
 Cited by SciELO
  Similars in
SciELO
Similars in
SciELO 
 Permalink
Introduction
Despite the constant analysis and interpretation of hyperspectral and spectroscopic data for different plant species, there are several difficulties with the identification of flora due to a combination of factors such as variability in atmospheric conditions (Jensen 2005), soil humidity and flooding (Guo et al. 2017a), angle of incidence (Kuenzer et al. 2011), choice of optimal vegetation indices (Bannari et al. 1995), spatial resolution (Wulder et al. 2004), data availability for remote areas (Pettorelli et al. 2014), seasonal phenological changes (Flores-de-Santiago et al. 2013a), forest composition and structure (Barbosa et al. 2014), choice of method of analysis (Dronova 2015), and availability of minimum sample size (Congalton 1991). Consequently, spectroscopic results for tropical forests show high variability (Friess and Webb 2013), and spectral signatures are not unique at the species level (Flores-de-Santiago et al. 2016). However, in recent years, new sensors and methods that collect information with high spectral and spatial resolution have been developed (Guo et al. 2017b, Tian et al. 2017).
Mangrove forests are intertidal habitats located along tropical and subtropical zones (Tomlinson 1994). They are considered one of the most productive ecosystems in the planet because they maintain ecological balance in coastal lagoons (Agraz-Hernández et al. 2011), deltas (Nam et al. 2016), and nearby ecosystems such as seagrass beds (Chen et al. 2017) and coral reefs (Martin et al. 2015). Mangrove forests are important for local communities because they help prevent coastal erosion, benefit fisheries, and provide construction material (Mukherjee et al. 2014). The ecological importance of these ecosystems can also be associated with other factors such as primary production (high) (Komiyama et al. 2008), mitigation of global warming effects (Gilman et al. 2008), and regulation of the nutrient cycle (Keuskamp et al. 2015), in addition to being an important source of organic matter for local fauna (Nagelkerken et al. 2008). Despite their ecological and economic importance, 40% of mangrove species are currently threatened (Polidoro et al. 2010) by aquaculture-related activities (Duncan et al. 2016), deforestation (Duke et al. 2007), hydrocarbon pollution (Duke 2016), sea level rise (Lovelock et al. 2015), and hydrological changes (Flores-de-Santiago et al. 2017).
Mangrove forests reach maximum development at tropical latitudes where temperature variability in the environment is constant throughout the year (20 ± 5 ºC) (Tomlinson 1994), freshwater sources are abundant, and interstitial salinity is thus between 5 and 30 (Godoy and De Lacerda 2015). Conversely, estuaries and coastal lagoons in subtropical latitudes (i.e., arid regions) differ from their tropical counterparts in 2 general aspects. Firstly, river runoff is intense and constant during the short rainy season but inexistent during a considerable length of time (dry season). Secondly, there are dry floodplains separating terrestrial vegetation from mangrove forests. Both aspects result in hypersalinity of interstitial water (>80) for most of the year (Ridd and Stieglitz 2002). Hence, 2 mangrove physiognomic types are commonly found at subtropical latitudes: fringe mangrove forests (i.e., healthy) along the tidal channel and basin mangrove forests (stressed) in areas where water exchange is minimum or inexistent (Monroy-Torres et al. 2015). Basin mangroves tend to be short (i.e., chaparral) and, generally, form gaps in the forest canopy; as a result, they show variability in the chemical composition of their leaves when compared with the leaves of the same species in the fringe mangrove community (Flores-de-Santiago et al. 2012).
The main advantage of acquiring spectroscopic data for ecological studies of mangrove forests is that spectral information can be obtained quickly. This advantage increases the possibility of analyzing ties between spectroscopic data and biochemical variables using different statistical approaches (Flores-de-Santiago et al. 2016). However, spectral variability in the different mangrove species depends on many biochemical and structural factors. For example, the content and composition of photosynthetic pigments (chlorophyll a [chla], chlorophyll b [chlb]) affect the visible part of the electromagnetic spectrum (i.e., 400-700 nm) (Flores-de-Santiago et al. 2013b). In addition, nitrogen content (Zhang et al. 2013), leaf humidity, and air spaces in leaf structure can affect spectral response in the near-infrared (i.e., 700-1,300 nm) and shortwave infrared (i.e., 1,300-2,500) regions (Danson 1995).
Given the anthropogenic pressure on mangrove forests, especially in arid regions where environmental conditions are unfavorable, there is constant need for the development of efficient techniques to readily obtain information for the protection and management of these forests. Accordingly, conservation programs should include an optimal spectral analysis to determine mangrove forest distribution, species composition, and health condition. For example, spectroscopic studies on mangrove forests have been divided into 2 main fields: (1) estimation of photosynthetic pigments and (2) discrimination at the species level. With respect to the former, Zhang et al. (2012) carried out a comparative analysis between 5 vegetation indices obtained from spectroscopic (350-2,500 nm) and pigment (chla, chlb, and total carotenoids) data for the black mangrove (Avicennia germinans) under 3 conditions (stressed, dwarf, and healthy) and the red mangrove (Rhizophora mangle) under 2 conditions (stressed and healthy). Their results indicated maximum estimation of chla and chlb at wavelengths near the red edge (700-715 nm) and of total carotenoids at 510 nm. Flores-de-Santiago et al. (2013a) implemented a principal component analysis using 35 vegetation indices to estimate chla in a sample that comprised 3 subtropical mangrove species. Their results revealed a maximum chla estimation with the Vog1 vegetation index, which uses wavelengths near the red edge (740 and 720 nm). Pastor-Guzman et al. (2015) estimated chlorophyll contents in 4 tropical mangrove species from the Gulf of Mexico during the cold-front season using 21 vegetation indices obtained from spectroscopic data (350-2,500 nm). Their results indicated that it is possible to estimate chlorophyll contents using the red-edge wavelengths (705-753 nm) and to extrapolate this estimation to areas of interest using Landsat 8 images. Heenkenda et al. (2015) estimated chlorophyll content at the mangrove forest level in Australia using field measurements and a WorldView-2 image with high spatial resolution. Their results indicated that it is possible to estimate chlorophyll contents at the forest canopy level using the red (630-690 nm), red-edge (705-740 nm), near-infrared 1 (770-895 nm), and near-infrared 2 (860-900 nm) bands. Flores-de-Santiago et al. (2016) estimated pigment contents (chla, chlb, total carotenoids) with spectroscopic data (350-1,000 nm) using correlograms for 3 subtropical mangrove species during 2 seasons (rainy and dry). Their results indicated differences in pigment content estimates that depended on the season and the species.
Unlike the numerous studies on the estimation of photosynthetic pigment content, studies on the discrimination of species using spectroscopic data are scarce. For example, Vaiphasa et al. (2005) analyzed spectroscopic data (350-2,500 nm) for 16 tropical mangrove species in Thailand using probability distribution plots (analysis of variance [ANOVA]) and the Jeffries-Matusita distance and suggested that the 16 mangrove species can be classified according to 4 spectral regions located at 720, 1,277, 1,415, and 1,644 nm. Wang and Sousa (2009) studied spectroscopic variations (350-2,500 nm) in 3 tropical mangrove species from Panama using probability distribution plots (ANOVA) and a linear discriminant analysis and made discriminations between the 3 species using the 780, 790, 800, 1,480, 1,530, and 1,550 nm wavelengths. Panigrahy et al. (2012) used probability distribution plots (ANOVA) and a factor analysis with spectroscopic data (350-2,500 nm) on 4 tropical mangrove species from India and made discriminations between the 4 species with data from the red, near-infrared, and mid-infrared wavebands. Zhang et al. (2014) applied a principal component analysis and a discriminant analysis to spectroscopic data (350-2,500 nm) on 3 subtropical mangrove species during the dry season and suggested maximum species discrimination at the 520, 560, 650, 710, 760, 2,100, and 2,230 nm wavelengths.
Most spectroscopic studies have focused on analyzing mangrove species during a single season without taking into account the vertical distribution of leaves in the forest canopy. The vertical distribution of photosynthetic pigments is variable depending on the season, species, and physiognomic distribution (Flores-de-Santiago et al. 2012), and we therefore assume that the intensity of the spectroscopic signal presents seasonal variability. Thus, the aim of this study is to determine the spectral region that best discriminates the 3 subtropical mangrove species at the leaf level, between 2 canopy heights, during 2 seasons (rainy and dry), and between 2 physiognomic types (fringe and basin).
Materials and methods
Study area
Field work was carried out along the southern part of the coastal lagoon in the Urías system, Sinaloa, Mexico (23º13ʹ-23º11ʹN, 106º23ʹ-106º21ʹW), during the end of the dry season (May) and the rainy season (October) in 2010 (Fig. 1). Three mangrove species were selected: Laguncularia racemosa (white mangrove), Rhizophora mangle (red mangrove), and Avicennia germinans (black mangrove). Evaporation rate in the study area exceeds precipitation rate throughout most of the year (Flores-de-Santiago et al. 2012), gradually increasing the salt concentration between the tidal channel and the elevated part of the coastal lagoon (Villalba-Loera 1986). However, tropical storms and hurricanes during the rainy season (June-September) notably increase precipitation, which increases photosynthetic pigment contents in the mangrove forest (Flores-de-Santiago et al. 2012).

Figure 1 Location of the mangrove forest study area (yellow rectangle) on the southwestern section of the Urías coastal lagoon, Pacific coast of Mexico (enhanced near-infrared, red, and green bands from Sentinel-2; 26 January 2017). Filled circles indicate the sampling locations in the basin and filled squares the sampling locations in the fringe zone. Colors indicate mangrove species: Avicennia germinans (black), Laguncularia racemosa (yellow), and Rhizophora mangle (blue).
In this subtropical coastal lagoon, where freshwater input is not constant, tides play an important role in the hydroperiod (flood frequency and duration) of the mangrove forest (Monroy-Torres et al. 2015). Consequently, the fringe mangrove community is in a zone where flood frequency is higher and average salinity is 35 compared with the zone in which the basin community is found, where average interstitial salinity is 80 (Flores-Verdugo et al. 2015, Flores-Verdugo et al. 2018). Hence, we analyzed the 3 mangrove species in a fringe mangrove community (healthy) and in a basin mangrove community (stressed).
Spectroscopic data acquisition
For both seasons (rainy and dry), we selected 3 representative trees per species and physiognomic type. From each tree, we collected 10 random leaves from the upper part of the tree canopy, under direct solar radiation, and 10 leaves from the lower part of the canopy, in permanent shade. Specifically, the third leaf on the branch, from the tip down, was collected to avoid taking senescing leaves (Biber 2007). Once cut, all samples were individually stored in plastic bags and placed in a cool box at 4 ºC until spectroscopic measurements in the laboratory. The time between leaf collection and leaf analysis at the laboratory was 3 h. Leaf degradation is considered to be minimal so long as leaves are kept refrigerated and no considerable length of time passes by (Zhang et al. 2012). The spectroscopic reflectance of each leaf was measured with a FieldSpec HandHeld spectroradiometer (ASD, United Kingdom). An average of 10 readings were used for each sample avoiding the central axis with the RS3 program. The instrument wavelength range was 325-1,075 nm and spectral resolution was 1 nm. However, values under 450 nm and over 1,000 nm were eliminated due to noise caused by the instrument. Also, the spectroradiometer was fitted with a probe (Plant Probe) by an optic fiber cable to obtain a constant reading area over each leaf.
Statistical analysis
Maximum variability zones between the 3 species were analyzed using probability distribution plots of the 550 average reflectance values (450-1,000 nm) from the upper and lower parts of the tree canopy. This method was chosen for its efficiency when using continuous data, as it eliminates visual interpretation susceptibility in the analysis of reflectance curves (Sokal and Rohlf 2012). In addition, probability distribution plots help eliminate regions along the electromagnetic spectrum where the probability value (P) is higher than 0.01 or 0.05 (99% and 95% confidence limits, respectively). Briefly, the probability distribution plot provides a first approximation to the discrimination of spectroscopic data. In addition to the probability distribution plots, the first derivative of the electromagnetic spectrum was generated for every species and season. The information provided by the first derivative of continuous reflectance data has proven useful for discriminating vegetation (Cochrane 2000). In essence, the first derivative indicates if a function is increasing or decreasing and the rate of change. In graphical terms, the function reflects the slope of a tangent line to a base line on the graph (zero). The further the function is from the base line, the greater the variability of the sample.
Using the probability and first-derivative plots, we selected the wavelengths that showed the highest variabilities between species. These intervals were assessed with a canonical discriminant analysis (CDA) to verify the separation between the 3 mangrove species. The CDA is a dimension-reduction technique equivalent to the canonical correlation analysis, which is used to determine relationships between quantified variables in a discriminant space. Specifically, the CDA derives linear combinations from the original variables in the first 2 principal components, which explain much of the total variance (Sokal and Rohlf 2012). We also selected the wavelengths Wang and Sousa (2009) suggested for the discrimination of the same 3 mangrove species and the wavelengths Zhang et al. (2014) analyzed to discriminate the red and black mangroves. All calculations and figures were generated in Matlab.
Results
Basin mangrove samples exhibited higher reflectance variabilities along the electromagnetic spectrum compared with the fringe mangrove samples (Fig. 2). From the fringe mangrove samples, the white and black mangroves exhibited the lowest variabilities in the visible region of the electromagnetic spectrum. For the rest of the classes, high-variability regions were found between the green and red bands (500-680 nm) and along the near-infrared band (750-1,000 nm). With respect to the probability distribution plots for the dry season, a unique pattern in the mangrove classes was not found because variability was high (Fig. 3). Only the comparison between L. racemosa and R. mangle exhibited regions where there were no significant differences (P > 0.05) between leaves from the upper and lower parts of the forest canopy. However, the regions were not always present in all physiognomic types and fluctuated between the red-edge and near-infrared regions. Leaf samples taken during the rainy season showed a more diverse pattern (Fig. 4). Notably, basin mangrove samples exhibited regions where there were no significant differences (P > 0.05) along the blue (450-500 nm), yellow-to-orange (570-610 nm), red-edge (700-720 nm), and near-infrared bands. By contrast, fringe mangrove samples taken during the rainy season exhibited zones of minimum variability between L. racemosa and R. mangle at the start of the near-infrared region (740 nm). Note that the green (500-570 nm) and near-infrared (780-1,000 nm) regions showed significant differences (P < 0.01) between all classes and physiognomic types.

Figure 2 Average reflectance (n = 30, solid line) and first standard deviation (dashed line) for leaves of 3 mangrove species in basin and fringe forests.

Figure 3 Probability (P) plots of leaf spectral data for Laguncularia racemosa (LR), Rhizophora mangle (RM), and Avicennia germinans (AG) during the dry season.
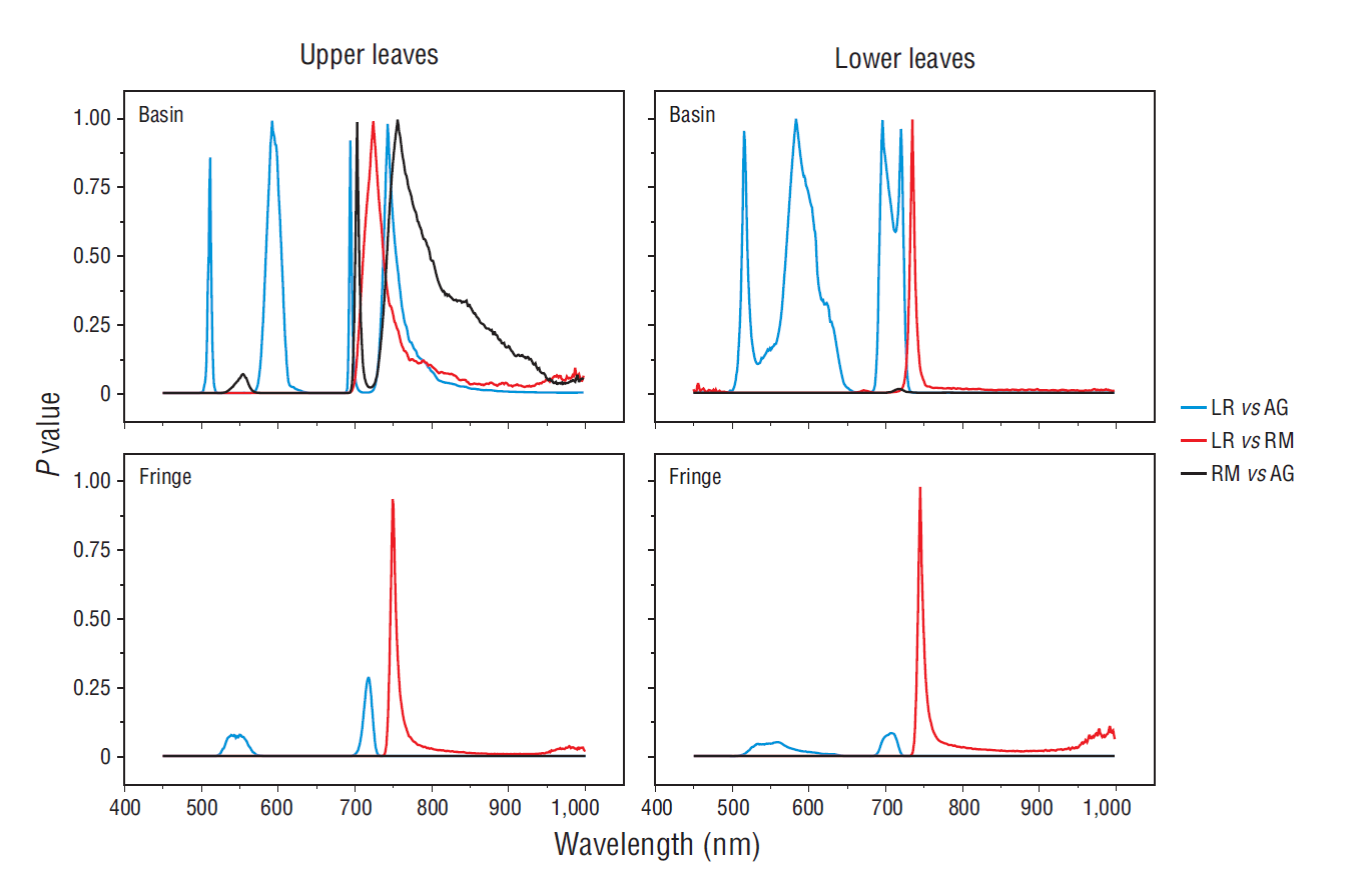
Figure 4 Probability (P) plots of leaf spectral data for Laguncularia racemosa (LR), Rhizophora mangle (RM), and Avicennia germinans (AG) during the rainy season.
In general, first-derivative plots for the dry (Fig. 5) and rainy (Fig. 6) seasons did not show constant trends. However, areas with no apparent changes corresponded to wavelengths under 540 nm, 600-700 nm, and 740-1,000 nm. On the contrary, trends with notable changes were present at 540-560 nm and 700-720 nm. On the basis of our previous results, we selected the green (540-560 nm) and red-edge (700-720 nm) regions for the CDA.

Figure 5 First-derivative plots of leaf spectral data for Laguncularia racemosa (LR), Rhizophora mangle (RM), and Avicennia germinans (AG) during the dry season.

Figure 6 First-derivative plots of leaf spectral data for Laguncularia racemosa (LR), Rhizophora mangle (RM), and Avicennia germinans (AG) during the rainy season.
The CDA showed successful discrimination between mangrove species when the green and red-edge wavelengths were used (Fig. 7). Species in the basin mangrove forest showed notable separation between samples from upper and lower parts of the forest canopy during the dry season. During the rainy season, the 3 mangrove species could be separated, but no significant differences were found between both parts of the canopy. This last pattern was observed for the fringe mangrove samples during both seasons. It was not possible to separate species and physiognomic types using the wavelengths suggested by Wang and Sousa (2009) for the same 3 mangrove species (Fig. 8). Only the combination of wavelengths suggested by Zhang et al. (2014) can discriminate basin and fringe mangrove species during the rainy season (Fig. 9). However, Zhang et al. (2014) did not include spectral data on the white mangrove, and low discrimination between species and physiognomic types was thus to be expected.

Figure 7 Canonical discriminant analysis combining wavelengths from the 540-560 nm and 700-720 nm bands. Dashed lines represent the 95% confidence interval. Laguncularia racemosa (LR), Rhizophora mangle (RM), and Avicennia germinans (AG).

Figure 8 Canonical discriminant analysis combining the wavelengths suggested by Wang and Sousa (2009) (780, 790, and 800 nm). Dashed lines represent the 95% confidence interval. Laguncularia racemosa (LR), Rhizophora mangle (RM), and Avicennia germinans (AG).

Figure 9 Canonical discriminant analysis combining the wavelengths suggested by Zhang et al. (2014) (520, 560, 650, 710, and 760 nm). Dashed lines represent the 95% confidence interval. Laguncularia racemosa (LR), Rhizophora mangle (RM), and Avicennia germinans (AG).
Discussion
Discrimination of mangrove species at the leaf level using spectroscopic data is the first step to obtaining an optimal classification of a mangrove forest in a dynamic environment. The results of our analysis show that the distribution of leaves in forest canopies plays an important role in the spectroscopic variability in the types of mangroves, particularly in stressed mangrove forests. This could be a fundamental factor when classifying a mangrove forest using satellite imagery, but it depends on the season during which the images are obtained. Another factor that must be considered is physiognomic classification, since the same species exhibited spectroscopic differences according to physiognomic types.
Within the current techniques for selecting optimal wavelengths from spectroscopic data, the use of probability distribution plots (ANOVA) has been suggested as an efficient method to limit the number of data when classifying mangroves (Wang and Sousa 2009, Panigrahy et al. 2012). However, ANOVA diagrams did not distinguish the zones where the 3 species presented spectroscopic similarities (data not shown). For this reason, we had to use a more thorough method when plotting probability distributions, which included pairwise comparisons between species (see Figs. 3, 4). We expected our data to show higher variability compared with that reported in previous studies, such as that by Wang and Sousa (2009), in which different mangrove species in tropical environments were analyzed and no apparent differences between samples from the upper and lower parts of the forest canopy were found. Changes in the composition of photosynthetic pigments with respect to the position of leaves in the forest canopy have been reported (Flores-de-Santiago et al. 2012), and in our study, the position (upper or lower) of leaves largely influenced the determination of spectroscopic variability in the basin mangrove samples.
Although we obtained detailed results with the probability distribution plots by pairs of species, it was necessary to include the first-derivative analysis in order to choose the optimal wavelengths. As a result, wavelengths from the green (540-560 nm) and red-edge (700-720 nm) regions showed effective discrimination between mangrove species. The significance of the green and red-edge wavelengths in the spectroscopic analysis of tropical vegetation is not a novel finding. For example, previous studies have achieved effective discrimination when using data with wavelengths around 550 and 745 nm for several plant species (Gitelson et al. 1996, Lichtenthaler et al. 1996). However, the differences found between physiognomic types and the analyzed seasons, together with the high variability in the spectroscopic response of each mangrove species, suggest that the 3 species respond differently to the aforementioned regions of the electromagnetic spectrum depending on vegetation health.
Most of the previous studies on the classification of mangrove forests have used remote sensing data from conventional platforms (e.g., Landsat, SPOT), which collect information from the visible (blue, green, red) and near-infrared wavebands (Valderrama-Landeros et al. 2018). Traditional vegetation indices (e.g., normalized difference vegetation index, simple ratio) are generated using these wavebands, and these indices have been used to discriminate mangrove species to a certain degree (Kuenzer et al. 2011). Unfortunately, these sensors show limitations in the quantification of photosynthetic pigments (Flores-de-Santiago et al. 2016) and, as a result, in the efficient discrimination of species and physiognomic types because they cannot collect information from the red-edge waveband. In the future, satellite images including data from the red-edge waveband (e.g., Sentinel, RapidEye, WorldView) and images from remotely piloted aircraft systems (RPAS) could be used to determine photosynthetic pigments and to discriminate mangrove species at the forest canopy level in a more precise manner. However, although our discrimination of mangrove species at the leaf level was high, classification of mangrove species at the forest level using satellite images and RPAS may vary depending on soil reflectance and leaf angle.
Our results were not similar to those reported by Wang and Sousa (2009), who concluded that near-infrared wavelengths were optimal for the separation of the same 3 mangrove species. This discrepancy could be due to differences in the environments in which the mangrove species grew. Specifically, the 3 mangrove species studied by Wang and Sousa (2009) grew in a tropical climate, where there were less stress factors compared with the stress factors under which our mangroves grew. In addition, these authors indicated that there were no differences between leaves from the upper and lower parts of the forest canopy. This result is similar to what we found with our samples from mangroves growing along the tidal channel where stress factors lessened: spectroscopic data did not show differences between the 2 parts of the canopy. Unlike the lack of similarities with the results reported by Wang and Sousa (2009), our results are similar to those reported by Zhang et al. (2014), who found differences between red and black mangroves at specific wavelengths in the green (520 and 560 nm) and red-edge (710 nm) regions. However, there is a notable difference between our CDA results and those obtained by Zhang et al. (2014), since these authors did not include white mangrove samples and analyzed only one season.
We think that including the green region, together with the red-edge region, could be of great significance for the optimal classification of mangrove forests in subtropical environments where environmental conditions are unfavorable. The red-edge region has been categorized as a fundamental zone for the prediction of photosynthetic pigments in mangrove leaves (Zhang et al. 2012, Flores-de-Santiago et al. 2016) and for the discrimination of mangrove forests in southeast Asia (Koedsin and Vaiphasa 2013). In addition, basin mangroves in the Urías system show a clear seasonal pattern with respect to photosynthetic pigment contents (Flores-de-Santiago et al. 2012), since chla concentration in leaves from the lower part of the forest canopy increases during the dry season as a result of photoinhibition in the upper part of the canopy. It was thus not surprising to find that the 3 species in the basin mangrove forest showed a high degree of separation between the upper and lower parts of the forest canopy. On the other hand, it has been suggested that species in fringe mangrove forests do not show differences in photosynthetic pigment contents between the dry season and the rainy season (Flores-de-Santiago et al. 2012), which was confirmed by our study using only spectroscopic data. This lack of separation has been suggested by Panigrahy et al. (2012) for healthy mangroves in India, where significant differences (P < 0.01) were detected along the electromagnetic spectrum in 4 tropical mangrove species.
Our results indicate that the fringe mangrove samples can be categorized into a single class for the spatial analysis with satellite imagery because they did not show differences between the upper and lower parts of the forest canopy. By contrast, basin mangrove samples, especially those collected during the dry season, may show high variability when classified on the basis of satellite images. This pattern is particularly due to differences in the tolerance to environmental factors (hydroperiod), which depends on coastal geomorphology (Saenger 2002). For example, in the American continent, Rhizophora grows along tidal channels where tidal influence is greater, whereas Avicennia generally grows in elevated areas where the hydroperiod is shorter (Monroy-Torres et al. 2015). This pattern is different in Asia, where Avicennia generally grows along tidal channels, followed by Rhizophora (Saenger 2002), whereas Laguncularia tends to not withstand sudden salinity changes and is intolerant to hypersaline conditions (Ridd and Stieglitz 2002). Our results indicate that spectroscopic analyses must be carried out locally to characterize regions of interest within the electromagnetic spectrum. These regions will depend on the physiognomy of each mangrove species and could minimize discrimination errors when classifying mangrove forests using satellite and RPAS images.
According to our results for this study, it is possible to separate mangrove species in 2 physiognomic types during 2 season in subtropical regions. Future studies must assess the feasibility of data obtained from satellite imagery and RPAS images by performing discrimination tests between mangrove species using the green and red-edge wavebands at the forest canopy level. In addition, we suggest using these wavebands to determine physiognomic types in mangrove forests. A certain degree of error is expected to prevail when processing hyperspectral data from satellite and RPAS images, as this study did not consider additional factors such as leaf angle, tree density, basal area, leaf area index, and water reflection in the forest (Zhu et al. 2017). We also suggest exploring novel algorithms derived from automated learning methods, such as partial least squares regression or random forests, to classify mangrove species at the canopy level.

