Research
Numerical analysis of the cathodic material influence on the arc
plasma jet
D.F. Devia-Narváeza
*
L.F. Álvarez-Correab
S. Ramírez-Ramírezc
E. Restrepo-Parrac
aGrupo de Ecuaciones Diferenciales y
Aplicaciones, Universidad Tecnológica de Pereira.
bIDEXA, Escuela de Ingeniería Mecánica,
Universidad del Valle.
cPCM Computational Applications, Universidad
Nacional de Colombia, Sede Manizales.
Abstract
The cathodic arc discharge is a deposition technique widely used to synthesize
hard coatings and thin films. The structure of the plasma generated by the
electrical discharge and its interaction with neutral particles was studied
using numerical simulations. Typical plasma parameters were characterized
considering their spatial and temporal dependence, as well as several cathode
materials that are commonly used in these systems. For the evolution of the ion
density, it was observed the formation of Knudsen layer, and also a dependence
of pressure gradients in the global behavior. With respect to the kinetic
energy, it was found a deceleration of ions, which is represented by a shock
front produced in the plasma−neutrals interaction. On the other hand, the energy
releasing was generated due to the heat transference between electrons and ions.
The plasma potential follows a behavior, which is similar to that of the ion
density, and it is caused by the dynamics of charged particles which is directly
affected by the concentration of neutrals and ions. In general, the physical
quantities are directly affected by electrical and thermal conductivity of the
cathode material. Our results can be applied to understand the plasma phenomena
produced in a cathodic arc discharge.
Keywords: Arc discharge; materials processing; cathode material
PACS: 52.20.-j; 52.25.-b; 52.27.-h
1. Introduction
Industrial and technological development has increased the materials technology
demand, focused on increasing the performance of industrial pieces by improving the
behavior of its surface. The cathodic arc deposition is a process successfully used
for this purpose, due to its wide area of applications in hard and decorative
coatings [1,2]. The discharge process uses a power supply to generate an electric
arc between two electrodes of high current and low voltage, which is directed toward
a cathodic target. This target is usually the desired material to be deposited, as a
coating, onto a surface. As a result of the energy stream produced in the discharge,
a small a numerous discrete sites of high current density in the range between 1011 and 1013 A/m2 are formed on the target surface. This sites are called cathodic spots
[3]. In these spots, the electrical
heating causes a thermal evaporation of the material. In a properly deposition
system, this vapor can be condensed onto the substrate forming a hard coating. In
the discharge dynamics, a large fraction of the ion flux is directed toward the
anode; however, another percentage of this flux goes far from the interelectrode
region toward an empty zone between the electrodes and the chamber wall. As a
consequence, the increasing concentration of ions in this zone could generate an
electrostatic potential, which can drag electrons from the discharge region in order
to neutralize it, therefore, a plasma is produced. As for the plasma generated in
that region, few theoretical and experimental studies have been developed, since the
scientific community is focused on understanding the chemical and physical processes
taking place in the bulk region between the electrodes (discharge region) [4,5].
Nonetheless, some authors have studied the plasma structure in the surroundings of a
cathodic arc discharge.
The first studies of the gas-plasma interaction were carried out by Boxman and Goldsmith [6] using numerical simulations. They studied,
in the case of an arc in a low-pressure background gas, the balance between the
pressure of a surrounding gas and the momentum flux density formed by cathode-spot
plasma jet. Their theoretical model relates R, p, and I, following the relation R2p/I=constant scaling law. Despite the fact that their model reproduced favorably experimental
data, there were several unexplored mechanisms behind these processes. The
pioneering authors in this work are Kelly, Minotti, and Márquez. They have developed
both experiments and simulations of these phenomena. For instance, in numerical
simulation, Kelly et al. [7] started from a
stationary two-fluid model describing the region surrounding the electrodes of a
multi-cathode-spot vacuum arc. An important feature of the model was a prediction of
a voltage profile outside the electrodes, causing an acceleration of the ions arisen
from the discharge region. Nevertheless, that model did not include the interaction
between plasma and neutral gas; thus, a more realistic model was developed by Kelly
et al. [8]. They presented a stationary fluid
model to describe the interaction between metallic plasma ions with neutral
particles. Their results confirm the expansion mechanism in which the particles are
heated during the transient state of the metallic plasma proposed by Meunier et al.
[9]. Furthermore, the model predictions
about the behavior of plasma density, ion flux attenuation and electron temperature
were confirmed using electrostatic probe measurements by Grondona et al. [10] and Bilek et al. [11]. However, some corrections of that model were developed by
Kelly et al. [12], for instance, the
inclusion of metallic-ion recombination. A principal conclusion of that study was the
description of the ion slowing down by elastic scattering with neutral particles.
Some experimental measurements of plasma-gas interaction in the outer region of a
low-pressure cathodic arc were presented by several authors [13-17] confirming the
most relevant results from theoretical models described above. Minotti et al. [18] presented a more realistic model. They
developed a two-dimensional model in a cylindrical geometry, taking into account elastic
collisions, charge-exchange reactions, and the generation and recombination of gaseous ions
by electron impact. Experimental comparison has not yet been made to this model;
however, the profiles obtained along the radius are in concordance with those
determined by the models described above.
Despite the fact that theoretical models are approximately in good agreement with
experimental data, there are some questions about the influence of non-stationary
transition, and time dependence of the ions velocity distribution that are still not
solved. Gidalevich et al. [19] proposed a
hydrodynamic model for the plasma jet interaction with a neutral background gas.
They analyzed the isothermal gas motion and gas motion with energy transfer from the
ions to the neutrals during the initial non-stationary stage of a vacuum arc plasma
jet interaction with neutral gas. They found that the plasma front expands with
decreasing velocity and also, the neutral gas is accelerated by the plasma jet up to
supersonic velocity. Several models using two-fluid model and hydrodynamic
description have been developed, however, a complete study of the phenomena was not
clearly obtained. Thereby, in this work, we revisit the issue about interaction
between plasmas and neutral background gases in a cathodic arc discharge. We
employed a spherically symmetric fluid steady model developed by Kelly et al., [12] to describe the plasma-gas structure
generated in a low-pressure arc. In spite of the model considerations employed by
Kelly et al., we included the temporal dependence of the ion density in the ion
continuity equation, electron temperature in the electron energy balance equation,
and ion velocity in the conservation of ion momentum, which allowed us to obtain a
temporal dependence of ion density, kinetic ion energy, electron temperature and
electric potential. Also, the spatial, and temporal dependence of the plasma
behavior was characterized using numerical simulations for different cathode
materials that are commonly used in a cathodic arc deposition. The study of the
structure and state of the plasma around the cathodic arc discharge represents a
relevant step to understand the complete phenomena of mechanisms involved in
materials deposition. The generation of an electrostatic potential produced by the
plasma, and the interaction between metallic plasma and neutral gas, such as elastic
collisions and charge-exchange reaction, have a strong influence on the ion energy,
and ion flux distribution. For instance, Changji et al. [20] found that the energy of Zr (Zirconium) ions arriving at
the substrate decreases significantly with the deposition pressure. This effect
explains the fact that the adhesion decreases as the deposition pressure increases.
Other example is showed by Zhu et al. [21],
they found a preferred orientations of MgO (Magnesium oxide) films as a function of
pressure. They concluded that the increase of the background O2 (Oxygen) gas pressure results in a decrease in the kinetic energy of the
depositing metallic species. Therefore, the crystalline quality of the film
decreases with further increasing gas pressure. Another interesting contribution of
these studies is the determination of a base structure to study the atomic processes
happening in the discharge, which is a necessary step for the interpretation of
spectroscopic measurements in the cathodic arc deposition.
An outline of the paper is presented as follows: Sec. 2 shows the formulation of the
model; Sec. 3 describes the numerical simulation; finally, in Sec. 4, we summarize
our conclusions of the results.
2. Model Description
We present a set of equations that represent the spatio-temporal evolution of the plasma-arc plasma jet interaction during an arc discharge. The model has been
based on a previous model developed by Kelly et al. [12], which describes a steady state interaction between metallic plasma
and neutral gas. Nevertheless, we included the temporal dependence of the ion
density ni, electron temperature Te, and ion velocity vi. This modification, allows us to obtain the time and spatial dependence
of some plasma parameters as kinetic energy Ei, electrostatic potential ϕ the electron temperature Te, and ion density.
The model is applied to systems where multiple spots that enhance the cathode erosion
are produced. In most cases, arcs at low current produce a single cathode spot and,
as the current is increased, another cathode spots appear in a proportional way,
producing a plasma jet of high velocity that fills the whole interelectrode space
[9]. This plasma follows the
quasi-neutrality principle due to the small values of Debye Length, λD∼2×10⁻⁶ cm.
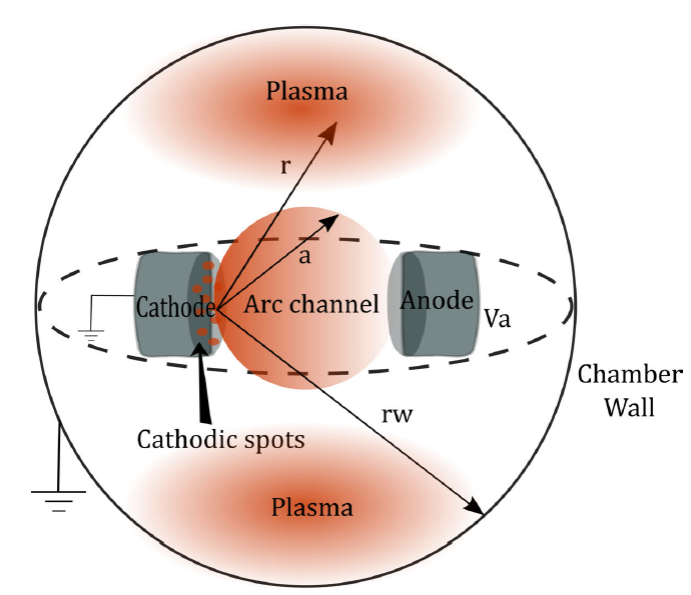
A geometrical scheme of the region, where the plasma is generated, is shown in Fig. 1 and it is represented by a spherical
discharge chamber containing two electrodes facing each other, whose walls and
cathode are grounded. The spherical symmetry consideration can be a suitable
approximation since the plasma flux and energy dissipation are expanding
spherically, which is in agreement with our own experimental results, as it is shown
in Fig. 2. This experiment was performed using
a titanium cathode with combination of Argon (Ar) and Nitrogen (N) gases, and it was
used as discharge parameters a direct current of 60 A, voltage of 270 V, and a pressure of 1.7 mbar. This result was corroborated by other authors using a cylindrical anode
with cathode placed at the center of symmetry [22]. Besides, the angular dependence θ,φ is neglected for simplicity of the model. Moreover, the other variables
of Fig. 1 correspond to the radius of the arc
discharge a, the chamber wall radius rw, and anode at voltage Va.
The model developed by Kelly et al. [12] is
based on two fluid theory and considers the density, momentum conservation and
energy equations for a given plasma species The physics behind the model is briefly
described. The Eq. 1 describes the ion
continuity and has the form:
∂ni∂t+1r2∂∂rr2nivi=-1zrσlossniviNn,
(1)
where vi is the ion velocity, zr is an average charge, Nn is a polynomial function obtained from Ref. [12], which represents the spatial evolution of neutral
particle density, and σloss=2×10-17 cm-2 is the cross section of the recombination produced by neutral-ion losses. The left terms of this equation represent the advection
effects of ion density ni and the right hand side corresponds to sink term.
On the other hand, the model contains the momentum conservation for ions, and it is
described as:
mi∂vi∂t+mivi∂vi∂r=-1ni∂∂rniTn-zre∂ϕ∂r+Rie-12mivi2Nn2mnmi+mnσin,
(2)
where ϕ is the electrostatic potential, mi and mn are the ions and neutral masses, respectively, e is the electron charge, Tn is the temperature of neutral particles, σin≈10-19\,m2 corresponds to the collision cross section for ions [23] and Rie is the collisional moment. Left hand terms correspond to inertial forces
in the plasma species, which are balanced by the sum of forces (right terms) acting
on the fluid motion. The expansion of plasma is governed by pressure gradients ∇p contained in the first right terms, and because the energy of particles
is small compared with kinetic energy, it is possible to approximate the plasma as a
perfect gas. In this way, the pressure can be written as p=nkBTe. Those pressure gradients are associated with changes in charge particle
densities which generate electrostatic potential gradients, represented in the
second right hand terms. The third right term of this equation represents the
frictional forces arising from the interaction between electrons and ions. Finally,
the fourth term is associated to the cross section of elastic collisions between
ions and neutral particles.
Moreover, following the same model and physical behavior for the momentum
conservation for electrons, it is obtained:
0=1ne∂∂rneTe-e∂ϕ∂r-Rei+meveNnTeme1/2σen,
(3)
where ne is the electron density, Te is the electron temperature, me is the electron mass, and σen≈10-20m2 corresponds to the collision cross section for electrons [23]. The left term of this equation is zero
because me is negligible compared to mi and mn. This is consistent because these transport processes occur in a
collision-dominated limit. Finally, Rie is constituted by combined ion-electron friction effects. Kelly et al.
[12] used in their model an expression
given by:
Rie=-zrRei=-1σe2zr2nivi+β∂Te∂r,
(4)
where β is the Braginskii’s thermoelectric coefficient.
Moreover, we consider the plasma in a quasi-neutrality state. Nevertheless, the cathodic emission produces several
ion species, giving as a result, differences in kinetic energy and ionization
degree. Then, for simplicity, we consider an unique ionic specie with an average
energy and charge. Also, the quasineutral condition in Eq. 5 determines the electron density ne as:
ne=zrni,
(5)
Finally, we included the energy transport equation, taking into account flows and
temperature equilibrium between species, and it is defined as:
32∂∂tneTe+1r2∂∂rr2qe=1σe2zr2ni2vi2-Te-Tnniνeq-32neve∂Te∂r,
(6)
where qe=-κe∇Te=-κe(dTe/dr) is the Fourier electron heat flux and κe is the electron thermal conductivity. Also, νeq=3/2δenvthσenNn, being vth is the electron thermal velocity, is the energy equipartition frequency
between electrons and neutrals, and δen∼10-5
[24] is a parameter that represents the
electron-neutral energy transference produced in a collision.
3. Results and Analysis
The results of the model are presented for a cathodic system operating in Ar gas
environment at a discharge pressure of 1.7 mbar. The selected cathode materials for simulations are Cu, Ti and Zr,
considering that these materials have been widely used for this type of processes.
The initial values and constants used for the materials are presented in Table I. These values were published by Anders
[25], and Gidalevich[23] for an arc discharge with similar characteristics of this
model. Also, we have used experimental values obtained by Grondona et al. [10] using a discharge current I=100 A, and discharge radius a=0.5 cm, providing an ion current Ir=10 A
[26]. The model proposed by Kelly et al.
[8] using the same set of parameters for
the numerical solution of this model, showed that the ion current losses were almost
total, giving as a result vea=via.
TABLE I Constants used for different materials and initial conditions for a
radius arc a = 0:5 cm .
| Cathode
material |
mi(g)
|
σscm
|
ke(Wm-1K-1)
|
zr(adim)
|
Te(a)(eV)
|
vi(a)scm
|
ϕ(a)(V)
|
| Cu |
1.05 × 10⁻²² |
1.16 × 10−41 |
401 |
2.06 |
3.5 |
1.32 × 10⁶ |
23.4 |
| Ti |
7.95 × 10⁻²³ |
8.84 × 10−42 |
22 |
2.03 |
3.2 |
1.54 × 10⁶ |
21.3 |
| Zr |
1.51 × 10⁻²² |
1.67 × 10−41 |
23 |
2.58 |
3.7 |
1.54 × 10⁶ |
23.4 |
An explicit finite differences numerical method was implemented to solve the set of
equations presented in the model [27].
According to the initial velocities presented in Table I, and radial step selected r=0.1 cm, a time step t=7.81×10⁻⁸ s was obtained. The first objective of the simulations is to find the
presence of a steady state in the solution. In Fig.
3a, the profile of the ion density ni is presented as a function of radius for different times for the case of
Cu. The initial density at a=0.5 cm was obtained using values presented in Table I, and equation for current density, j=enivizr. It can be seen, from the profile in Fig.
3a that, for t=7.8×10⁻⁵ s, a convergence is achieved in the simulation since the solution does not
differ because, it is seen from Fig. 3a that
both curves are not exactly the same; it means curves for t=5.4×10⁻⁶ s and t=7.8×10⁻⁵s are quite similar, indicating the presence of a steady state. In the
first interval 0.5≤r<0.7 cm, our results can be compared with profiles of the same quantities from a
steady model used in Ref. [7] and Ref. [28] obtaining a similar behavior.
In Fig. 3b, four intervals to study the behavior
of ion density are included as follows:
●Interval 1 (0.5≤r<0.7 cm): It is observed, a decrease in ni and a minimum at approximately r=0.7 cm. This behavior is an indication of a spatial charge which is
not in kinetic equilibrium (Knudsen layer) [29], since in this interval, the density is
composed by two flows.The first flow is composed by particles that are
evaporated from the electrode. The second one consists of atoms and
ions, which flow from the plasma to the surface of the cathode. The
difference in these flows is the variation in the kinetic energy Ei (Fig. 4). Thus, from r=0.7 cm, an increase in the flow of ions to the cathode surface
is observed.
●Interval 2 0.7≤r<1.6 cm: In the included region of this segment, it was observed
that as r move from a lower position to a higher one, ni increases. This increase is due to pressure gradients
accelerate the ions and enclose them in dynamic processes of the gas,
such as ion-ion or ion-electron collisions regarded in Eqs.1, 2 and 3. The
atoms are ionized by the electrons that are emitted by the cathode, as
well as by the plasma electrons with temperature Te (Fig. 5). This process
increases the ion density reaching a maximum value at a distance of 1.6 cm with respect to the cathode.
●Interval 3 1.6≤r<2.5 cm: In this segment the ion density starts to decrease because
of the recombination processes and the release of the electron energy.
Initially, electrons have a much higher average velocity than ions, and
therefore, they tend to flow out of the region of production much faster
than ions [25], attenuating their
temperature up to a length r≈3cm,higher than the attenuation length of the kinetic energy for
ions r≈1.4cm (Fig. 4 and 5).
●Interval 4 2.5≤r<6 cm: Finally, for this interval, the simulated densities of the
three materials converge to zero, which is in agreement with
experimental results obtained by Miyano et al. [30] where it is indicated that there is a slight
dependence on the type of material of the cathode on the bulk of the
plasma.
Concerning to the first interval, Grondona et al. [10] used a pulsed low- pressure arc operated with Ar gas filled at p=2 mbar and p=10 mbar using a Cu cathode. They obtained, from electrostatic probe
measurements, some values of floating potentials, and ion flux in the outer-region
of a pulsed low-pressure arc. The determination of ni was carried out according to Lam’s collisionless theory, having as a
result, in this interval, a decrease of ion density, which is in agreement with our
results. On the other hand, starting from the second and subsequent intervals, the
results of ion density and kinetic energy behavior were confirmed experimentally by
Zhu et al. [21]. They used a DC cathodic arc
operated at the arc current of 50 A, with Mg cathode, and O2 gas at pressures in the range of 0.7∼3.0 Pa. They found that the densities of Mg ions are strongly affected by the charge-exchange reaction, and deposition pressure. Also, they calculated the
velocities of ions according to vi=vi0+(2ui0/1+eαr), where vi0 is the velocity of the ion at r=0, and α is a factor which depends of pressure. In the second interval, they
attributed the increase of ion density to the exponential decay of velocity with r. Finally, in the third and fourth intervals, the velocity of ions
decreases with the further increase of r (Fig. 4b). Moreover, the charge- exchange reaction is the dominant factor, and in consequence, the
density of ions decreases as the radius increases.
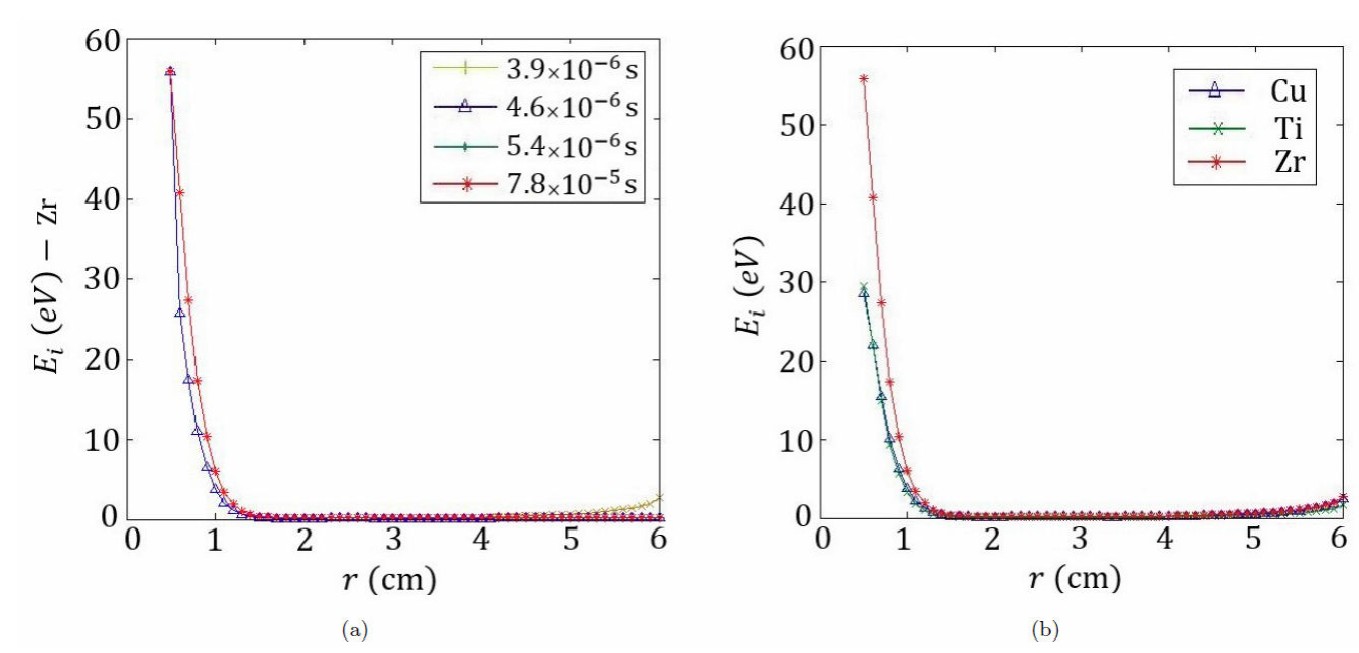
The Fig. 4a shows the variation of the kinetic
energy as a function of the radius at different times for Zr. A deceleration of the
ions in the interval 0.5≤r<1.5 cm is observed. This behavior is due to the shock front that occurs between
the metallic plasma and the neutral gas, abruptly reducing the energy of the ions by
elastic collisions, until an uniform mixture of these volumes is reached.
On the other hand, Fig. 4b shows the variation
of the kinetic energy as a function of the radius for the different materials at a
time t=7.8×10⁻⁵ s. From this figure, it is observed a considerable difference in the
energy valued of the three simulated materials at r=a. This is due to the cohesive energy of each material of the cathode,
which is the average binding energy of the atom in the solid. Zhu et al. [21] observed experimentally this phenomenon at
positions near to the cathode surface. They found a reduction of the ion velocity
which gives rise to a decrease in kinetic energy. These experimental results confirm
our profiles for ni, and Ei obtained in Fig. 3b and Fig. 4a with Zhu et al. observations. They also
concluded that, the reduction of velocity of ions along the radius and the
charge-exchange reaction can increase the density of ions, which is in agreement
with our simulations.
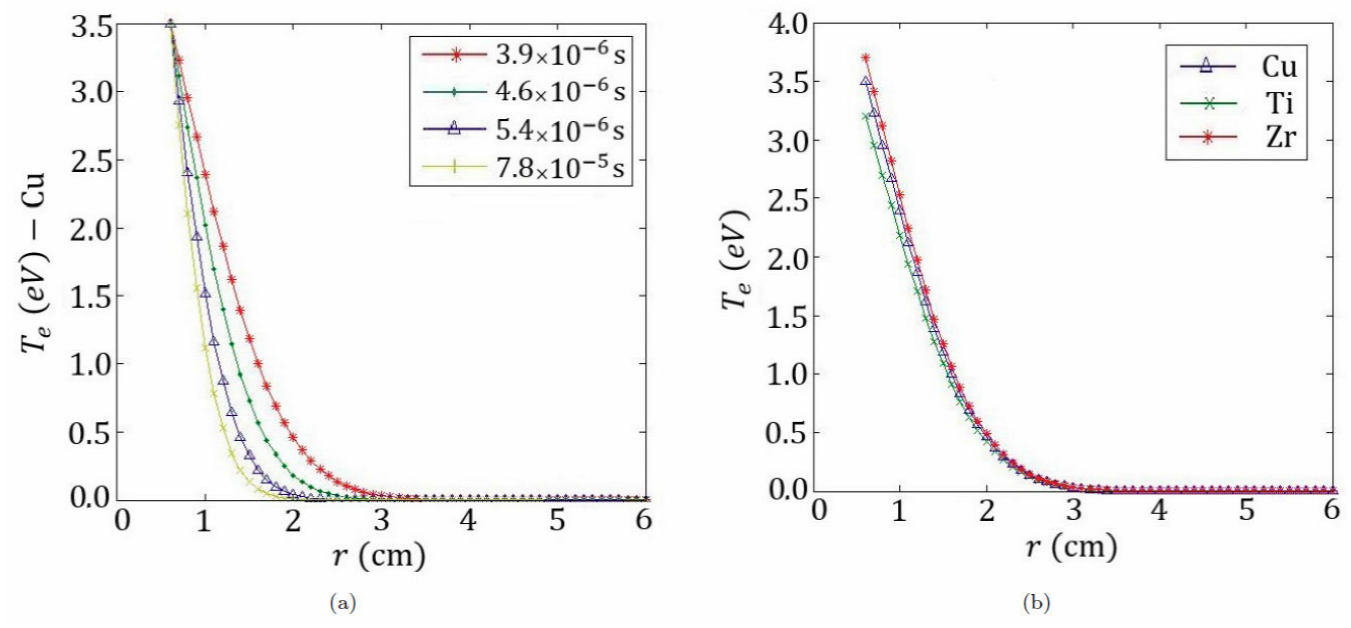
Figure 5a shows the evolution of the electron
temperature as a function of the radius at different times, for Cu. It is observed
that the electrons have yielded their energy for a radius less than 3 cm. The energy
released (heat) by these particles corresponds to the diffusion observed near the
electrodes, affecting the thermal or random velocity. On the other hand, the time
influence is observed, since in solving the system of equations simultaneously, in
each iteration, the calculation of the electron is updated until finding the non-uniform convergence for a time t=7.8×10⁻⁵ s.
Figure 5b shows the profile of the electronic
temperature Te, depending on the radius for the different materials at t=7.8×10⁻⁵ s. There is no appreciable influence of the cathode material on the
tendency of this variable, since the magnitude of the initial conditions of this
parameter does not present a significant variation, since this value is related to
the Joule heating. Consequently, it is also related to the current density, which is
the same in all simulations (the energy gained by the electrons in the discharge
comes from the Joule heating). Experimentally Grondona et al. [10] obtained, in the aforementioned experiment, at a pressure
of p=2 mbar, and r=1.75 cm, an electron temperature of Te=1.5±0.7 eV. Likewise, García et al. [16]
used a similar discharge device of Grondona et al. They generated the arc discharge
in an atmosphere of N2 at p=1.7 mbar of pressure using three different cathode materials (Ti, Zr, and Al).
Their studies gave as a result, values of electron temperature Te=0.88 eV for Zr, Te=1.16 eV for Ti, and finally Te=1.22 eV for Al. Additionally, both experiments confirm the decreasing tendency
of the electron temperature. Comparing both results, we can conclude that the
corresponding value, and the behavior obtained from the profile of our model
simulations are in agreement with those experiments.
In Fig. 6a, the potential of the plasma ϕ, as a function of radius for various times is presented. The trend of
this variable is similar to that of ni (Fig. 4). When a large peak of
charge concentration is formed around r=1.7 cm, a maximum value of ϕ is produced around this value of r (Hump Theory: at the cathode contour, a region is produced where the
potential is larger than that of the anode-cathode) [31].
In Fig. 6b three intervals are proposed to
describe the behavior of ϕ as follows:
Interval 1 0.5≤r<0.9 cm: It is observed a slight decrease; this is due to the
evaporation of electrons and ions produced by the bombardment of the
adjacent plasma. This leads to a non- stationary critical layer in the formation of the Hump
potential, because it is not associated with the production of ion front
to the cathode.
Interval 2 0.9≤r<2.5 cm: In this segment. As this dense metal plasma expands, the
protuberance of the potential travels with the ion front, and is
decomposed as the density of these particles decreases at the time that
the distance from the cathode increases, according to the considerations
presented in Fig. 4.
Interval 3 2.5≤r<6.0 cm: Finally, for this interval, the ion-electron drag and the electron-neutral moment transfer are much smaller than the electron
pressure, and the electrostatic force, which provides the enough force
to the ions for overcoming the shock front of the background gas,
allowing them to reach the chamber walls.
In a partially ionized plasma, several important elastic and inelastic processes can
simultaneously take place and they are responsible for redistributing the density,
momentum and energy of the particles [32].
The collisions considered in Eq. (1),
with the term -mivi2Nn(mn/mi+mn)σin, imply a moment exchange driven by the extreme pressure gradient, while
the dissociative recombination processes included in Eq. (1), with the term (-σlossr2niviNn/Zr), depend on vi; therefore, there is a decreasing on the ions density, when they have
yielded their energy (Fig. 4).
Concerning to cathode material dependency on the plasma variables. An experimental
result is consistent with our simulations. In this study, Miyano et al. [12] using different cathode materials, and
ambient gases, found that the cathode material does not affect directly the arc
voltage behavior. They attributed this behavior due to the diameters of Ti, Cu and
Zr atoms are similar (0.28, 0.27 and 0.31 nm, respectively), so that the collision
cross-section between these metal ions and the gas molecules is not varied.
Therefore, the ion deficiency forms at a similar pressure, and thus the flux emitted
from the cathode changes at a similar pressure.
4. Conclusions
In this work, using numerical simulations, we have studied the plasma state generated
by the interaction of a cathodic arc discharge and neutral particles. Taking into
account the model developed by Kelly et al. [12]. We solved the system of equations to study the behavior of typical
plasma quantities as a function of time, and distance from the cathodic region.
Furthermore, we considered different cathode materials that are commonly employed in
cathodic arc deposition. A decrease in the first stages of the evolution of the ion
density was observed due to formation of Knudsen layer, which is represented by
differences in kinetic energy between neutrals and ions; an increasing in later
stages is due to pressure gradients accelerate the ions and enclose them in dynamic
processes of the gas; at final stages, the ion density exhibited a decreasing trend
following approximately Boltzmann relationship. The kinetic energy presented a
deceleration. This behavior is due to the shock front that occurs between the plasma
and the neutral gas, reducing the energy of the ions by elastic collisions, until a
volume equilibrium is obtained. Regarding to the electron temperature, it was found
that energy transference between electrons and ions is very low and is released as
heat by these particles, which corresponds to the diffusion that they present near
to the electrodes, affecting the thermal velocity. Moreover, the electric potential
follows the same behavior of ion density, as expected. When a large concentration of
particles is formed, a maximum value of potential is located in this zone;
subsequently, the decreasing is controlled by electron pressure gradient because of
the friction force between electrons and ions. Nonetheless, it is a fact that there
is a small dependence on the cathode material. This is considered to be due to not
only the size of the ions, but also their average charge, energy, and density. In
spite of this result, it is suggested further investigations for qualitative and
precise understanding. It is important to highlight the importance of these studies,
due to the possibilities to guide experimental studies, where the objective is to
obtain data about the structure of the cathodic arc discharge. Finally, the behavior
of the electron temperature, ion density, and ion kinetic energy are in agreement
with arc discharge experiments performed by different authors, giving rise to the
reliability of the employed model.
Acknowledgments
We gratefully acknowledge the support of COLCIENCIAS via the Jóvenes Investigadores e
Innovadores 2016 program, under the project No.077-2017 (206010014290) “Modelamiento
teórico y desarrollo computacional de plasmas de laboratorio empleados en el
procesamiento de materiales” and COLCIENCIAS Doctoral program Convocatoria 727 de
2015. We also give thanks to Universidad Nacional de Colombia and The Dirección de
Investigación DIMA for its support.
References
1. D. S. Galeano-Osorio, S. Vargas, R. Ospina, E. Restrepo, and P.
Arango DYNA, 81 (2014) 94,.
[ Links ]
2. J. M. Albella, Introducción a la ciencia de materiales: técnicas
de preparación y caracterización. CSIC Press: Madrid, (1993).
[ Links ]
3. L. García, D. Escobar, J. De la Roche, P. Arango, and E. Restrepo
DYNA 79 (2012) 90.
[ Links ]
4. H. Kelly, F. Minotti, A. Márquez, and D. Grondona, Meas. Sci.
Technol. 13 (2002) 623.
[ Links ]
5. D. Grondona, H. Kelly, and F. Minotti, J. Appl. Phys. 99 (2006)
1.
[ Links ]
6. R. L. Boxman and S. Goldsmith IEEE Trans. Plasma Sci 18 (1990)
231.
[ Links ]
7. A. Márquez, F. Minotti , and C. F. Fontán, J. Phys. D: Appl.
Phys. 31 (1998) 1737.
[ Links ]
8. H. Kelly, A. Márquez, andF. Minotti , IEEE Trans. Plasma Sci. 26
(1998) 1322.
[ Links ]
9. J. L. Meunier and M. G. Drouet, IEEE Trans. Plasma Sci. 15 (1987)
515.
[ Links ]
10. D. Grondona , H. Kelly, A. Márquez, and F. Minotti , J. Phys. D:
Appl. Phys. 31 (1998) 3358 .
[ Links ]
11. M. M. Bilek, P. J. Martin, and D. R. McKenzie, J. Appl. Phys. 83
(1998) 2965.
[ Links ]
12. A. Lepone, andF. Minotti , J. Appl. Phys. 87 (2000)
8316.
[ Links ]
13. H. Kelly, A. Lepone, and A. MárquezJ. Appl. Phys. 89 (2001)
1567.
[ Links ]
14. D. Grondona , H. Kelly, A. Márquez, F. Minotti , and J.
Zebrowski IEEE Trans. Plasma Sci. 28 (2000) 1280.
[ Links ]
15. A. Lepone and H. Kelly, J. Phys. D: Appl. Phys. 34 (2001)
3043.
[ Links ]
16. A. Pulzara, A. Devia, andE. Restrepo , J. Vac. Sci. Technol A 23
(2005) 551.
[ Links ]
17. L. A. García, E. Restrepo , H. Jiménez, H. A. Castillo, R.
Ospina , V. Benavides, and A. Devia Vacuum 81 (2006) 411.
[ Links ]
18. F. O. Minotti, H. Kelly, and A. Lepone, Plasma Sources Sci.
Technol. 11 (2002) 294.
[ Links ]
19. E. Gidalevich, S. Goldsmith, and R. L. Boxman J. Appl. Phys. 90
(2001) 4355.
[ Links ]
20. H. Changji, H. Zhenhui, F. Weichun, and Z. Qi, J. Phys. D: Appl.
Phys 42 (2009) 185303.
[ Links ]
21. D. Zhu, C. Zheng, D. Chen, and Z. He, Plasma Sci. Technol 15
(2013) 1116.
[ Links ]
22. B. Juttner J. Phys. D: Appl. Phys. 14 (1981)
1265.
[ Links ]
23. E. Gidalevich Plasma Sources Science and Technology 10 (2001)
24.
[ Links ]
24. P. R. Yuri, Gas discharge physics. Springer: Moscow,
(1997).
[ Links ]
25. A. Anders, Cathodic Arcs: From Fractal Spots to Energetic
Condensation. Springer Series on Atomic, Optical, and Plasma Physics, Springer:
New York, (2008).
[ Links ]
26. C. W. Kimblin J. Appl. Phys. 45 (1974) 5235.
[ Links ]
27. S. C. Chapra and R. P. Canale, Numerical methods for engineers.
McGraw-Hill Higher Education: Boston, (2006).
[ Links ]
28. S. Ramírez, D. Sabogal, D. F. Devia, andE. Restrepo , DYNA 85
(2018) 76.
[ Links ]
29. I. Beilis IEEE Trans. Plasma Sci. 35 (2007)
966.
[ Links ]
30. R. Miyano, T. Saito, K. Kimura, M. Ikeda, H. Takikawa, and T.
Sakakibara, Thin Solid Films 390 (2001) 192.
[ Links ]
31. H. C. Miller J. Appl. Phys. 52 (1981) 4523.
[ Links ]
32. V. L. Paperny, A. Chernich, N. Astrakchantsev, and N. Lebedev,
J. Phys. D: Appl. Phys. 42 (2009) 155201.
[ Links ]


 text new page (beta)
 English (pdf)
 Article in xml format
 Article references
 Send this article by e-mail
 Cited by SciELO
  Similars in
SciELO
Similars in
SciELO 
 Permalink