text new page (beta)
 English (pdf)
 Article in xml format
 Article references
 Send this article by e-mail
 Cited by SciELO
  Similars in
SciELO
Similars in
SciELO 
 Permalink
Introduction
The Brazilian economy has presented a sluggish economic performance in the last few years. Currently the country is suffering a deep output contraction; a recessionary phase followed by rising prices.
In this context, ‘developmentalism’ is a school of economic thought that has suggested policies to overcome the crisis. Developmentalism has many branches. Two of them are the ‘new developmentalism’ and ‘social-developmentalism’. They have suggested different policies to stimulate the economy. The former claims that exchange rate devaluation would pave the way to foster growth. Bresser Pereira (2007, 2011), Oreiro (2012), and Oreiro, Basilio, and Souza (2014) represent this group. The latter argues that redistribution toward the poor is crucial to stimulate the domestic market and trigger growth. Bastos (2012) represents social-developmentalism. (For further discussion, see Amado and Mollo, 2015).
Arguably a profound knowledge about the productive structure would help to shed light on sectors that can boost the economy. However, most of the researchers have paid scant attention to mesoeconomics. In other words, in these proposals lacks a study of the role of sectors to trigger the economy. Each sector has specific features that should be included in the analysis.
In this paper, we built the input-output (I-O) matrix for Brasil for 2013 and applied the Dietzenbacher (1992)’s eingenvector methodology to rank the sectors in terms of their ‘power of pull’ (or backward linkages). We employed the well-known methodology proposed by Guilhoto and Sesso (2005) to construct an I-O matrix from the National Statistical Accounts. Having this matrix, we estimate interindustry linkages, giving further information about sectors’ power to pull the economy out of the recession. Following Luo (2013, p. 158), we define power of pull as the sectors’ capacity to pull all the activities through their networks. Sectors’ size and networks matter in determining the effect of one sector on the rest of the economy. The linkage indicators provide a measure of the total amount of inputs required from the activities to produce one additional unit of final demand, including the network effect. The paper also investigates the structural tranformation of the Brazilian economy from 2010 to 2013.
The eigenvector method presents some advantages in comparison with conventional methods such as the Rasmussen and Hirschman linkage indicators. The advantages are related to its sensitivity to structural transformation, capability to find clusters of activities, and it gives a powerful measure of interactivity linkages. Specifically in this regard, this method gives a larger weight to the inputs from an activity presenting high backward linkage than otherwise, representing an efficient procedure to measure interindustry linkages.
The structural sequencing of the rest of the paper is as follows. Next, we overview the Brazilian economy during the 2000s. We present a brief review of techniques to measure backward linkages in Section 2. In the following section, we present the eigenvector method. The remaining two sections exhibit results and conclusions.
The Brazilian economy in the 2000s: A brief overview
The Brazilian economy has grown vigorously since the middle of the 2000s. Between 2004 and 2010, per capita Gross Domestic Product (GDP) rose by 2.8% per year, even after the effects of the international financial crisis of 2008. However, despite recovering a certain degree of dynamism, the country grew slower than in 1950-1973 (United Nations, 2010).
The international context up to 2008 contributed to the economic results reached in Brazil. The global economy grew substantially, mainly driven by China and India. In the early 2000s, Brazil benefited from rising exports and increasing international prices. Brazil became less prone to international crises, receiving large amount of net direct investment. When the international crisis unfolded, Brazil had international reserves and the capacity to employ countercyclical policies.
A crucial feature of the expansion was the development of the domestic market, containing three central measures. Firstly, the Brazilian government adopted a plan to stimulate economic development. The Growth Acceleration Plan (PAC) represented the recovery of the State’s role in planning, coordination of public investments and cooperation with private firms.
Secondly, government applied redistributive policies, such as the Bolsa Família, a family subsidy programme, and real increases in the minimum wage, boosting consumption and triggering the economy. As a result, an improvement in the income distribution has emerged, with the Gini coefficient dropping from 0.61 in 1990 to 0.54 in 2009 (IPEA, 2011).
Thirdly, the rise of credit supply from the financial market was important, with the State-owned banks leading the process. The amount of credit in relation to GDP surged considerably from 2000 to 2010 (Morrone, 2015b; Marquetti, Hoff, and Miebach, 2017).
The domestic-market-led expansion policy lead to a drop in the unemployment rate. The rise in formal employment was essential to guarantee political and social stability. Moreover, reducing inequality can stimulate growth, for two major reasons. Firstly, it improves people’s nutrition, translating into labour productivity gains. Income redistribution diminishes poverty, having positive effects on health and education (Deaton, 2003), supporting further increases in labour productivity. Secondly, it is easier to reach consensus to implement reforms in egalitarian economies.
Despite the growth experienced, the persistent exchange rate overvaluation started to damage industry’s performance. To keep momentum, the government gave tax cuts to the automotive sector and promoted incentives for agglomeration. The development model achieved its limit by 2014. After 2014, the Brazilian economy began slowing down. In 2015, Brazil entered into a political and economic crisis followed by a recession, with the collapse of private and public investment. There is no clear sign that the economy will overcome the crisis soon.
Ranking sector’s linkages: A brief review
In the input-output literature, key sectors are defined as sectors that present high and above average backward and forward linkages. Several criteria were developed to investigate the importance of activities to engender economic expansion. Firstly, the simpler method ―based on the Leontief’s contribution― involves the sum of lines of the coefficient matrix A to assess backward (direct) linkages. It represents a measure of the total input required directly to produce one unit of output. Further extensions employed the Leontief inverse matrix to give the total effect. The sum of the rows of this matrix gives the direct and indirect (total) inputs needed as a result of the increase of one unit of final demand. Moreover, there are plenty of more sophisticated methods: fields of influence (Hewings et al., 1989), triangulation (Korte and Oberhofer, 1971), hypothetical extraction (Schultz, 1977), and eigenvector method (Dietzenbacher, 1992). The latter presents an advantage since it gives a higher weight to inputs from sectors with high backward linkage indicators. It is an iterative method, connected to networks. Here, we are interested in the eigenvector procedure only. Now lets provide a brief introduction about the backward and forward linkage indicators and review few studies that applied the eigenvector technique. Our focus here is on the backward linkage indicator.
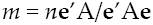
One important and well-established method to find direct bacward linkage indicators was developed by Chenery and Watanabe (1958). They worked with the coefficient matrix A. As before, the row sums indicate the total amount of inputs directly required to produce one additional unit of output. Mathematicaly, it is represented by the left pre-multiplication of the A matrix by a unitary vector. The weighted Chenery and Watanabe (1958) direct backward linkage index (m) can be expressed as:
 [1]
[1]
Where n is the number of sectors in the economy; e’ stands for a row summation vector (e i = 1 for all i), A is the input coefficiente matrix, and e is the column summation vector (e i = 1 for all i).
Rasmussen (1956) worked with the Leontief matrix to design an index of backward linkages. Its index exhibits how much the output (direcly and indirectly) of the economy should grow to match an increase in demand in one specific sector. It is represented by the row sums of the Leontief matrix. The total (indirect plus direct) Rasmussen backward linkages indicator z can be exhibited as:
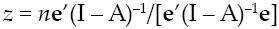 [2]
[2]
Where (I - A)-1 is the Leontief matrix.
Conversely, the forward linkage indicators are calculated as a sum of each column in the Leontief matrix. They show how much a sector will produce (directly and indirectly) when the demand of all sectors increases by one unit. Overall, key-sectors present high backward and forward linkages (above average). Here again, our focus is on power of pull so we intend to look at backward linkages only. Our concern is to investigate sectors’ power to pull the economy out of the recession.
Now that we have sketched the basic features of backward linkages, we can proceed reviewing some studies that apply the eigenvector method. Firstly, Dietzenbacher (1992) measured interindustry linkages for The Netherlands from 1948 to 1984 to rank economic sectors. He shows that using the eigenvector procedure researchers can find robust estimations of backward and forward linkages. Moreover, this method is able to detect structural change and to find clusters of producers. Dietzenbacher shows the method’s superiority in comparison to well-established procedures such as the Chenery and Watanabe (1958) and the Rasmussen (1956) method.
Another empirical paper that employes the procedure is Luo (2013). He analyses the input-output data for United States (U.S.) during the 1998-2010 period. His goal was to rank the sectors that should be first bailed out in the U.S. economy. He also applied a conterfactual analysis to verify if the government stimulated the right sectors during the great recession of 2008/2009. His results underscore the necessity to bail out the mothor vehicle sector, but it does not support bailing out public infrastructure, health care, computer and electronics, and service sectors. Overall, the author seems sckeptical concerning the policies adopted by president Obama.
Other studies concentrate the analysis on inter-industry linkages for regional input-output (I-O) tables. In particular, Midmore, Munday, and Roberts (2006) assess industry linkages through the Welsh Financial I-O Matrix. They employed Dietzenbacher (1992)’s method, finding different ranks for sectors according to each method applied. Their results underscore the importance of employing efficient techniques to capture inter-industry linkages, supporting regional planning.
Data and methodology
This section describes Dietzenbacher (1992)'s eigenvector method. The source of statistical data comes from the national statistical accounts of the Instituto Brasileiro de Geografia e Estatística (IBGE, 2011). Because we have only the official I-O table for 2005, the input-output table was derived from national statistical accounts for 2013.1 The Resources and Uses table (containing 107 commodities and 51 activities) provides the complete information needed to construct the I-O table. Specifically, we employed the Resources and Uses Table to built the input-output (I-O) matrix following Guilhoto and Sesso (2005). The input-output table for Brazil contains 51 sectors.2 For more details, see Morrone (2015a).
The eigenvector method
The Dietzenbacher’s method represent an infinite iterative procedure to measure and rank intersector backward and forward linkage indicators. The method addresses the infinite iterative process of power of nodes in networks (Luo, 2013, p. 160). Here, I borrow notation from Luo (2013).
The procedure can be presented as follows. Firstly, suppose r i stands for the vector of backward linkage indicators of the activities of the economy. Next, the vector r i + 1 through an iterative procedure is updated as the summation of linkages (columns of the input coefficient matrix A) and it is weighted by the normalized r i from the previous iteration. It makes sense to give a larger weight to the inputs of the activities with high backward linkages than the inputs from a sector with a smaller one. The indicators are normalized (to show an average of 1), and can be expressed as:
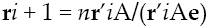 [3]
[3]
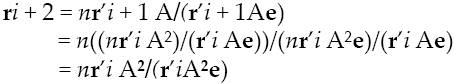 [4]
[4]
Where n stands for the total number of activitities and e is the column summation vector (e i = 1 for all i). The estimation of power indicators is improved through iterations to infinitum (i→∞). Generalizing equations [3] and [4] through a sequence of iterations (k-steps-ahead), we obtain:
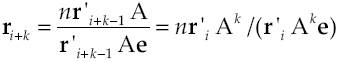 [5]
[5]
Dietzenbacher (1992, p. 420) shown that the outcome of the procedure converges to the normalized left hand eigenvector which corresponds to the dominant eigenvalue (the Perron vector) of the matrix A. The weighting vector is estimated as n q’/(q’e) with q’A = λq’ [4]. Where q’ represents the dominant eigenvalue of A. As a conclusion, the elements of n q’/(q’e) reveal the power of sectors to pull the activities of the whole economy.
Note that the power of pull (r i) is independent on the original weighting vector employed. It means that the weighting vector might be chosen arbitrarily in the first iteration. Moreover, taking the final weighting vector into both equations [1] and [2] implies that the Chenery-Watanabe (C-W) index and the Rasmussen index are identical.
In summary, the eigenvector method considers both inter-sector linkage weighting and infinite iterative process to capture the influences towards the whole economy. For further information about this method, its superiority, and mathematical derivation, see Dietzenbacher (1992). Next, we employ this procedure to measure and to rank inter-industry backward linkages for Brazil for 2013.
Results
This section reports on the results of the sector’s backward linkage indicators. It serves as a proxy of the power of pull of the entire economy, revealing sectors that should be bailed out first during a recession. We rank them according to their capacity to boost economic activity, leading to a robust recovery. Here the purpose is threefold and displayed in the following tables. Firstly, we compare the results of the C-W linkage with the Rasmussen index and the eigenvector’s method result. Next, the outcome of the eigenvector method is analyzed. Then, we follow the ranked sectors from 2010 to 2013 and discuss them in the context of Brazil.
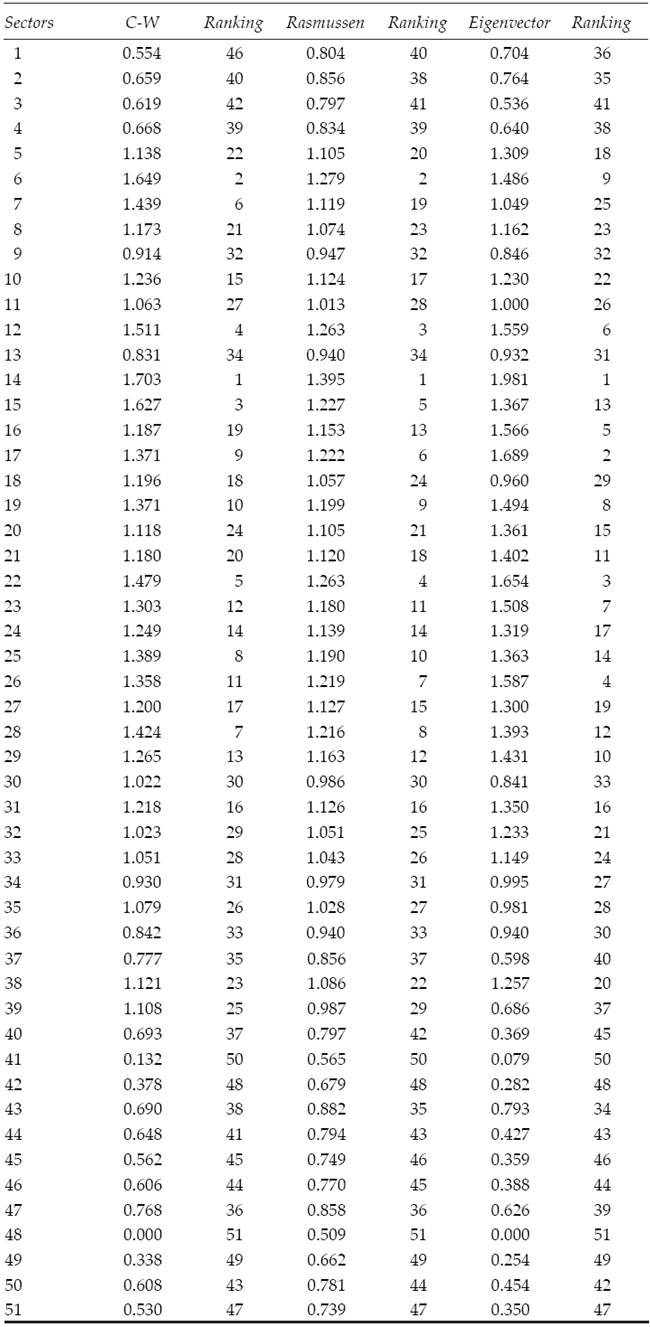
Table 1 exhibits the values and rankings of the 20 sectors with the highest C-W backward linkages and the Rasmussen and eigenvector indicators for 2013. Results for the 51 sectors are in the Appendix. At the top of the table is Petroleum refining and coke (14) sector, followed by food and beverages (6), Alcohol (15), and pulp and paper products (12). These sectors have potential to support the recovery.
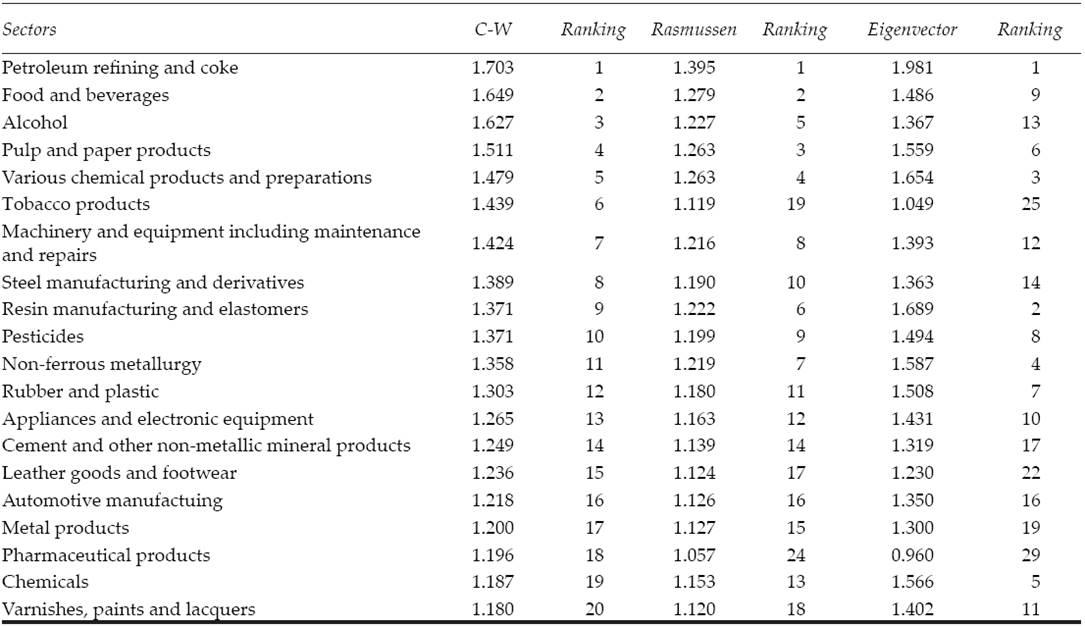
However, a closer look at the numbers reveal that they might be misleading. The Rasmussen index presents a different sector ranking. For instance, pulp and paper products (12) presents the fourth highest score in the C-W method, but it is the third in the Rasmussen index. In addition, sector 24 appears among the top 20 using only the Rasmussen index. For the top 20 sectors in the C-W method, we found a Pearson correlation coefficient of 79.67% in terms of rank. In conclusion, the results, although close, show some divergence. The high correlation for C-W and Rasmussen indicators found, shows that there is not much difference between the two methods.
Turning now to the eigenvector’s elements, we see that the divergence becomes deeper. If we compare the correlation between C-W and the eigenvector method, the Pearson correlation coefficient takes the value of only 47.64%. Looking at rank, it drops to 38.37%. For example, chemicals (16) is only the nineteenth highest C-W score, but it is the fifth using the eigenvector method. This sector has medium size, but it is powerful to stimulate the rest of the economy through the network. It suggests that the C-W procedure takes into account the size of the sector only, implying crucial negative consequences for planning. These results are similar and in line with Dietzenbacher (1992), Midmore, Munday, and Roberts (2006), and Luo (2013).
Last but not least, the Rasmussen index and the eigenvector indicator revealed modest Pearson correlation coefficients. In a nutshell, it underscores the importance to estimate key sectors employing efficient methods that detect network power.
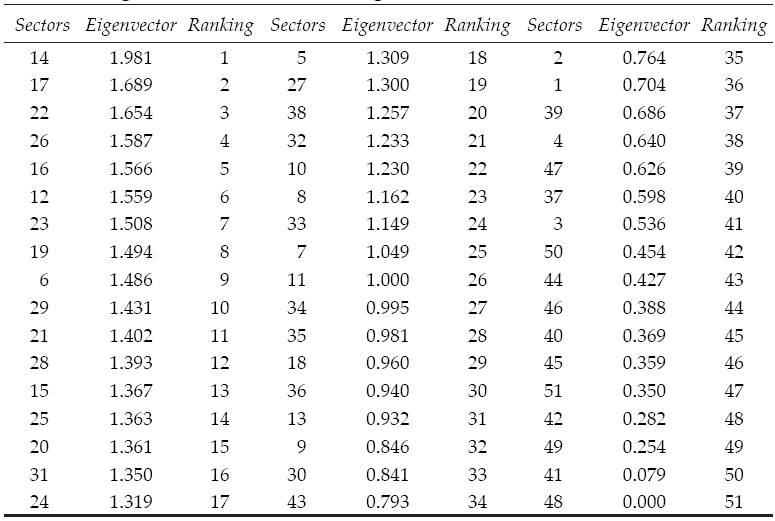
Table 2 shows the elements with the largest backward linkages in Brazil using the eigenvector method. Five sectors are crucial to pull the economy: petroleum refining and coke (14), resin manufacturing and elastomers (17), various chemical products and preparations (22), non-ferrous metallurgy (26), and Chemicals (16). They are the ones to stimulate during a recession. This serves as an input to guide development policies.
Table 2 Top 20 eigenvector backward linkage indicators for Brazil for 2013
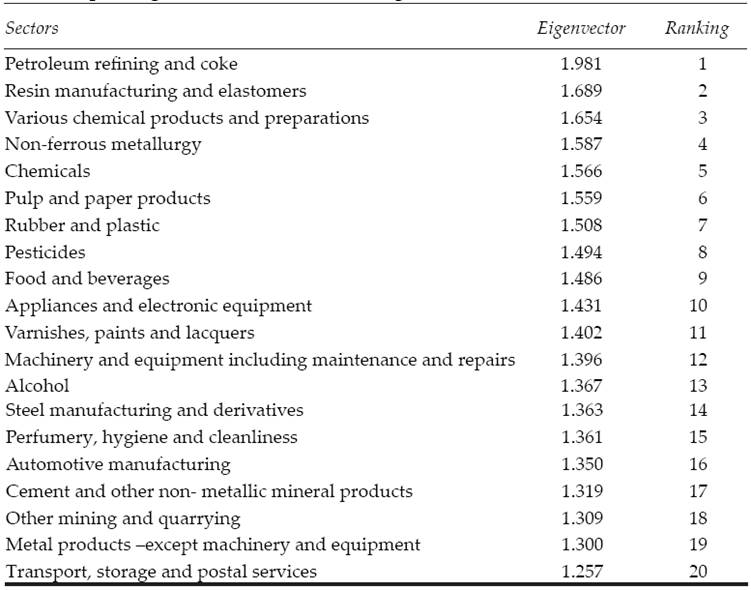
Source: Author’s estimations.
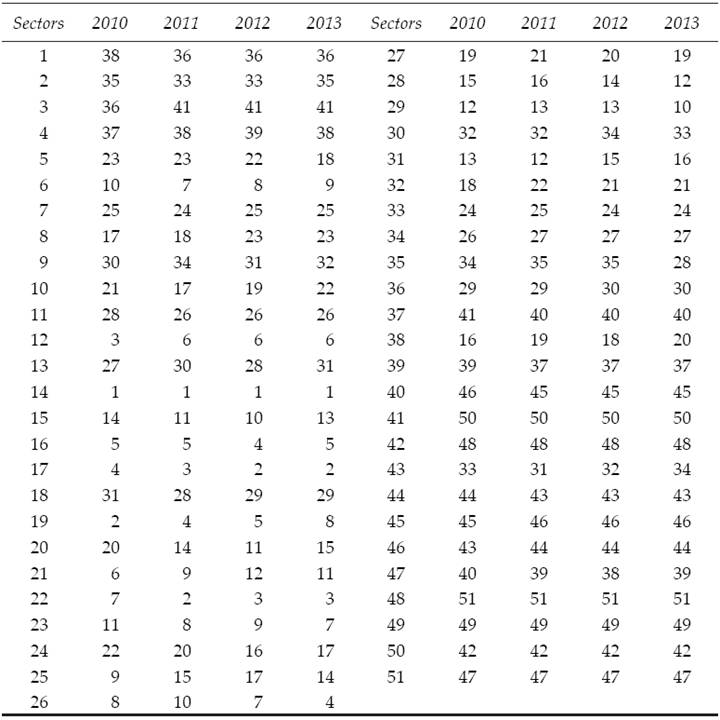
Finally, Table 3 depicts the eigenvector indicators for the top 20 sectors in 2010 and follows them from 2010 to 2013. The results for the 51 sectors are in the Appendix. They serve as a proxy for the structural transformation of the Brazilian economy. Here, the statistics exhibit a substantial structural change. Sector 19 for instance, occupied second place in 2010, dropping to eighth in 2013. Across the board, sector 14 delivers the highest results. Other important sectors are resin manufacturing and elastomers (17) and various chemical products and preparations (22). Taking the average and ranking the elements of Table 3, the five most important sectors in the period are petroleum refining and coke (14), resin manufacturing and elastomers (17), various chemical products and preparations (22), chemicals (16), and pesticides (19).
Table 3 Ranking eigenvector backward linkage indicators for Brazil from 2010 to 2013
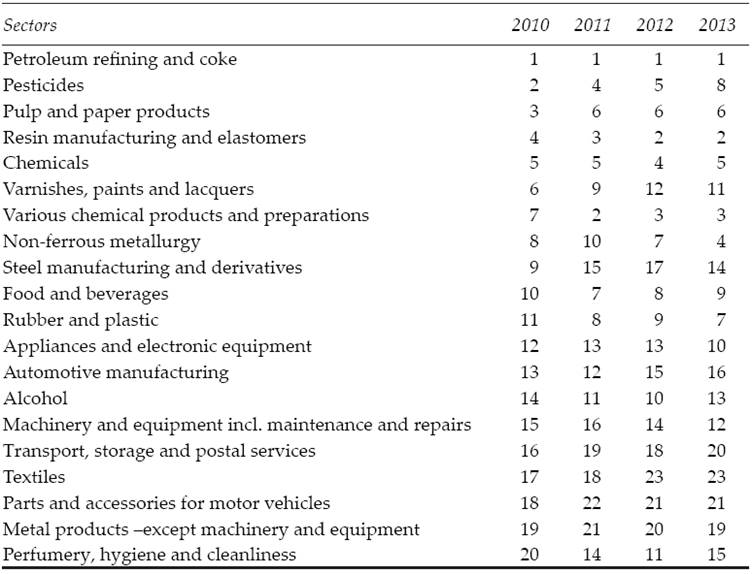
Source: Author’s estimations.
Pesticides (19), pulp and paper products (12), varnishes, paints and lacquers (21), steel manufacturing and derivatives (25), and automotive manufacturing (31) all showed a continous decline in network power to increase output of the economy between 2010 and 2013. Food and beverages (6) and chemicals (16) are relatively stable over the period. Notice the absence of traditional agriculture sectors in Table 3.
Moreover, construction, a traditional sector, reveals limited capacity to pull the economy out of the recession in the short/medium term. Other sectors like automotive manufacturing (31) exhibited a modest power to stimulate the economy, although its size is relevant. Despite the results found by Luo (2013) for U.S. that automotive manufacturing is central to the recovery, our estimations suggest the contrary for Brazil. The automotive sector presents a limited capacity to foster a sustainable recovery. Information services (39) and financial intermediaries (4) also have little influence in triggering economic activity. Except for the automotive manufacturing, our results are similar and in line with Luo (2013). For details, see Table A3 in the Appendix.
Overall, the results underscore the importance of the chemical industry and connected sectors. This outcome is supported by previous studies, e.g. Guilhoto et al. (1994), that stress the pivotal role of the chemical industry to boost economic output. They found that the chemical sector and related activities present large input-output multipliers for Brazil. An older study by Prado (1981) reached similar conclusions.
Prebisch (1959) and Kaldor (1966) are some of the pioneers who argue for industry as an engine for economic growth. More recently, Rada and Taylor (2006) and Roncolato and Kucera (2013) point out that the manufacturing sector acts as an economic driver to boost growth.
Our estimations suggest that chemical and petrochemical industries represent an important cluster in Brazil. The Government’s Investment Support Programs to finance investment of private firms and the investment of the state-owned Petróleo Brasileiro (Petrobras) in the exploitation of new offshore oil reserves, contributed substantially to stimulate this sector. With the political and economic crisis that unfolded, Petrobras dropped its investment by a third between 2013 and 2015 (Marquetti, Hoff, and Miebach, 2017). This process of decreasing investment and its negative impact on the rest of the economy lead to the decline in output. In this sense, it is paramount for the government to design policies to promote drivers of economic activity. In Keynesian fashion, the Brazilian government must intervene to foster an economic recovery. Lack of government intervention during a crisis, only make things worse.
Nevertheless, the results should be interpreted around the benchmark year (2013) since this is the lattest official statistic available to build the I-O matrix. Extensions of the results to the current period should be interpreted with a grain of salt. In the absence of a profound change in the Brazilian economic structure, then the top sectors in Table 3 need to be stimulated.
The results suggest therefore that traditional sectors have a limited power to foster economic activity. The government’s strategy should focus on sectors with large backward linkages to rapidly overcome the recession. Simple policies of expanding credit supply and giving tax cuts to the automotive manufacturing sector might not function this time. It seems unlikely that the recovery will come from agriculture either.
Conclusion
This paper has applied the Dietzenbacher (1992)’s eigenvector method to rank sectors according to their power to pull the Brazilian economy out of the recession. This innovative method can shed light on the discussions about which sectors should be stimulated during the crisis. We have built a recent 2013 I-O matrix to compute the backward linkage indicators.
The results indicate that five activities are key to stimulate the economy: petroleum refining and coke, resin manufacturing and elastomers, various chemical products and preparations, non-ferrous metallurgy, and Chemicals. These results are crucial as a guide for development policies. Traditional sectors do not exhibit high scores. In particular, construction and automotive manufacturing show a poor and modest performance respectively. It suggests that to overcome this recession requires other policies and incentives for different sectors.
The results thus show that governement policies must emphasize strategic sectors. Like the ones displayed in Table 3. Taking extreme measures becomes vital to fight this recession. The tradicional macro development models pay scant attention to mesoeconomics. In this vein, the paper provides a mesoeconomic perspective to tackle Brazil’s problems.