


 text new page (beta)
 English (pdf)
 Article in xml format
 Article references
 Send this article by e-mail
 Cited by SciELO
  Similars in
SciELO
Similars in
SciELO 
 Permalink
Introduction
Trade between the United States and Mexico encompasses a great variety of goods and services. One of the main characteristics of that trade is the large share of intra-industry trade, concentrated mainly in the automobile industry, electronics, and telecommunications. Also, the size of the economies, together with the development of value chains emerging from vertical foreign direct investment (FDI) and transportation costs in the manufacturing sector have been important sources of regional economic integration between the two countries.
The establishment of the North American Free Trade Agreement (NAFTA) was a factor in promoting trade and investment among the member countries. Specifically, NAFTA gradually reduced the tariff structure and established rules of origin for input content in the North American region, as well as rules for the protection of foreign direct investment. The effects of the establishment of NAFTA have been extensively studied.
Regarding the effects of NAFTA on trade among the three countries, the rapid increase in trade and the growing importance of trade from Mexico and Canada in total trade with the United States stand out. Likewise, it is noteworthy that, with the establishment of NAFTA, important changes occurred in trade and investment patterns, generating a greater synchronization of trade with the economic cycles of the United States and Mexico (Villarreal and Fergusson, 2014). The implementation of NAFTA accelerated the development of intra-industrial trade between the United States and Mexico. Particularly, vertical intra-industrial trade has been very significant, reflecting the trade pattern of the region based on the differentiation of traded goods in terms of value, quality, and their role in the production process (Ekayanake, Veeramacheneni, and Moslares, 2009). Hillberry and McDaniel (2002) analyzed the characteristics of trade growth among the U.S., Mexico, and Canada. They concluded that trade in the North American region has grown intensely, indicating that two characteristics of trade between the U.S. and Mexico are that U.S. industries have faced competition from Mexican imports, and that U.S. consumers and manufacturers have had access to imports from Mexico at a lower cost. In their study, Burfisher, Robinson, and Thierfelder (2001) indicated that for the United States, the establishment of NAFTA had a positive but limited impact on its trade, pointing out small but positive effects for the U.S. economy. Waldkirch (2010) analyzed the impact of NAFTA considering foreign direct investment; the results suggest that there are positive effects on productivity and wages in Mexico. De la Cruz and Riker (2014) estimated the impact of NAFTA on U.S. labor markets and found small but positive effects on the real wages of skilled workers in the United States.
The recent changes in U.S. trade policy leading up to the U.S.-Mexico-Canada Agreement (USMCA) introduced a scenario of increased value-added content in the North American region for the automobile, electronics, aluminum, and steel industries. The establishment of the USMCA would modernize aspects of trade in services and digital commerce and would change the rules of origin, which in this agreement would demand a larger percentage of inputs from the North American region. The modifications of the new agreement could have positive or negative effects, depending on the manufacturing sector’s ability to adapt, both in the U.S. and Mexico.
This article is aimed at evaluating the determinants of trade between the U.S. and Mexico at the regional level. Specifically, the research seeks to estimate the effects of tariffs and transportation costs on trade between Mexico and U.S. states. The research methodology consists of an empirical adaptation of a gravity model for estimating the determinants of trade between countries and regions. This econometric model, based on the gravitational equation, has been extensively used in empirical studies on trade relations between countries. From this perspective, the assumptions are that bilateral trade between the U.S. and Mexico at the regional level depends on income levels, population, distance, and the tariff structure, as well as additional control variables.
The article is structured as follows: first, I introduce the objectives. In the second section, I discuss the characteristics of NAFTA and its effects on trade between the U.S. and Mexico. In section three, I present the characteristics of the manufacturing sector in North America and the new provisions of the USMCA. Section four discusses the major determinants of the U.S.-Mexico trade and the methodology of the empirical model. In section five, I explain the econometric results, and section six presents the conclusions.
NAFTA And U.S.-Mexico Trade
NAFTA Provisions
The most important aspects of NAFTA involved the establishment of provisions to reduce tariffs, design rules of origin, and protect foreign direct investment. Additionally, it included provisions for intellectual property rights, government procurement, and dispute resolution. Labor and environmental provisions were established in separate NAFTA side agreements.
The tariffs and non-tariff protectionist instruments were gradually eliminated over fifteen years, with the goal of avoiding negative impacts in sectors sensitive to sudden trade liberalization. Depending on the rules of origin, the industries that experienced the most relevant reductions in tariffs were textiles and apparel, which phased out average tariffs of 16 percent for U.S. exports to Mexico. The elimination of tariffs within the automobile industry was related to the rules of origin requirement of 62.5 percent of North American content for automobiles, light trucks, transmissions, and engines, and 60 percent for auto parts. Thus, Mexican tariffs for automobiles, light trucks, and auto parts that complied with the rules of origin were reduced or eliminated.
Regarding the protection of agricultural products, a great deal of agricultural trade was liberated when NAFTA was established. In addition, quotas were converted to tariffs, and tariff-sensitive products like corn and sugar experienced a reduction in tariffs over fifteen years. For textiles and apparel, the rules of origin determined that preferential treatment would be granted to goods produced with yarns made in North America.
In addition to including trade dispute resolution and government procurement provisions, the agreement established the mechanisms to settle FDI disputes within NAFTA countries. It also incorporated protection for intellectual property rights, providing the basis for expanding offshoring and outsourcing of firms and expanding global networks.
The NAFTA Tariff Elimination Process
Prior to the implementation of NAFTA, Mexico’s tariffs were higher than those of the United States. In 1993, before NAFTA was signed, more than 50 percent of Mexico’s imports entered the U.S. duty-free based on the U.S. Generalized System of Preferences. The remaining imports from Mexico had an average tariff imposed by the U.S. of 2 percent. By contrast, the average tariff imposed by Mexico on imports of U.S. products was 10 percent (Villarreal and Fergusson, 2014).
Immediately after NAFTA was established in 1994, the process of eliminating the structure of import tariffs among Canada, the United States, and Mexico began. The process was gradual and was planned for a period of fifteen years, to eliminate barriers to the movement of goods and investment (USCBP, 1992). The appendices of the agreement associated with trade and investment in the automobile sector specified the terms of tariff elimination.
NAFTA provisions also indicated that consultations could be held to expedite tariff elimination when two or more parties agreed to it. As a result, five rounds of negotiations were conducted between the U.S. and Mexico in 1997, 1998, 2000, 2002, and 2008. In 1997, the United States proposed the elimination of reciprocal tariffs in consultation with the private sector of both countries for chemicals, fabrics, and electrical parts classified to eight digits of the harmonized system.
To summarize, the most notable changes in tariff structure occurred in the textile and clothing, automotive, and agricultural industries. In the textile and apparel industries, tariffs were phased out for ten years, until they reached the levels determined by the NAFTA rules of origin. Before the signing of the agreement, 35 percent of Mexican apparel exports faced an average tariff of 17.9 percent, and U.S. textile and apparel exports had an average tariff of 16 percent. Regarding the automobile industry, Mexican exports of automobiles and light trucks had tariffs of 2.5 percent and 25 percent, respectively, and U.S. exports of automobiles and light trucks had 20 percent tariffs, with between 10 and 20 percent for auto parts. Tariffs for agricultural products between the U.S. and Mexico were rather low before NAFTA (around 12 percent), but U.S. exports were subject to import licensing (Villarreal and Fergusson, 2014). However, based on the rules of origin and the elimination of quotas, by 2017 most of the tariffs between the U.S. and Mexico were reduced or eliminated for all commodities.1
NAFTA and U.S.-Mexico Trade
After the establishment of NAFTA, trade among the three members of the agreement grew exponentially, increasing from US$343.7 billion in 1994 to US$1.16 trillion in 2019 (Figure 1). The covid-19 pandemic in 2020 resulted in a break in the expansionary trend of total trade in the region, with negative growth observed in that year. The share of the U.S.-Mexico trade within the NAFTA region expanded from 29.1 percent in 1994 to 51 percent in 2019.2 The empirical evidence has created a consensus among economists and policymakers that NAFTA has created an important volume of trade and economic integration among the three countries of the agreement.
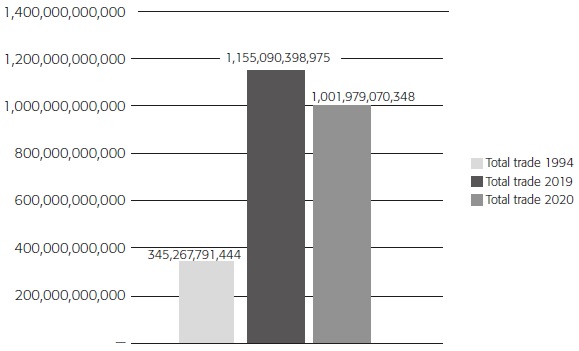
Source: Developed by the author using the United Nations Comtrade data base (n. d.).
Figure 1 VALUE OF TRADE IN THE NORTH AMERICAN REGION (1994-2020) (U.S. dollars)
The trade growth between Mexico and the U.S. was characterized by a more rapid growth in Mexican exports than U.S. exports. Consequently, Mexico’s trade deficit vis-à-vis the U.S. before 1994 became a surplus starting in 1995, when its trade surplus reached US$11.525 billion (Figure 2). The rapid growth of Mexican exports resulted in a surplus of US$149.682 billion in 2018, more than ten times the 1995 surplus. However, the success of Mexican exports to the U.S. was, in large part, the result of increasing manufacturing exports from U.S. companies operating in Mexico. It is worth mentioning that by 2020, the contraction of economic activity in the U.S., and particularly in Mexico, markedly reduced Mexican imports, thus increasing its surplus vis-à-vis the U.S. to US$162.57 billion.
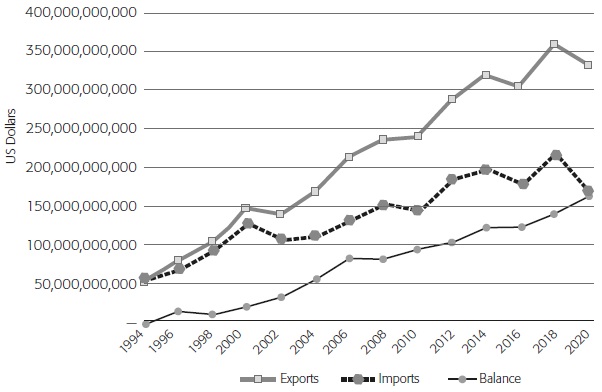
Source: Developed by the author with information from the United Nations Comtrade data base (n. d.).
Figure 2 MEXICO-U.S. TRADE (1994-2020)
Table 1 shows that, between 1994 and 2019, the industries with the highest growth rate for Mexican exports to the U.S. were railway parts (16.2 percent), vehicles (11.6 percent), beverages (11.84 percent), optical and medical instruments and parts (11.0 percent), and machinery and mechanical appliances (10.02 percent). However, the bulk of Mexican exports were concentrated in vehicles and auto parts. In 2019, the value of those exports was US$100.6 billion. Another important group of Mexican exports is made up of electrical machinery, equipment, and parts, with a 2019 export value of US$68.9 billion. Those exports are closely related to the North American supply chain encouraged by U.S. multinational firms in Mexico. Other outstanding exports of Mexico are machinery and mechanical appliances, medical instruments, and fruits and vegetables. It should be noted that the average annual growth of Mexican exports in the period was 7.8 percent between 1994 and 2019. However, this significant expansion experienced an unforeseen break due to the covid-19 pandemic, showing a significant annual decrease in 2020.
Table 1 AVERAGE GROWTH RATE OF MAJOR MEXICAN EXPORTS TO THE U.S. (1994-2020) (U.S. dollars)
| Code | Commodities | U.S. dollars | AARG* (1994-2019) % |
Annual % growth 2019-2020 |
|
| 2019 | 2020 | ||||
| Total exports | 358,660,831,881 | 330,793,896,851 | 7.80 | -7.80 | |
| 87 | Vehicles, parts, and accessories | 100,597,804,264 | 83,573,849,085 | 11.60 | -16.90 |
| 84 | Nuclear reactors, machinery, and mechanical appliances and parts | 69,727,907,442 | 66,164,945,292 | 10.00 | -5.10 |
| 85 | Electrical machinery and equipment, and parts | 68,897,522,755 | 64,523,622,474 | 5.80 | -6.30 |
| 90 | Optical, photographic, checking, medical instruments | 18,221,037,765 | 16,982,168,062 | 11.00 | -6.80 |
| 94 | Furniture; bedding, mattresses, lamps, and lighting | 9,635,119,944 | 8,623,370,256 | 8.90 | -10.50 |
| 7 | Vegetables and certain roots and tubers; edible | 7,183,912,054 | 8,205,918,353 | 7.00 | 14.20 |
| 39 | Plastics and articles thereof | 7,058,341,318 | 7,019,086,792 | 7.40 | -0.60 |
| 99 | Commodities not specified according to kind | 6,445,047,757 | 6,739,431,546 | 25.50 | 4.60 |
| 8 | Fruit and nuts, edible; peel of citrus fruit or melons | 6,302,716,657 | 6,277,250,872 | 10.70 | -0.4 |
| 22 | Beverages, spirits, and vinegar | 6,110,191,718 | 7,105,903,739 | 11.80 | 16.30 |
| 73 | Iron or steel articles | 5,743,618,265 | 5,171,071,296 | 7.60 | -10.00 |
| 71 | Natural, cultured pearls; precious, semi-precious stones; coin | 5,329,942,415 | 5,743,625,926 | 12.30 | 7.80 |
| 86 | Railway, tramway locomotives | 3,699,252,407 | 1,999,872,937 | 16.20 | -45.90 |
| 40 | Rubber and articles thereof | 2,691,403,219 | 2,496,455,988 | 9.70 | -7.20 |
| 72 | Iron and steel | 2,244,108,501 | 2,038,177,866 | 5.00 | -9.20 |
| 83 | Metal; miscellaneous products of base metal | 2,240,619,189 | 2,199,186,807 | 7.30 | -1.80 |
* AARG: Annual average rate of growth for the period 1994-2019.
Source: Developed by the author using information from the United Nations Comtrade data base (n. d.).
U.S. exports to Mexico grew at an average annual rate of 5.3 percent between 1994 and 2019 (Table 2). Specifically, the following products grew rapidly: mineral fuels (13.8 percent), vehicles (8.5 percent), chemical products (7.9 percent), and iron and steel (6.8 percent). In 2019, the major imports from the U.S. in terms of value were mineral fuels (US$36.0 billion); nuclear reactors, machinery, and mechanical appliances (US$28.49 billion); followed by electrical machinery and parts (US$21.16 billion) and vehicles and auto parts (US$21.16 billion), respectively (Table 2). An analysis of Mexican imports from the U.S. indicates that they are based on comparative advantages and the rapid development of global supply chains. Those imports corroborate that U.S.-Mexican trade is predominantly based on intra-industry trade in the electrical, automobile, and oil industries. However, the covid-19 pandemic had a negative effect on the trend of U.S. exports to Mexico in 2020.
Table 2 AVERAGE GROWTH RATE OF MAJOR MEXICAN IMPORTS FROM THE U.S. (1994-2020) (U.S. dollars)
| Code | Commodities | 2019 | 2020 | AARG* (1994-2019) % |
Annual % growth 2019-2020 |
| Total imports | 54,812,850,512 | 206,142,139,412 | 5.30 | -18.40 | |
| 27 | Mineral fuels, mineral oils, and products of their distillation; bituminous substances; mineral waxes | 36,003,792,708 | 22,764,771,854 | 13.80 | -36.80 |
| 84 | Nuclear reactors, boilers, machinery and mechanical appliances; parts | 28,494,972,651 | 23,043,408,435 | 5.60 | -19.10 |
| 85 | Electrical machinery and equipment; sound recorders and reproducers; television image, parts, and accessories | 21,161,594,775 | 17,722,241,390 | 2.50 | -16.30 |
| 87 | Vehicles; other than railway or tramway rolling stock, and parts and accessories | 20,267,335,322 | 15,507,852,153 | 8.50 | -23.50 |
| 39 | Plastics and articles | 15,826,093,041 | 14,087,179,246 | 5.60 | -11.00 |
| 99 | Commodities not specified according to kind | 7,143,809,881 | 5,910,167,402 | 1.30 | -17.30 |
| 90 | Optical, photographic, cinematographic, measuring, medical, or surgical instruments and parts and accessories | 6,095,220,342 | 5,545,539,202 | 5.60 | -9.00 |
| 73 | Iron or steel articles | 4,855,641,730 | 4,134,160,718 | 3.60 | -14.90 |
| 29 | Organic chemicals | 4,704,260,288 | 4,001,239,441 | 5.90 | -14.90 |
| 72 | Iron and steel | 4,163,665,971 | 3,711,794,172 | 6.80 | -10.90 |
| 10 | Cereals | 4,136,236,592 | 4,050,166,262 | 5.90 | -2.10 |
| 48 | Paper and paperboard; articles of paper pulp, of paper or paperboard | 3,974,105,376 | 3,679,960,301 | 3.30 | -7.40 |
| 38 | Chemical products | 3,687,849,958 | 3,508,635,436 | 7.90 | -4.90 |
| 2 | Meat and edible meat offal | 3,423,272,492 | 3,091,240,294 | 6.00 | -9.70 |
| 40 | Rubber and articles | 3,173,874,221 | 2,505,084,243 | 6.60 | -21.10 |
| 76 | Aluminum and articles | 2,944,780,370 | 2,469,111,475 | 5.70 | -16.20 |
* AARG: Annual average rate of growth.
Source: Developed by the author using information from the United Nations Comtrade data base (n. d.).
The success of NAFTA for Mexico and the U.S. was related to three important factors: the development of production supply chains in the manufacturing sector, the two countries’ different natural endowments, and the differential in the levels of education, labor skills, and wages between the workers of the U.S. and Mexico.
The wage differential is an incentive for trade and investment and compensates for the growing difference in labor productivity between the U.S. and Mexico.3 The new technology developments in communications, computers, and the Internet have resulted in a segmentation of the production process; firms and businesses have taken advantage of the wage differentials to establish production processes using intensive unskilled labor in Mexico (Robertson, 2018).
As a result, FDI and trade substantially increased after the establishment of NAFTA. The most important segment of that trade has been related to manufacturing. Exports from Mexico have complemented the U.S. manufacturing industry by trading manufacturing parts and components that have been used in the U.S. to gain competitiveness. This process has encouraged the development of integrated supply chains among NAFTA members.
Mexico and U.S. Trade at the Regional Level
Many studies in the literature delve into the positive effects of NAFTA on trade between the U.S. and Mexico and on both countries’ economic performance. Hillberry and McDaniel (2002) analyzed the characteristics of trade growth between the U.S., Canada, and Mexico with results that revealed a broadening of international trade activity in North America. Although U.S. industries have faced competition from Mexican imports, U.S. consumers and manufacturers have had access to imports from Mexico at a lower cost. Burfisher, Robinson, and Thierfelder (2001) pointed out small but positive effects for the U.S. economy. Waldkirch (2010) considered that NAFTA and FDI have positively impacted productivity and wages in Mexico. De la Cruz and Riker (2014) studied the impact of NAFTA on U.S. labor markets, using a CGE model with data on NAFTA preference margins. They found small but positive effects on the real wages of skilled workers in the United States.
However, to understand the full impact of the establishment of NAFTA, it is important to study its regional impacts on trade. In 2019, the total trade of the most important U.S. state trading partners with Mexico reached US$438.1 billion. The total value of exports to Mexico was US$180.5 billion, while imports were US$257.6 billion. Around two-thirds of the trade between the U.S. and Mexico is concentrated in four states: Texas, California, Michigan, and Illinois, which accounted for 61.7 percent of the total. In particular, Texas and California stand out as Mexico’s major trading partners (Table 3). The factors explaining the intense trade of those states with Mexico are related to the size of their economies, their relative proximity to Mexico, and the characteristics of the commodities traded with that country.
Table 3 MAJOR U.S. STATES TRADING WITH MEXICO (2019) (U.S. dollars)
| State | Exports | Imports | Total Trade | Share of Total Trade (%) |
| Texas | 108,586,390,896 | 104,320,136,826 | 212,906,527,722 | 34.64 |
| California | 27,964,751,222 | 46,678,417,873 | 74,643,169,095 | 12.15 |
| Michigan | 11,160,094,313 | 58,200,153,323 | 69,360,247,636 | 11.29 |
| Illinois | 9,303,981,855 | 12,828,583,165 | 22,132,565,020 | 3.60 |
| Arizona | 8,186,533,528 | 9,302,136,826 | 17,488,670,354 | 2.85 |
| Ohio | 6,882,070,857 | 8,855,696,961 | 15,737,767,818 | 2.56 |
| Tennessee | 4,166,062,929 | 10,322,011,486 | 14,488,074,415 | 2.36 |
| Pennsylvania | 4,241,656,282 | 7,113,265,359 | 11,354,921,641 | 1.85 |
| Indiana | 5,670,673,247 | 5,157,074,163 | 10,827,747,410 | 1.76 |
| Louisiana | 8,427,414,409 | 2,397,764,935 | 10,825,179,344 | 1.76 |
| Total | 180,491,541,882 | 257,620,401,819 | 438,111,943,701 | 71.29 |
Source: Developed by the author using U.S. Census Bureau (n.d. a) information.
The major states of Mexico receiving exports from the U.S. in 2018 were the northern border states of Chihuahua, with 14.1 percent; the state of Nuevo Leon, with 8.4 percent; and Tamaulipas, with 5.7 percent. Other important trading regions were the state of Mexico, with 9.4 percent and Mexico City, with 7.5 percent (BTS, n.d.).4
Regarding the major exports of U.S. states to Mexico in 2019, exports of oil and derivatives from the state of Texas have the highest value, with US$24.6 billion (Table 4) and represented 9.6 percent of the U.S. exports to Mexico (USCB, n.d. b). The increasing energy trade and investment reflects the integration of that industry in the North American region. NAFTA Chapter 6 eliminated tariffs and quotas in the energy sector but left special provisions for Mexico, allowing it to prohibit foreign direct investment in exploration and distribution of crude, natural gas, and electricity (Hufbauer and Jung, 2017). In 2013, Mexico passed constitutional reforms allowing FDI in exploration, refining, transport, and storage of crude and natural gas. The establishment of the USMCA could deepen the legal certainty for investments, thus encouraging further growth in that sector.
Table 4 MAJOR EXPORTS OF U.S. STATES BY COMMODITY (2019-2020) (U.S. dollars)
| U.S. State | Code (HS) |
Commodity (2 digits) | 2019 | 2020 | Percentage Annual Change |
| Texas | 27 | Mineral fuels; Oils and waxes | 24,555,200,396 | 19,100,992,052 | -22.20 |
| Texas | 84 | Nuclear reactors, boilers, machinery etc., parts | 22,547,337,282 | 15,901,764,474 | -29.50 |
| Texas | 85 | Electrical machinery; Equipment and parts | 20,366,118,810 | 19,165,704,631 | -5.90 |
| Texas | 87 | Vehicles other than railway | 7,075,299,618 | 5,537,081,075 | -21.70 |
| California | 85 | Electrical machinery; Equipment and parts | 6,375,164,234 | 5,875,584,866 | -7.80 |
| Texas | 39 | Plastics and articles | 6,327,599,955 | 5,579,467,305 | -11.80 |
| Louisiana | 27 | Mineral fuels; Oils and waxes | 6,063,069,586 | 2,974,020,045 | -50.90 |
| Texas | 29 | Organic chemicals | 4,211,965,013 | 3,180,152,028 | -24.50 |
| California | 84 | Computer-related machinery and parts | 3,865,576,144 | 3,483,023,517 | -9.90 |
| Michigan | 87 | Vehicles other than railway | 2,960,647,387 | 2,165,003,942 | -26.90 |
| Texas | 90 | Measuring and testing instruments | 2,940,685,660 | 2,772,647,019 | -5.70 |
Source: Developed by the author with information from the U.S. Census Bureau (n.d. a).
A second group of U.S. exports that reflects the increasing integration of global supply chains involves the automobile industry. In 2019, Texas was the major exporter of vehicles, engines, and auto parts followed by Michigan, which mainly exported piston engines, with a value of exports of US$7.1 billion and US$3.0 billion, respectively (Table 4). The automobiles and auto parts exported by U.S. states showed that they were also involved in the supply chain for auto production in the North American region. Mexico also exports automobile components and vehicles to the United States. In 2018, Mexico’s automobile industry exported US$29.8 billion to Michigan, US$12.2 to Texas, and US$11.5 billion to California (Table 5).
Table 5 MAJOR IMPORTS OF U.S. STATES BY COMMODITY (2019-2020) (U.S. dollars)
| State | Code | Commodity | 2019 | 2020 | Percentage Annual Change |
| Michigan | 87 | Vehicles Other than Railway | 42,632,788,786 | 34,460,255,969 | -19.2 |
| Texas | 84 | Nuclear Reactors, Boilers, Machinery Etc.; Parts | 28,524,720,033 | 22,648,541,259 | -20.6 |
| Texas | 85 | Electrical Machinery; Equipment and Parts | 22,441,571,947 | 19,665,260,098 | -12.4 |
| Texas | 87 | Vehicles Other than Railway | 15,901,465,123 | 11,869,740,823 | -25.4 |
| California | 87 | Vehicles Other than Railway | 12,448,490,491 | 10,121,428,328 | -18.7 |
| Texas | 87 | Vehicles Other than Railway | 9,208,465,732 | 6,291,300,483 | -31.7 |
| California | 27 | Mineral Fuels; Oils and Waxesl | 7,707,939,447 | 8,064,527,013 | 4.6 |
| Michigan | 85 | Electrical Machinery; Equipment and Parts | 5,438,237,781 | 4,345,940,409 | -20.1 |
| California | 85 | Computer-Related Machinery and Parts | 5,316,235,764 | 9,059,220,639 | 70.4 |
| Tennessee | 87 | Vehicles Other than Railway | 5,101,468,641 | 5,588,830,873 | 9.6 |
Source: Developed by the author with information from the U.S. Census Bureau (n.d. a).
Auto industry trade between the U.S. and Mexico demonstrates the significance of intra-industry commerce as a part of U.S.-Mexico economic integration. The increasing interconnection of trade among countries arising from global supply chains is derived from the fragmentation of production. Since the mid-1990s, global economic integration has accelerated, through increasingly complex trade relations and global supply chains that create value throughout the production and distribution processes in different countries of the world, particularly in the auto, electronics, and computer industries. According to data estimated by the Organisation for Economic Co-operation and Development (OECD), significant trade exists in value added, which represented 15.6 percent of total U.S. trade and of 46.9 percent of Mexican trade.
Another group of U.S. exports to Mexico consists of electronics, computers, and electronic circuits. Parts and accessories for computers and electric machinery and parts were Texas’s second and third major exports and California’s most important exports to Mexico (Table 4). This underlines the relevance of the states of Texas and California in the production of electronics and computer-related goods in the United States and the Mexican economy’s increasing demand for these manufactures.
In 2019, U.S. states’ main imports from Mexico included automobiles and auto parts for Michigan, Texas, and California, valued at US$42.6 billion, US$15.9 billion, and US$12.5 billion, respectively. In addition, Mexico also exported electronic products to the U.S. In particular, computers and parts and electric machinery, equipment, and parts were exported, with a value of US$20.5 billion and US$10.1 billion, respectively (Table 5). Like exports, in 2020, U.S. imports from Mexico dropped sharply as a result of the coVid-19 pandemic. However, toward the end of that year both exports and imports tended to increase.
Major North American Manufacturing Sectors Under the USMCA
The Automobile Industry
The positive effects of the USMCA agreement are related to the continuation of the supply chains in North America and their synchronization with the gradual imposition of the new rules of origin. By eliminating NAFTA’S originating provisions, the USMCA could have the potential effect of increasing long term investment in the U.S. and in Mexico.
According to Office of the United States Trade Representative (USTR) estimates, automakers will invest US$34 billion in five years. The establishment of new rules of origin would encourage investments by companies such as Fiat Chrysler, Ford, General Motors, Toyota, and Volkswagen. The projected capital investment within the U.S. added to the investment accumulated in Mexico between 2009 and 2018 could intensify the value chains between these two countries. However, both production and exports from those countries would have to rapidly replace the inputs arriving to the region from elsewhere.
The automobile companies located in Mexico would be required to import fewer inputs from USMCA non-member countries. The challenge for the Mexican automobile industry is to attract more investments in the assembly subsector. Additionally, the industry could take advantage of the new opportunities generated by the new regional component requirements to expand investments in the auto parts subsector.
The Oil Industry and the USMCA
Oil and derivatives make up the second largest category of traded goods between the U.S., Canada, and Mexico. The North American region’s energy sector is highly integrated and interdependent. The implementation of the USMCA will continue to support it with the elimination of tariffs for crude oil, gasoline, and other refined products, which would allow investment security and the expansion of Mexico’s natural gas sector.
However, on the Mexican side, the state-owned oil enterprise, Petróleos Mexicanos (Pemex), faced several constraints. In the first place, Pemex has not had access to foreign investment for developing projects. The next obstacle it faces is the heavy burden of federal taxes. Finally, it has been argued that Pemex has a limited capacity to provide efficient management. To cope with those problems, the Mexican government reformed the legislation regarding the energy sector in 2013 (Wood, and Martin, 2018). As a result, the oil and gas industries have opened up to foreign investment and the national oil company, Pemex, has been restructured.
According to Gantz (2019), the energy reforms consisted of the following major changes: preserving state ownership of subsoil hydrocarbons resources while permitting private ownership of resources extracted; creating contracts for exploration, production, and service; opening the refining, transport, storage, natural gas processing, and petrochemicals sectors to private investment; transforming Pemex into a productive state enterprise with an autonomous budget and a board of directors; and strengthening federal entities with regulatory roles in the hydrocarbon industry.
An estimated US$21 billion in investment is required for developing Mexico’s energy sector (Abad, and Maurer, 2008). The USMCA stipulates continued zero tariffs for energy products in the North American region, and it could encourage additional investments that would increase production of oil derivatives and the trade of hydrocarbons by pipelines. Also, it will provide new rules of origin requirements for oil and gas traded in the region (USTR, 2018).
The Electronics Industry and the North American Regional Integration
The USMCA will also change the rules of origin for electronics. In particular, the U.S. electronics industry is highly integrated with both Canada and Mexico. That sector’s intense trade is highly impacted by intra-firm trade, with multinational firms in the electronics sector located in the three countries. According to the IPC-Association Connecting Electronics Industries (IPC, 2019), around 78 percent of electronics imports from Mexico and 47 percent of the electronics exports to Mexico are traded between parent and affiliate companies.
In addition, electronics are becoming an important part of vehicles (around 35 percent). For Mexico and Canada, intermediate inputs for the production of computers and electronics rely on U.S. imports; therefore, an important share of the total value of those countries’ production is sourced from the U.S. However, electronic inputs from China have been gradually substituting U.S. inputs.
One characteristic of the electronics industry is the importance of supply chains that allow for greater efficiency and lower costs. Low tariffs and geographical proximity have created a supply chain across the North American countries. The establishment of the USMCA will reduce the uncertainties affecting investment, allowing for the further development of the North American supply chain.
Another relevant aspect regarding the electronics industry has to do with the rules of origin for the automobile industry. The electronics industry supplies a variety of parts for automobiles; therefore, the USMCA regional value content requirement could have a significant effect on the electronics industry. The regional value content requirement to have a tariff exemption is 75 percent for core parts, 70 percent for principal parts, and 65 percent for complementary parts. As a result, both automobile and electronics producers will have to meet the new value content requirements to have preferential treatment under the USMCA.
Global Value Chains, Transportation Costs, and Distance
Trade growth between the U.S. and Mexico has occurred within the framework of the emergence of global value chains. During the 1980s, the developing countries changed their trade policy from an import-substitution strategy to an export-based growth strategy, making way for the emergence of global value chains (Milberg and Winkler, 2012). The internationalization of capital and production processes generated a set of activities such as design, phases of production, and distribution that constitutes the value chains of a company or a group of companies of the same type of activity (Gereffi and Fernandez-Stark, 2011). The development of global value chains is directly related to technological characteristics and the phases of production, geographical considerations such as agglomeration economies, and institutional structures (Cattaneo, Gereffi, and Staritz, 2010). In the case of the North American region, value chains developed under NAFTA because of multinational manufacturing companies’ increasing outsourcing of production. These firms are seeking to reduce transportation and labor costs and, as a result, the production of intermediate and final goods has increased significantly.
Additionally, intra-industry trade is associated with global value chains. However, intra-industry trade basically measures the amount of trade between two countries that is related to the same type of product or industry. Goods can be vertically differentiated in quality and price or horizontally differentiated depending on consumer preferences. Both phenomena have certain independence since they may not necessarily have to coexist at the same time. However, both tend to promote the opening of markets to take advantage of low transport costs and location advantages, thus encouraging the consumption of intermediate goods (Baccini, et al., 2018).
Theoretical explanations of the development of intra-industry trade are based on the models established by Jeffrey Bergstrand (1985; 1990) and Avinash Dixit and Joseph Stiglitz (1977), which assumed monopolistically-competitive markets and increasing returns to scale in a two-industry, two-factor context. These authors have argued that the following factors are determining the growth of world trade: trade liberalization, transportation costs, convergence of income, and increasing outsourcing with vertical specialized intermediate goods and the diversification of production processes (Baier and Bergstrand, 2001). Several authors have introduced a market structure to the trade model (Krugman, 1979; 1980; Helpman and Krugman, 1985; Bergstrand, 1985; 1990). Assuming a monopolistic competitive structure and increasing returns to scale, firms can produce slightly differentiated goods and, therefore, countries can produce goods depending on their economic size, production costs, their factor endowments, and consumer preferences.
The empirical analysis of the determinants of bilateral or multilateral trade is based on the so-called gravity model. The model considers that economic activity in a given country or region, along with transportation costs, are the most important factors defining trade levels. The theoretical foundation for the empirical gravity model of trade is derived from a reduced form of a general equilibrium model of international trade of final goods. From this theoretical perspective, exports are considered production capacity, and imports would be absorption capacity. Anderson (1979) and Bergstrand (1985) included tariffs and transportation costs in a gravity model. They concluded that tariff-rate reduction plays an important role in encouraging GDP growth.
Therefore, the standard framework of the gravity model associates the value of bilateral trade to national income, population, distance, and contiguity (Eichengreen and Irwin, 1995). The econometric specification is based on a log-linear cross-sectional model that relates trade flows between importer and exporter countries to the nominal GDP of both countries, distance between economic centers, and a range of dummy variables such as the existence of preferential trade agreements or a common border (Tinbergen, 1962; Baldwin, 1994; Deardorff, 1998). The states of the U.S. and Mexico are asymmetrical and trade is dispersed due to distance and differing levels of economic activity within Mexico. Therefore, in addition to tariffs, a gravity model should consider that exporting industries face differing transportation costs and variations in demand at the regional level.
Data and Methodology
The analysis of trade between Mexican and U.S. states will be based on the theoretical foundations developed by Krugman (1979), Helpman and Krugman (1985), and Bergstrand (1990). The empirical specification is based on a gravity model, which is a reduced form of a general equilibrium model of international trade, where exports represent the production capacity and imports the absorption capacity of the economy in both countries and regions. The theoretical perspective is based on the expenditure system approach, in which countries are specialized in the production of goods, and prices are normalized to unity. Within this context, trade volume is a function of the income spent in the exporting country and the GDP of the importing country.
Xij |
= IiYj, or Ii = Xij / Yj, where |
Xij |
= volume of trade from country i to country j; |
Ii |
= fraction of income spent on product i of the country; and |
Yj |
= real GDP in importing country j. |
In their studies, Anderson (1979) and Bergstrand (1985) included bilateral trade barriers such as tariffs and transportation costs. Here, I will develop a gravity model that assumes that the quantity of exports and imports of the U.S. states will be positively affected by Mexico’s economic activity and negatively impacted by transportation costs and tariffs. Several authors, such as Baldwin (1994), Frankel (1997), and Deardorff (1998), have documented the predictive power of the gravity model. This type of model has been used extensively in empirical studies of trade.
Based on the gravity approach, the empirical research uses a balanced panel data model to estimate potential impacts of the USMCA on the Mexico-U.S. trade. The econometric analysis includes four periods from 2015 to 2019 for the fifty U.S. states, and is structured as follows:
In C ij = β + β1 In (Yri) + β2In(Ypcj) + β3In(dij) + β3In(Tj) + Inβ4(USFDIij) + Inβ5(Popij) + εij,
where
Yri |
=Real GDP of the U.S. states; |
Cij |
= Value of total trade of U.S. states i with Mexico j; |
Xij |
= export value from U.S. states, i, and imports from Mexico j; |
Yi |
= U.S. per capita GDP; |
Yj |
= Mexican per capita GDP; |
dij |
= effect of distance between the U.S. states i and the Mexican border j; |
Tij |
= simply average tariff imposed in country i and country j; |
USFDIij |
= foreign direct investment of the U.S. in the Mexico ij; and |
TFDIij |
= total foreign direct investment in the Mexico ij. |
The databases consulted are from both U.S. and Mexican sources:
U.S. Census Bureau, U.S. Trade. State and Commodity was the source of trade between states of the U.S. and Mexico;
World Trade Organization, Tariff Analysis Online provided tariffs average for the U.S. and Mexico;
Encuesta Nacional de Población y Empleo, Población Total (National Population and Employment Survey, Total Population) was the source for the Mexican population;
U.S. Census Bureau, Population Division, was the source for the U.S. population by states;
World Bank World Development Indicators, gdp per capita (constant 2010 US$) provided information about the Mexican gdp per capita;
Distance between the closest U.S. states and the Mexican border was obtained with a distance calculator, https://www.distancesto.com/us/phoenix-to-tijuana/history/2811804.html; and,
The U.S. FDI in the Mexican states was obtained from Mexico’s Ministry of the Economy.
Econometric Results
The econometric model estimated the underlying determinants of trade between Mexico and the United States, in particular structural aspects such as the size of the economies of the U.S. states, the distance between the states and the border with Mexico, and other control variables, such as fdi in Mexico and the average tariff rates applied in the period under analysis. Given the characteristics of both countries’ economies, it is assumed that factors such as transportation costs and the size of economic activity are determinants for the growth of trade, in a context of trade integration and low tariff rates.
The methodology of estimation was based on a panel data model with fixed and random effects. To determine which econometric model was more appropriate for the panel data set, a Hausman test for the correlated random effects was estimated. The null hypothesis assuming that the effects are not correlated with other regressors was rejected. Therefore, the fixed effect model was preferred to the random effect model. In addition, a Breusch-Pagan test to check for heteroscedasticity was estimated. The null hypothesis of equal variance and distribution of the residuals was rejected, and therefore the test corroborated the pertinence of the fixed model (Table 6).
Table 6 CORRELATED RANDOM EFFECTS (HAUSMAN TEST)
| Hausman Test and Breusch Pagan Tests Test Cross-section Random Effects | ||
| Hausman Test 1 | ||
| Ho: difference in coefficients not systematic | Chi-Sq. Statistic | Prob. |
| 128.3 | 28.1 | |
| Breusch-Pagan Test 2 | ||
| 477.7 | 0 | |
1Null hypothesis: that there is no endogeneity in the random effects model.
2Null hypothesis: homoscedasticity is present, and the residuals are distributed with equal variance.
Source: Author‘s estimate.
The results indicated that trade between the states of the U.S. and Mexico was positively impacted by the size of the GDP of the U.S. states. The coefficients were statistically significant at 5 percent and 1 percent for the fixed and random effects models (Table 7). This result highlights the importance of the U.S. states in trade with Mexico. Particularly, those that have a significant commercial flow based on proximity and global value chains.
Table 7 INDEPENDENT VARIABLE: TOTAL TRADE (2015-2019) FIXED AND RANDOM PANEL MODELS
| Dependent Variable: Total U.S.-Mexico Trade |
Fixed | Random |
| C | 2.19 | |
| 0.11 | ||
| LUSGDPS | 1.10** | 1.38 |
| 1.87 | 10.37 | |
| LDIS | -0.59* | -0.66 |
| 2.79 | 2.83 | |
| LAPTUS | 0.32** | 1.86** |
| 1.79 | 1.86 | |
| LAPTMX | 0.7 | 0.7 |
| 1.27 | 0.52 | |
| LGDPCMX | 0.37 | 0.37 |
| 1.21 | 1.28 | |
| LGDPCUS | 0.32*** | 0.1 *** |
| 1.44 | 1.43 | |
| LTOFDI | 0.48*** | 0.48*** |
| 1.78 | 1.77 | |
| R squared overall | 0.64 | 0.75 |
| Wald chi-statistic | 178.25 | |
| Prob >0 | 0 | |
| F-statistic | 5.95 | |
| Prob >0 | 0 |
LUSGDPS = log of the GDP of U.S. states; LDIS= log of distance; LAPTUS = log of Trade weighted average duty applied by the U.S.; LAPTMX = log of Trade weighted average duty applied Mexico; LGDPCMX = log of the Mexican per capita GDP; LGDPCUS = log of the U.S. per capita GDP. 1% level of confidence; ** 5% level of confidence; *** 10% level of confidence.
Source: Author’s estimate.
The panel models exhibited a negative and statistically significant sign of the coefficients of the variable distance, suggesting that the distance between the U.S. states and Mexico plays an important role in trade with Mexico. Thus, the closer the U.S. states are to the Mexican border, the higher the level of trade. This is the case for Texas, California, and Arizona, which are relatively close to Mexico. This also follows the gravitational equation assumptions. The coefficients of the two models were negative and statistically significant and, therefore, support the assumption that if the distance is shorter there will be increased trade between regions, underlining the importance of transportation costs.
The coefficients of the average tariffs applied by both the United States and Mexico were positive. However, only the coefficient of the tariffs applied by the U.S. was statistically significant. These results suggest that tariff reduction has been an important factor in the growth of trade between the two countries, both during the NAFTA and the USMCA periods. In addition, per capita GDP of the United States and Mexico were included as explanatory variables to observe the effect of the size of both economies, considering the size of the population. The U.S. per capita GDP coefficient was positive and statistically significant, suggesting that the U.S. economy is a major driving force for growth for the two countries. For its part, Mexico’s per capita GDP coefficient for Mexico was also positive, but not statistically significant.
Finally, the amount of total foreign direct investment in Mexico was used as a variable that reflects the growing economic integration of the United States and Mexico and its impact on both countries’ trade. This variable’s coefficient was positive and statistically significant at 10 percent of the confidence level. For both the U.S. and Mexico, trade and FDI are closely related through intra-industry trade and global value chains.
Therefore, the econometric estimation suggests that the proximity of the U.S. states to the Mexican border, characterized by manufacturing and maquiladora activities, and the level of economic activity of the U.S. states have been important driving forces of U.S.-Mexico trade. In addition, the estimations support the conclusion that low tariffs will continue to promote trade and that the success of the USMCA will depend on the manufacturing sector’s capacity in the U.S. and Mexico to supply the inputs necessary to increase the North American value content of exports.
Concluding Remarks
The modification of NAFTA to establish the USMCA imposed new challenges and the need to restructure the North American supply chains to meet the new input content requirements proposed in the agreement’s rules of origin section. A major impact of NAFTA was the reciprocal dismantling of the tariff structure within the region composed of the three member countries. Mexico lowered its rates significantly, which, before NAFTA, were higher than those imposed by the United States and Canada. The tariffs were gradually eliminated in some cases, such as for chemicals, electrical parts, textiles, etc. The removal of tariffs was conditioned on the requirements of the rules of origin that established a minimum content of 62.5 percent of the value produced in the NAFTA region.
The research and statistical evidence indicate that NAFTA resulted in increased trade and investment in the North American region. Particularly, trade between the U.S. and Mexico expanded rapidly. Exports from the United States to Mexico focused on oil, electrical equipment, vehicles, and chemicals. U.S. imports from Mexico were mainly vehicles, electrical machinery, and mechanical appliances, as well as fruits and beverages. The result of this trade expansion was related to the development of value chains in manufacturing, differing endowments of factors of production and low transportation costs.
The states of Texas and California have traded predominantly with Mexico, based on their diverse economic activity and natural resources. The commercial relationship in this sector has been fundamental for the economic integration of those states with the Mexican economy. Also, the automobile trade between Mexico and the states of Michigan and Texas reflects the importance of intra-industry trade. Finally, the electronics and computer sector has seen an increase after the establishment of NAFTA, indicating its importance to trade between the two economies.
The new USMCA agreement modernizes intellectual property rules and government procurement and adds changes to the rules of origin. In particular, the automotive sector will gradually increase regional content from 62.5 percent to 75 percent. In addition, it introduces the concept of labor requirements, which requires that wages of US$16 an hour must be paid by at least 40 percent of Mexican automobile exports to avoid tariffs. This is still a factor that could potentially affect trade between the U.S. and Mexico, given the differences in labor productivity in both countries.
Tariff reduction under NAFTA has had a positive impact and has deepened supply chain integration between Mexico and the United States. The establishment of the USMCA could potentially increase investments in the automobile, steel, aluminum, and electronic industries in the U.S. and also could attract more FDI to Mexico, which would be necessary to comply with the agreement’s value content requirement. The USMCA tariffs could have a positive effect on trade, depending on the fulfillment of value content requirements.
The results of the panel model estimated suggest that the low tariffs have played an important role in North American region economic integration. The model confirmed that foreign direct investment has a positive effect on trade between the two countries through the link between investment and non-industrial trade. In addition, the model’s findings indicate that a determining factor for trade between the two countries is related to the size of economic activity in the United States at both the national and state level. Distance and economic activity have also contributed to the intensification of trade between the U.S. states and Mexico. Therefore, it can be concluded that polices to encourage trade between the U.S. and Mexico would require the development of communications and transportation infrastructure to take advantage of the relatively short distance between the U.S. border states and Mexico and to be able to reduce the transportation costs for trade.

