


 text in
  English (pdf)
 Article in xml format
 Article references
 Send this article by e-mail
 Cited by SciELO
  Similars in
SciELO
Similars in
SciELO 
 Permalink
Introduction. The context of the new wine geographies
Roughly 10% of the population of Mexico is over the age of sixty - and the gross number can be expected to continue to increase as age cohorts age. This demographic group increased from 3.5% to 10.4% of the total population between 1900 and 2015 when they reached 12 million, a momentous demographic shift in age distribution. The ageing index - the number of older adults -people 60 years and older- per 100 children - grew from 16 in 1990 to 21 in 2000 and has reached 31 in 2015. The median age has grown from 19 in 1950 to 23 in 2000 and 27 in 2015 (INEGI, 2015). Mexico City is the oldest state with a median age of 33, while Chiapas is the youngest with median age 23. Mexico’s demographic shift is widely studied for its expected consequences and future challenges (Ham, 1999; Partida, 2005). As more people are living longer lives, there are accompanying social, institutional, and cultural shifts that are needed to ensure that older inhabitants of Mexico can survive and thrive.
One component of great importance to that ability concerns access to cultural spaces for the recreational, educational, and social benefits that these spaces can support. As such, museums have the potential to play an important role in supporting the ageing needs of elders. We analyze 2017 data from the Museum Statistics database published and managed by the National Institute of Statistics and Geography of Mexico (INEGI). The database consists of data collected by museum personnel during visits as well as characteristics about Museum Institutions. The data show how older adults can make use of museums relative to younger adults, and in turn, raises important questions for designing programs and institutions that effectively support Active Ageing.
Active Ageing is a timely framework for the reasons previously mentioned. While populations globally are ageing due to progress in healthcare and food access, many societies are now faced with larger elderly populations with distinct social and cultural needs. In this paper, we seek to characterize museum access and use patterns by elderly adults at the national level and compare those to patterns of younger adults. We also disaggregate some elderly use patterns across gender (reported in the survey as a binary variable between male and female). We hypothesize that aged 60+ elderly adults’ use of museums often differs from the use by younger adults between the ages 18-59. On social dimension variables, we expected older adults to be less likely to have received family stimulus for cultural consumption, more likely to be first time visitors, more likely to visit alone (related to social isolation), and likely to be less educated than their younger adult peers.
On access dimension variables, we expect a higher reliance on public transit use and walking by younger adults, greater times traveled by older adults, and lower rates of participation by older rural adults compared to younger rural adults due to a combination of transportation access and bodily ability differences among older residents. For the purposes of this paper, we will not be able to definitively explain the reasons behind the differences observed, but we can suggest possible explanations and avenues for further research. Based on the patterns observed, Museum Institutions may consider specialized programs and service considerations to support active ageing functions to attract older patrons and create spaces that older adults can use to increase their active aging and social connectedness. Table 1 shows hypotheses based on the variables we studied, grouped according to the Active Ageing framework proposed by the World Health Organization (2002).
Table 1 Hypothesizing based on Active Ageing dimensions.
| Active Ageing Dimension | Hypothesis | ||
|---|---|---|---|
| Survey Variable | Younger Adults | Elders | |
| Social | Family Stimulus | More Likely | Less Likely |
| 1st Visit | Less Likely | More Likely | |
| Visit Alone | Less Likely | More Likely | |
| Personal | Reason for Visit | Learning | Accompaniment |
| High Education Level | More Likely | Less Likely | |
| Method of Discovery | Family/Internet | Relational | |
| Use of Services | Exhibit | Exhibit | |
| Reported Learning | Likely Higher | Likely Lower | |
| Physical | Rural Visitors | Likely Higher | Likely Lower |
| Time Travelled | Likely Lower | Likely Higher | |
| Visit Duration | Likely Higher | Likely Lower | |
| Mode of Transit | More Transit | More Auto | |
Source: based on WHO (2002)
Literature Review
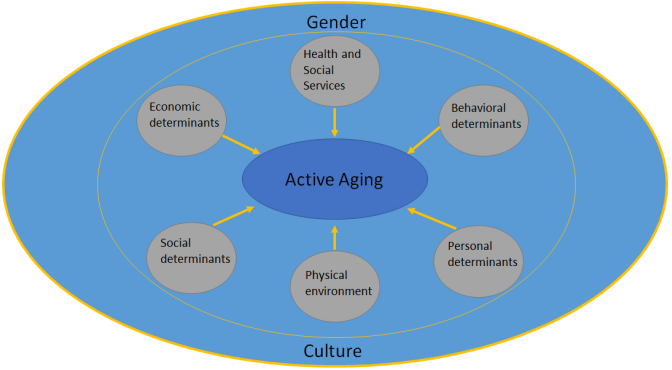
Active ageing, as a novel and prominent paradigm within ageing studies, offers various analytical approaches (WHO, 2002; Walker, 2009; ILC, 2015; Ramos et al., 2016; Salazar-Barajas et al., 2017), but generally centers the perspective that ageing is a positive and important part of life, contrary to past studies and approaches in which ageing is more associated with death and deterioration (Fernández-Ballesteros et al., 2013). “Active Ageing” is defined by the World Health Organization (WHO) as “the process of optimizing opportunities for health, lifelong learning, participation, and security to enhance the quality of life as people age” (WHO, 2002: 12). To further specify, optimizing health includes physical health status, mental health, and social connectedness. Some results suggest that interventions on social isolation could improve structural social support, functional social support, loneliness, and mental and physical health (Dickens et al., 2011). In its 2002 report, Active Ageing. A Policy Framework, the World Health Organization (WHO) makes clear that “active” refers to “continuing participation in social, economic, cultural, spiritual and civic affairs, not just the ability to be physically active or to participate in the labor force” (2002: 12). The WHO policy framework focuses on six components for active ageing: Behavioral Determinants, Health and Social Services, Economic Determinants, Social Determinants, Physical Environment, and Personal Determinants. Some of those determinants are related to systems and services that might be offered to the elderly by the state or by market actors. Others connect more closely to elders’ practices or their backgrounds.
We highlight three determinants of the Active Ageing framework for our purposes, as seen in Figure 1. The first concerns Social Determinants, which focus on preventing loneliness, social isolation, illiteracy, and lack of education, all of which are related to older people’s risk of disabilities and early death (WHO, 2002: 28). Various studies have demonstrated that social support and connectedness prevent stress and can reduce the rate of decline of physical and mental well-being (House et al., 1988; WHO, 2002, ILC, 2015). Rowe and Kahn (1998) have concluded that social integration is a key factor to successful ageing (Rowe & Kahn, 1998). Belonging to a group that shares interests and activities, volunteering, strong intergenerational relations, long-time friendship (former workmates, schoolmates, or neighbors) shapes not only social networks for elderly people but also influence their abilities to stay informed and connected in a society that is becoming more and more digitally driven (Gonzalez-Oñate et al., 2015; Jung & Sundar, 2016).
Though ageing is associated with social isolation, elders use various strategies to maintain social connections and build new relationships. In response to sedentary and less mobile lifestyles in older age, going to a museum can be a means to avoid reduced physical activity and its consequences (Palmer et al., 2019). Leisure time and social activities can decrease isolation - leading to depression, cognitive impairment, and mortality (Lubben, 2017). Indeed, there is a scholarship that characterizes museums as a social experience (Coffee, 2007). Access to knowledge of their social space, including leisure activities, also is key to active ageing and social connectedness (Sinclair & Grieve, 2017; Cardozo et al., 2017). According to literature (González-Oñate, et al., 2015; Sinclair & Grieve, 2017; Yu et al., 2018), older adults use of the internet, including Social Network Sites (SNS), is increasing, which could serve as a way elders discover museums and other social engagement options. Also, studies on SNS have shown that these technologies can improve their quality of life by reducing social isolation while promoting and nurturing their social ties and new relationships (Mo et al., 2018), and also improving their access to social benefits (Yu et al., 2018).
The second determinant group we use is Personal Determinants. Literature evaluating museum use demonstrates that elderly visitors are generally interested in visiting museums (Rogers 1998, Tufts & Milne 1999). Prior knowledge (Antón, Camarero, & Garrido, 2018) and post-visit activity (Antón, Camarero, & Garrido, 2019) have been linked to satisfactory experiences among visitors in general. Affect, and emotion have also been widely understood to be important factors in shaping museum use and satisfaction (Del Chiappa, Andreu, & Gallarza, 2014). Fewer studies specifically focus on elder patrons as units of study. Elottol & Bauhaudin (2011) studied the perception and satisfaction of elderly museum patrons in Malaysia. They find that satisfaction among elderly patrons is related to interior pathway design and circulation accessibility (Elottol & Bauhaudin, 2011: 277). Retcho (2017) studied elderly visitors with and without dementia as a part of the Meet Me at MoMa program which, specifically targeted elders with early-stage Alzheimer’s disease; findings included some evidence of a positive effect on reported affect, an important factor in active ageing.
The third determinant of focus is the Physical Environment. Age-friendly environments have been noted to be key in supporting active ageing (Pregazzi, 2017; Zamorano et al., 2012; Sánchez y Cortés, 2016). Studies from gerontological planning of the physical and social environment perspective suggest that there is still a lot to do regarding spatial mobility for older adults in Latin America (Salas & Sánchez, 2014; Sánchez y Cortés, 2016). Pioneers of ageing studies in Mexico warned about the lack of readiness of certain urban systems facing the ageing process (Welti, 2001; Serrano et al., 2009). Nowadays, diverse research focuses on analyzing and preparing cities and programs to offer friendly and accessible spaces for older adults (Pregazzi, 2017; Zamorano et al., 2012). Recent studies focus on human rights for the elderly (Huenchuan & Rodríguez-Piñeiro, 2010; Rodriguez et al., 2018) and also on their autonomy, mobility, and adaptation (Hernandez, 2018). With respect to museums, the number of museums and their spatial distribution likely impacts elders’ use.
Graph 1 illustrates the temporal pattern of Mexican Museum openings since the beginning of the 20th century. Over 90% of the museums cataloged in the DENUE1 database opened in 1970 or later. Museums became more involved in economic, political, and social issues from the 1970s (Prince, 1990). This was because culture took on a more central role within the social consciousness that connected territory, museums, and society (Gilabert & Lorente, 2016) through a “dialectic interrelation between culture, identity and heritage” (Alonso, 1993; cited in Gilabert and Lorente, 2016: 58). We consider this an important pre-condition for elders to rely on museums to express and satisfy social and cultural interests over time.
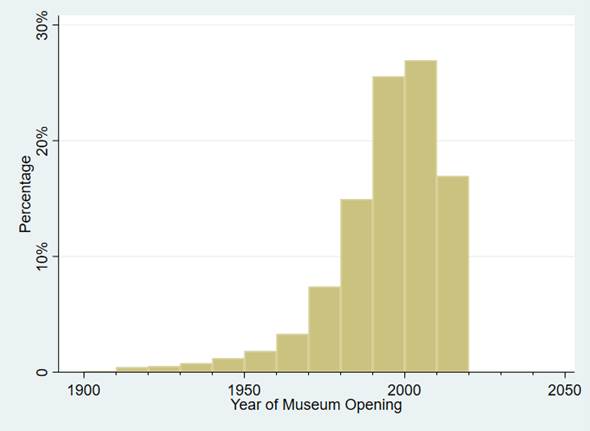
The 1970s represented a shift in museum policy marked by the decentralization of cultural institutions in México. This shift included an increased focus on “grassroots cultural activities, [as] the celebration of the cultural heritage of the indigenous, the rural, and the popular sector, became one of the central topics of cultural policy since the 1970’s” (Komatsu, 2003: 2). The geography of museum locations has dispersed in concert with the expansion in numbers both in rural and urban areas, which is relevant to residential proximity and transportation access today.
By doing so, museums began to connect collections and topics with the context and social environment where they locate (Romero de Tejada y Picatoste, 2002; cited in Gilabert and Lorente, 2016: 86). During this period, the number of museums skyrocketed due to growing publicly funded museums, private art collections made available to the public, and community museums.
It is important to note that a variety of museums may include variations on how individual institutions are run. Shieldhouse (2011), for example, demonstrates how the role of institutional planning and implementation can affect the number of visitors and the quality of visits for UNESCO World Heritage sites in Mexico.
The degree to which museum operation in Mexico specifically targets the accommodation of elderly patrons likely varies across institutions and may be a useful avenue for future research. Map 1 (using geolocation data from DENUE) and Table 2 (using museum municipality data and urban/rural status by population from INEGI) show patterns of museum location nationwide.
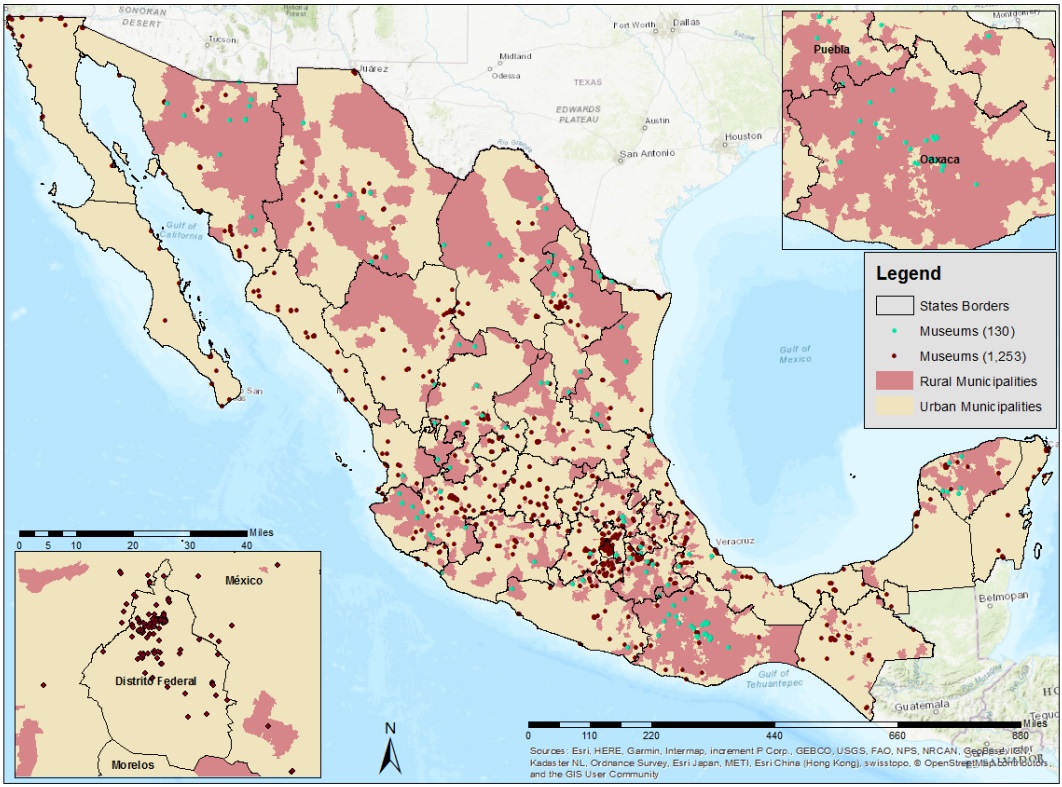
Sources: Esri, HERE, Garmin, Intermap, increment P Corp., GEBCO, USGS, FAO, NPS, NRCAN, GeoBase, IGN, Kadaster NL, Ordnance Survey, Esri Japan, METI, Esri China (Hong Kong), swisstopo, © OpenStreetMap contributors.
Source: INEGI, 2010 (Geostatistic) and 2019 (DENUE).
Map 1 Museums by rural and urban location. México.
Table 2 Location of museums by rural or urban. México.
| Museum Location | Urban Municipality | Rural Municipality | ||
|---|---|---|---|---|
| Mexico | Count | Percent | Count | Percent |
| 1,126 | 89.8 | 130 | 10.1 | |
Source: INEGI, 2018.
Existing literature on transportation mode choices does not yet expansively cover patterns in Mexico, and much less research is explicitly dedicated for trips to cultural recreation destinations among elderly residents. Guerra (2014) demonstrates that in the Mexico City Metropolitan Area, the relationship between the built environment and Vehicle Kilometers Travelled (VKT) among driving households likely strengthened between 1994 and 2007, though the relationship was not substantially different than in U.S. cities. In a study of mode choice in the 100 largest urban areas in Mexico, Guerra et al. found men to be less likely than women to use transit than to drive, bike, or walk, while car use was more likely than transit use for residents up to 44 years of age than for residents older than 44 (Guerra et al., 2018: 102). Harbering and Schlüter (2020) find a similarly gendered pattern in the Metropolitan Area of the Mexico Valley, where women are more likely to use transit than cars, and add that higher education is positively associated with car use. Other studies outside of Mexico (O’Fallon and Sullivan, 2003) indicate that car usage can be expected to be higher for leisure trips in some cases.
Lastly, we take into consideration differences among male and female reporting respondents among the elderly age group. Studies on the relationships between gender and ageing have deep roots in demographic and ageing studies. Active Ageing frameworks have frequently been applied in the Global North. Montero López et al. (2011) find in Spain some evidence of objective and perceived health declines to be more severe in women among a group of 456 elders (Montero López et al., 2011: 608). Foster & Walker critique the dominant productivist frames of active aging in the European Union, which “largely ignore the different needs of older men and women” (Foster & Walker, 2013: 7), suggesting in its place a life course approach that validates needs at different stages of life and decouples the deserving of support from economic productivity.
Studies about gender in old age point to several differences among men and women, this is undoubtedly influenced by the fact that women can be disadvantaged in comparison to men when it comes to labor, income, and educational attainment (Freixas, 1997; Muñoz & Espinosa, 2008; Fernández-Mayoralas et al., 2015). Safety is a concern that affects both transportation and the use of public space (Yavuz & Welch, 2010). Longer life expectancy worldwide can mean that some older women spend aged years alone (Muñoz & Espinosa, 2008). Muñoz and Espinosa highlight that gender is “a cross-sectional determinant of active ageing and reflects huge disadvantages of older women” (2008: 305). While this study cannot speak to speak directly to health and socioeconomic dimensions specifically, including gender analysis helps to understand challenges and opportunities for policies, facilities, institutions, and academic research to support active ageing outcomes for people of different identities who may have different needs.
To investigate the three components of an active ageing framework on Mexican visitors to museums, we compare adults aged 18-59 to adults 60 and overusing crosstab analysis. To expand further, we apply a gender analysis to disaggregate older visitors into male and female respondents to determine if gender differences appear in elderly visit characteristics.
Data and Methodology
Studies on cultural access and cultural consumption regarding museums in Mexico continue to grow. During the 1980s and 1990s, research on museums and cultural access accelerated, but still, it is short nowadays (Schmilchuk, 2012; García, 1993 & 1999; Rosas 2002 & 2007). Scholars have noted a political dimension to using time to visit spaces conceived for leisure and information. The use of time “constructs us as citizens, as social individuals, it impulses or bans us to think, feel and act on reality and on ourselves” (Schmilchuk, 2000: 79). Schmilchuk (2000) advocated for a better understanding of the experience of museum use and thus for better databases about museums and their visitors. She emphasized the necessity of knowing more about those elements to improve not only museums per se but visitors’ investment (in time spent and physical effort) and visitors’ perceptions.
There is a relatively short list of databases related to cultural access and venues in Mexico. The most recent effort is the Estadistica de Museos. It ran in 2016, and it is planned to continue yearly. This database allows users to learn more about museum institutions, access, size, and their visitors. The database has three components - a survey of museum institutions’ characteristics, museum institutions’ volunteership and social service offerings, and museum visitors’ characteristics collected in interviews of patrons by museum staff.
In response to García’s (1993) claims about museum use data, the Estadísticas de Museos database makes a great improvement in showing museums’ and visitors’ characteristics. We worked with the database of the year 2017, which featured 171,627 individual patron responses. After dropping missing data, unspecified responses, museum visitors not from Mexico, elders above age 97 who had been grouped under a single code, and youth aged 13-17, the final sample we used was 129,652 individuals, of which 10,419 were 60 years or older. Some key assumptions impact our use of this data. Firstly, since patrons were interviewed by museum staff, it is possible that patrons willing to spend additional time to participate were predisposed to report more favorable outcomes.
There are also general assumptions about precision and accuracy in self reporting on variables like travel time. The survey also does not ask if the travel was specifically to visit a museum or if visiting one was added as part of a larger trip. Other limitations from this database include a lack of information about visitor’s socioeconomic status and travel distance. However, municipality of origin and travel time help illustrate where older and younger adult patrons come from and how long they are willing to travel.
Further, the structure of data for some responses required some manipulation. For example, educational attainment data was reported across two variables - the highest level of education reached and whether that level was completed. To group individuals by educational attainment, we assigned individuals to the highest level completed. In addition, because levels of education were spread across 9 categories (ninguna, Primaria, Secundaria, Estudios técnicos con secundaria terminada, Normal básica, Preparatoria o bachillerato, Estudios técnicos con preparatoria terminada, Licenciatura, Maestría o doctorado), we collapsed those levels into 5 categories (none, Less than High School, High School, Bachelor’s Degree, Master’s Degree or Higher).
In addition, respondents answered yes or no to a series of questions regarding whom they visited and their motivations to visit, and each respondent has the ability to select multiple responses. We present the percentage of respondents who reported a given motivation or type of companion to compare these variables.
Findings
Social and Personal Dimensions of Museum Use
In the context of active ageing (WHO, 2002; Fernández-Ballesteros et al., 2013; Rowe & Kahn 2015; Fernández-Mayoralas et al., 2015, ILC, 2015), social activity and connectedness are vital for health and daily life issues for the elderly. Likewise, the continuous search for knowledge and satisfaction of curiosity is an important element in active and successful ageing. We investigated social dimensions of museum use with the following questions: with whom do older adults go to museums? What motivates them to go to a museum? Is it to accompany somebody or for personal reasons and interests? Do they have established preferences to visit museums? By what means do older adults find out about the existence of museums or exhibitions?
In addition to their role as places of history, knowledge, and memory (Sandell, 2003), museums also serve as points for meetings, for social, academic, and cultural activities (Camic & Chatterjee, 2013; Antunes & Jesus, 2018). To investigate a social dimension of visitors’ cultural background, we analyzed if respondents received family stimulus for cultural consumption during their childhood. Among all respondents, 85,077 (65.6%) said they received family stimulus for cultural consumption during childhood. Of that group, 4,911 were age 60 or older, representing about 47% of the sample’s total 10,419 persons aged 60 or over. The younger adult groups received family stimulus much more frequently at about 67% of the time.
We also analyzed if the visit they were surveyed was their very first visit to any museum. Table 3 shows reported first visits for 68% (81,562) and 64% (6,676) of the younger adult and elderly adult respondents, respectively. This finding was inconsistent with our expectations, though the proportion of first-time visitors was similar among the age groups we constructed. The proportion of elders visiting for the first time might decline over time as younger cohorts that have already visited a museum age into their elder years; until then, programming implications include engaging first-time visitors across age groups.
Table 3 Family Stimulus and First Visit to a museum. México.
|
Received Family Stimulus for Cultural Consumption |
Age 18-59 | Age 60 and over | ||
|---|---|---|---|---|
| Count | Percent | Count | Percent | |
| Yes | 80,166 | 67% | 4,911 | 47% |
| No | 39,067 | 33% | 5,508 | 53% |
| First Time Ever Visiting a Museum | Age 18-59 | Age 60 and over | ||
| Count | Percent | Count | Percent | |
| Yes | 81,562 | 68% | 6,676 | 64% |
| No | 37,671 | 32% | 3,743 | 36% |
Source: INEGI, 2018.
To examine how visitors’ preexisting social relationships shaped visits, we analyzed companions during visits. 1,494 (14%) of older adults went alone, while 8,925 went with someone. This suggests that elders are able to use museums to engage as individuals as well as to reproduce existing relationships. The most common companions for the elderly were relatives, with 55% (5,716), friends (14% or 1,461 individuals), followed by partners (11% or 1,190 individuals).
The expectation was to see a higher share for tourist companions, but it only appeared for 5% of the elderly respondents. As expected in comparison to younger adults, elders seldom visited with companions related to school or work. Data regarding companions for the young and old groups can be seen in Table 4.
Table 4 Accompaniment by Age Group. México.
| Nobody | Age 18-59 | Age 60 and over | ||
| Count | Percent | Count | Percent | |
| Yes | 14,162 | 12% | 1,494 | 14% |
| No | 105,071 | 88% | 8,925 | 86% |
| Relative | Age 18-59 | Age 60 and over | ||
| Count | Percent | Count | Percent | |
| Yes | 57,544 | 48% | 5,716 | 55% |
| No | 61,689 | 52% | 4,703 | 45% |
| Romantic Partner | Age 18-59 | Age 60 and over | ||
| Count | Percent | Count | Percent | |
| Yes | 16,996 | 14% | 1,190 | 11% |
| No | 102,237 | 86% | 9,229 | 89% |
| Friend | Age 18-59 | Age 60 and over | ||
| Count | Percent | Count | Percent | |
| Yes | 23,348 | 20% | 1,461 | 14% |
| No | 95,885 | 80% | 8,958 | 86% |
| Coworker | Age 18-59 | Age 60 and over | ||
| Count | Percent | Count | Percent | |
| Yes | 2,827 | 2% | 213 | 2% |
| No | 116406 | 98% | 10,206 | 98% |
| Schoolmate | Age 18-59 | Age 60 and over | ||
| Count | Percent | Count | Percent | |
| Yes | 6,411 | 5% | 106 | 1% |
| No | 112,822 | 95% | 10,313 | 99% |
| Tourist Group | Age 18-59 | Age 60 and over | ||
| Count | Percent | Count | Percent | |
| Yes | 1,640 | 1% | 572 | 5% |
| No | 117,593 | 99% | 9,847 | 95% |
Source:INEGI, 2018.
Huijg and colleagues (2017) define Plans and Wishes as important factors during old age. The top three motivations elderly visitors reported for their visit were for general cultural engagement (51%), to learn something (31%), and finally, to accompany somebody (26%). For the younger adults, the same top three motivations were reported at the following rates: cultural engagement (45%), learning (31%), and accompanying another (25%). For the elderly, cultural motivations were higher than the population average. This pattern was surprising since fewer of them received family stimulus-suggesting that the impetus for cultural engagement comes from multiple sources. These reports from visitors demonstrate the intent to use museums for precisely the types of activities that support active ageing. Some research has found that the elderly see museums as options to be active, engaged, and healthy (Hovi‐assad, 2016; Huijg et al., 2017) since it is an activity that makes them go out move and interact with their surroundings.
Educational background is another important dimension of active ageing. Table 5 shows the education levels of visitors compared to nationwide averages by age groups. We find that, contrary to expectations, elderly visitors are, in fact, more likely to have higher educations than the younger adult visitors in addition to having higher educations than the population at large. Such a pattern could be the result of self-selection where education level relates to an interest in visiting, the result of barriers to entry where education level relates to sociospatial advantage and facilitates easier access for the educated, or a combination of the two. However, elderly visitor populations had proportionally larger groups with little to no education. This would be consistent with the finding that many elderly visitors report learning (31%) as a motivation to visit -older adults with lower educational attainment may see museums as an opportunity for continued learning. Regardless, it is clear that the universe of visitors we studied is not representative of the larger population on educational attainment, a pattern relevant for institutions prioritizing inclusion among diverse elder populations.
Table 5 Educational levels. Estadística de museos sample vs. Nationwide averages. México.
| Education Level | Population (18-97) | Visitor (18-97) | Visitor (18-59) | Visitor (60-97) |
|---|---|---|---|---|
| (N = 55,036,609) | (N= 129,652) | (N = 119,233) | (N= 10,419) | |
| None | 10% | 0% | 0% | 2% |
| Less than High School | 49% | 22% | 21% | 34% |
| High School | 20% | 37% | 39% | 20% |
| Bachelor's | 3% | 34% | 34% | 33% |
| Master's or Higher | 2% | 7% | 7% | 11% |
Source: INEGI, 2018.
We also investigated the method of discovery among different visitors. Literature refers to the importance of prior knowledge to the experience of museum visitors, and thus how individuals find out about exhibits/museums may influence the active ageing potential of museums. Older visitors reported social relationships like friends and family (32.3%), past knowledge of the museum (22%), followed by Offices of Touristic Information (11%) were the top three ways they encountered the museums. Younger visitors reported slight differences, learning of the museums by friends and family relatives (31%), teachers (15%), and past knowledge of the museum (15%). Internet use was low among both groups, though lower as expected among the older visitor group. Only 3% of older adults said they used SNS, and only 6.2% used the Internet to know about the museum. We also explored whether the visit to a museum was planned or not, considering that planning activities can be important to maintaining physical and mental well-being for elders (Huijg et al., 2017). We found out that 52% of the overall visitors did plan their visit. Rates were similar among the older adult groups (54% or 5,642) and the younger adult groups (52% or 62,090) in planning visits prior to attending museums. Older adults planned slightly more frequently, but overall large portions of both groups chose to visit more spontaneously, an ability likely influenced by the freedom of time, spatial proximity, and transportation access.
How a museum is used helps to understand its potential as a site for active ageing; thus, we explored use patterns. The use of services followed similar patterns among age groups. The top three services were the exhibitions (91.5%), guided visits (30.4%), and the stores/gift shops (17.3%), which each had similar response rates among older and younger adults alike. None of the other services polled in the survey, were used by more than 6% of the sample. Service use can partly be explained by service provision, which was measured from the museum characteristics database (N=1,256).
With respect to the two most commonly used services, 96.5% of museums featured exhibitions, and 83.7% featured guided visits. However, there were cases where commonly provided services were seldom used. 44% of museums offered arts and cultural activities, while only 5.1% of survey respondents reported using them. Meanwhile, there were also cases where use was sizable despite less frequent provision. Though only 27.0% of museums reported stores or gift shops, 17.3% of patrons still reported using them. This is consistent with former studies, including Rogers (1998), which demonstrated how gift shops have become increasingly important to balance the books in museum contexts in which funding becomes precarious. Of note is the gap between the rate of provision of ability devices to support physical ability (14%) and the rate of use by visitors (0.4%). It may be the case that individuals with less physical ability face transportation challenges in reaching museums or may bring their own devices and therefore lack the need for temporary options. However, greater support inside and outside museums is likely needed to ensure active ageing can occur despite ability differences.
As part of the social determinants involved in active ageing, nurture of education keeps elders socially connected and active within society. This gives them tools to keep their knowledge updated and avoid social isolation and the consequences that come with it. Curiosity has many places and times for satisfaction, and certainly, museums are locations where elders can nurture their knowledge and curiosity. Our analysis showed that 61% (1,973 of 3,225) of elders whose motivation to go to a museum was “Learn” reported the highest learning score of 10, while 58% of those who did not report learning as a motivation reported a learning score of 10 (4,142 of 7,194). Overall, compared with younger adults (53%), a higher share of elderly visitors (60.5%) reported the highest level of learning. Regardless of age group, or whether learning was an explicit goal, most visitors report having learned something new after visiting. In this way, elders and other adults are able to use museums for lifelong learning as consistent with existing literature (Hsieh, 2010; Camic & Chatterjee, 2013; Galvanese et al., 2014).
Physical Determinants: Mobility, Time, Space
The spatial pattern of museums demonstrates some dispersal of institutions with notable clustering around Mexico City and Guadalajara. In general, the vast majority of museums recorded in the INEGI (2018) survey (roughly 90%) are located in municipalities considered as urban (return to Table 2 and Map 1). For elder and younger adult patrons alike, this means that living in a rural area may make it harder to access museums based on travel. For elders living in urban residences, who may be closer to museum locations, transportation accessibility may be an important factor shaping their museum use. This consideration is relevant considering that approximately half of the visitors reported visits in which the trip was not planned.
Contrary to our hypothesis, older rural adults did not have lower rates of museum visits than younger rural adults (though total numbers were lower). The survey data indicates that in 2017 very few patrons reported living in rural municipalities, regardless of age group. Of the 129,652 patrons in the sample, 4,149 (3%) reported dwelling in a rural municipality. As seen in Table 6, adults aged 18-59 and adults over 60 who participated in the survey separately reported the same rate (3%) of rural dwellings (3,831 of 119,224 and 334 of 10,419, respectively).
Table 6 Urban or Rural Origin. México.
| Visitors | Age 18-59 | Age 60 and over | ||
|---|---|---|---|---|
| Count | Percent | Count | Percent | |
| Urban Origin | 115,737 | 97% | 10,083 | 97% |
| Rural Origin | 3,827 | 3% | 322 | 3% |
Source: INEGI, 2018.
Using data collected through the survey, we analyzed travel time and time spent in the museum (see Table 7). On average, older adults traveled longer periods and spent more time during the visit. There were some differences across gender, with older females visiting longer than older males. Table 8 shows travel times in greater detail. For rural dwellers, travel time followed similar patterns between age groups. 78% of younger adults traveled one hour or less to reach the museum destination, while 80% of elderly patrons took trips of that length.
Table 7 Average time travel and average time of visit (minutes) by gender. México.
| Travel and Visit Times | Age 18-59 | Age 60 and over | ||
|---|---|---|---|---|
|
Average time
traveled (min) |
Average visit
duration (min) |
Average time traveled (min) |
Average visit
duration (min) |
|
| Female | 51.7 | 61.7 | 60.7 | 66.1 |
| Male | 54.3 | 58.8 | 61.5 | 61.5 |
Source: INEGI, 2018.
Table 8 Travel Times by Age group: Rural vs. Urban. México.
| Minutes | Rural | Urban | ||||||
|---|---|---|---|---|---|---|---|---|
| Age 18-59 | Age 60 and over | Age 18-59 | Age 60 and over | |||||
| Count | Percent | Count | Percent | Count | Percent | Count | Percent | |
| 0-15 | 1,094 | 29% | 104 | 31% | 27,934 | 24% | 2,671 | 26% |
| 16-30 | 959 | 25% | 93 | 28% | 35,757 | 31% | 2,855 | 28% |
| 31-45 | 470 | 12% | 37 | 11% | 15,341 | 13% | 1,170 | 12% |
| 46-60 | 457 | 12% | 34 | 10% | 13,660 | 12% | 1,197 | 12% |
| 61-75 | 56 | 1% | 8 | 2% | 1,815 | 2% | 174 | 2% |
| 76-90 | 236 | 6% | 12 | 4% | 6,979 | 6% | 547 | 5% |
| 91-120 | 237 | 6% | 13 | 4% | 5,761 | 5% | 513 | 5% |
| 121-150 | 78 | 2% | 4 | 1% | 2,189 | 2% | 216 | 2% |
| 151+ | 244 | 6% | 29 | 9% | 5,957 | 5% | 741 | 7% |
Source: INEGI, 2018.
The majority of younger (54%) and elderly (59%) adults traveled 30 minutes or fewer to their museum destination, older patrons being more likely to take short trips. This was not surprising - as older patrons could be expected to prefer shorter trips, or possibly transportation access could be a barrier for some elders who would otherwise require longer trips. In terms of visit duration for patrons coming from rural residences, young and old visitors alike reported visits of up to one hour between 78 and 79 percent of the time (see Table 8).
The preferred mode of transportation appeared to follow a more distinct pattern by age, however. While younger and older adults from rural areas used private vehicles at roughly the same rates (42.55% and 43.41%, respectively) and walked at roughly the same rates (21.22% and 20.96%, respectively), their use of other modes varied. 24.22% of younger rural adults used public transit, while only 19.42% of older adults did the same.
The reduced use of public transit among elderly patrons is consistent with the literature on public transit accessibility for their age group, following that the level of public transit services tends to be less robust in less densely populated areas and México, public transit is not designed adequately for older adults’ use (Melgar et al., 2013; García, 2016). It is demonstrated that the use of public transit is a gesture of autonomy. It makes the elderly “take control of their own lives” (Attoh, 2017: 205).
Older rural adults had higher rates of use with tourist transport (7.19% vs. 4.10%) and taxis (7.19% vs. 5.56%) compared to rural adults of age 18-59, consistent with the literature. However, there are various alternate potential explanations of this travel behavior. It may be the case that the rural elder patrons who choose to visit museums may have more disposable income on average and therefore chose more personalized, convenient, and subsequently more expensive modes of travel. Meanwhile, finding that about 1 in 5 rural elderly patrons walks to museums when only about 1 out of 10 museums are in rural areas may illustrate how some rural elders are accustomed to walking. The rural proliferation of (especially community) museums may also have helped increase access for people in rural places where museums are, on average sparser. For both age cohorts and rural vs. urban, see Graph 2 and Table 9.
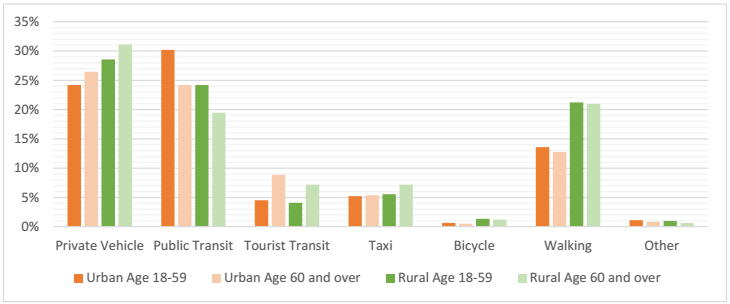
Table 9 Mode of transit by rural or urban and age cohorts. México.
| Mode of Transit | Rural | Urban | ||||||
|---|---|---|---|---|---|---|---|---|
| Age 18-59 | Age 60 and over | Age 18-59 | Age 60 and over | |||||
| Count | Percent | Count | Percent | Count | Percent | Count | Percent | |
| Private Vehicle | 1,094 | 29% | 104 | 31% | 27,934 | 24% | 2,671 | 26% |
| Public Transit | 928 | 24% | 65 | 19% | 34,853 | 30% | 2,440 | 24% |
| Tourist Transit | 157 | 4% | 24 | 7% | 5,227 | 5% | 891 | 9% |
| Taxi | 213 | 6% | 24 | 7% | 6,008 | 5% | 542 | 5% |
| Bicycle | 52 | 1% | 4 | 1% | 746 | 1% | 50 | 1% |
| Walking | 813 | 21% | 70 | 21% | 15,703 | 14% | 1288 | 13% |
| Other | 38 | 1% | 2 | 1% | 1,269 | 1% | 85 | 1% |
Source: INEGI, 2018.
Urban dwellers, in general, attended at much higher rates (over 96% of the sample) as compared to rural patrons. Where rural elders were slightly more likely than younger adults to travel one hour or less, urban elders (78%) were slightly less likely than younger adults (80%) to take trips of that length of time. In this case, the reversal might be explained by closer museum proximity for urban dwelling elders. For trips 30 minutes or fewer, the urban pattern was narrower between age groups. Where 55% of urban younger adults traveled up to 30 minutes to visit the museum, 55% of urban older adults made trips of similar lengths. Shorter visit durations were less common for urban museum visitors across age groups. 72% of younger patrons and 69% of older patrons visited for one hour or less, whereas rural visitors visited an hour or less 78% of the time.
One could hypothesize that visitors from rural areas who spend more time in transit spend less time in the actual museum. Urban patron visits lasted an average of about 60.9 minutes after an average one-way trip of 53.5 minutes. Rural patrons visited for about 52.7 minutes on average after a one-way trip of 56.5 minutes. However, when broken down by age, we find that longer trips do not necessitate shorter visits. The average duration for younger adults was a 52.9-minute trip and a 60.4-minute visit. Elderly visitors traveled an average of 61.1 minutes and visited an average of 63.9 minutes. Longer durations among elderly patrons could have various interpretations. Longer trips could mean that elders have spatially further residences than younger adults or that the mode of transit simply takes longer. Visit duration could also have multiple explanations - for example, elders might be more motivated to engage in exhibits for longer, or their age might impact the speed at which they view exhibitions.
Mode of transit for urban patrons demonstrated some patterns consistent and some inconsistent with those of rural patrons. Older adults used private vehicles slightly more frequently than younger adults, with 47.48% and 44.71% respectively. Age groups’ likelihood of walking was comparable with older adults walking 12.77% and younger adults walking 13.61%. Surprisingly, urban visitors (13.54%) chose to walk less frequently than rural visitors (21.20%). Again, elders (24.20%) were less likely to use public transit than their younger counterparts (30.20%), though both age groups rode transit more frequently when coming from urban origins, both findings consistent with existing literature. While urban elders (8.84%) continued to use tourist transportation at higher rates than younger urban adults (4.53%), there was greater parity on taxi use among groups (5.37% and 5.21%, respectively).
The use of tourist transit over public transit appears to matter for older patrons. In all, elderly and younger patrons appeared to use museums at similar rates. Accessibility appeared to be more related to whether a resident lived in an urban or rural setting than whether they were above or below 60. For elders, proximity to museums appears to be important, as evidenced by high proportions of trips under 30 minutes and surprising proportions of rural walking visitors.
Gender
Table 10 shows gender differences in our sample of respondents. In this age group, women were about as likely as men to visit a museum during that year. Elderly women did spend longer times during their visits than their male counterparts and were more likely to plan their visits. For both groups, family members were the most common accompaniment. According to Toepoel (2013: 366), “Partners, children, and friends can serve as facilitators for cultural participation for the oldest.” Women reported going with a friend more often, and men reported going alone or with a romantic partner. Elderly women’s lower likelihood of visiting alone could have to do with a combination of cost, access, or safety issues.
Table 10 Gender differences among elderly attendees. México.
| Mode of Transit | Rural | Urban | ||||||
|---|---|---|---|---|---|---|---|---|
| Age 18-59 | Age 60 and over | Age 18-59 | Age 60 and over | |||||
| Count | Percent | Count | Percent | Count | Percent | Count | Percent | |
| Private Vehicle | 1,094 | 29% | 104 | 31% | 27,934 | 24% | 2,671 | 26% |
| Public Transit | 928 | 24% | 65 | 19% | 34,853 | 30% | 2,440 | 24% |
| Tourist Transit | 157 | 4% | 24 | 7% | 5,227 | 5% | 891 | 9% |
| Taxi | 213 | 6% | 24 | 7% | 6,008 | 5% | 542 | 5% |
| Bicycle | 52 | 1% | 4 | 1% | 746 | 1% | 50 | 1% |
| Walking | 813 | 21% | 70 | 21% | 15,703 | 14% | 1288 | 13% |
| Other | 38 | 1% | 2 | 1% | 1,269 | 1% | 85 | 1% |
Source: INEGI, 2018.
Presumably, the majority of partnered elderly visitors were in heterosexual relationships - so the partnership findings may reflect sampling bias in the survey process (e.g., talking to one partner and not the other). However, these findings point to how elderly males and females rely on social relationships for companionship in their museum visits. Other notable findings include a difference in the method of discovery, where males relied on prior knowledge more often, and females relied on social relationships and tourist offices more often. That corresponds with the transport mode findings, which demonstrate females were more likely to use tourist transport and public transit, while males were more likely to walk or take a personal vehicle.
Discussion and Conclusion
In this paper, we sought to explore elderly museum use and access in Mexico using new national level data in the context of active ageing, with a focus on personal, social, and physical dimensions. We found that some elders are able to use museums for recreation, learning, and maintaining social connection and engagement, though their preferences and obstacles may at times vary from those of younger adults. At the same time, some findings hint at potential exclusivities that may reduce the ability to participate in certain groups. We consider future avenues for research below.
While we did not measure the average price of entry or senior discount information,2 we know that having leisure time and disposable income are signs of relative class advantage, in addition to transportation options like private vehicles. Other hints that income/wealth matters include the high proportion of highly educated visitors among elderly and younger adults, the use of tourist industry services to learn about, travel to and visit museums, and the ability to visit without planning, as reported by nearly half of respondents. How income/wealth precisely impacts the interest, access, and use of museums by elderly visitors in Mexico and elsewhere is a worthwhile area of continued study.
We are also able to infer the importance of proximity and transportation access to museum use. Since 48% of visitors did not plan their visits, and over 50% of visitors in each age group in both rural and urban locations traveled 30 min or fewer to reach a museum, it appears that convenience helps to play a role. This finding should be analyzed in the context of ability differences among elders - continuing to find ways to enhance design and programming to enable people with mobility support needs to enjoy museums would likely improve the active ageing potential of museums. Similarly, women relied more heavily on public transport matters - in places where transit is sparse, this may affect some women’s ability to visit. Transportation access will largely be decided by local and regional planning and policy decisions and, therefore, likely be outside museum purview. Still, museums might in some cases, be able to partner with public transit agencies or private transportation companies for specialized services to improve access.
Findings also hint at other opportunities to support active ageing through museum programming. While 44% of museums in the INEGI database reported providing arts and cultural programming, only 5% of respondents in the same year reported using such services. Elders in particular, and adults in general, report cultural engagement as a priority motivation to visit and likely achieve a degree of cultural satisfaction through exhibits and guided visits. However, activities outside of exhibits might offer greater opportunities for meeting new people, considering that most of the social interactions we measured among elders were based on preexisting social relationships. For folks who visit alone or individuals who could use an expanded social network, such structured activities could be helpful. In general, greater qualitative and qualitative inquiry into the curiosities and interests of existing and potential patrons could help create museum spaces that invite and retain elderly visits. Lastly, museums offer institutional mechanisms to support lifelong learning. Whether or not learning was reported as a motivation, a high proportion of visitors reported high learning outcomes. To continue to support active ageing, increasing museums access and use among elders will be critical.

