


 text new page (beta)
 English (pdf)
 Article in xml format
 Article references
 Send this article by e-mail
 Cited by SciELO
  Similars in
SciELO
Similars in
SciELO 
 Permalink
Tijuana and San Diego as Urban border partners
Tijuana and San Diego are the most important adjoining cities along this 3 200-kilometer border because of their population growth, their cross-border relationships, and their economic ties. Each city belongs to a country with differing characteristics and this close juxtaposition of differences results in unique social, cultural, and economic interrelationships (Alegría, 1992). It involves one of the busiest international boundaries where social, economic, and family cross-border networks create, strengthen, and transform daily interactions involving work, shopping, tourism, education, and family (Martínez, 1994; Alarcón, 2005). Other important demographic effects of the border include: 1) the structure and development of the economically active population (EAP) of Tijuana, 2) the migration of Mexicans, mainly from Tijuana, to San Diego, and 3) the participation of the EAP of Mexican origin in San Diego. These effects are part of the push-and-pull described by Harris-Todaro (cited in Morillas and Miñana, 2005) and contribute to the perception of these cities as regional development poles. Accordingly, the structural differences between both cities accentuate and determine demographic and economic interactions among their inhabitants, with job searches, efforts to improve economic situations, changes of residence, and family reunification being factors behind the growth of the population of Mexican origin (PMO) in San Diego.
While the labor characteristics of Tijuana and San Diego are interrelated, it is paramount to understand more about the nature, intensity, and importance of these relationships, together with their causes and consequences. To start with, there are some questions whose answers are the reason for this work. One is: What are the dynamics and structure of the Tijuana EAP and of the EAP of Mexican origin in San Diego? in turn, because of the PMO's migratory character and importance both for Tijuana-as part of the northern border of México-and for San Diego-as part of the southern border of the United States-what is the economic contribution of the population of Mexican origin in San Diego? What economic areas does the population of Mexican origin participate in? These questions are the reason behind and objectives of this article: 1) to describe the demographic and economic structure and dynamics of the EAP in Tijuana and the EAP of Mexican origin in San Diego from 1970 to 2010, and 2) to associate their makeup and dynamics with the economic processes that occurred during the same period.
Data and methodology
Because of the way the statistics were compiled and organized, the main categories are the characteristics of EAP by sex and by five-year age groupings in the municipality of Tijuana1 and in the county of San Diego. Accordingly, in each EAP, the change in the structures in terms of age and occupation in each EAP are important, as is the relationship with socioeconomic phenomena brought about by the availability of a workforce and its effect on migratory movements. Descriptive and comparative analysis was used to answer this study's questions after examining the literature supporting the use of differences and similarities (Ragin, 2007; Elliot, 1999), applied in this case to the evolution of and influential factors in the rapid growth of Tijuana's population and of the PMO in San Diego.
The information used came from data obtained from official sources of statistical information in each country at the lowest level of disaggregation possible, which was municipalities in México and counties in the United States. For the municipality of Tijuana, the population and housing censuses were used. The data for San Diego County was obtained from the integrated Public Use Microdata Series, also known as IPUMS (2010). Because the censuses in México before 1960 do not disaggregate EAP data at the municipal level, and because there is no county-level microdata in the United States for that year, the period of study was limited to 1970 to 2010.
Border industrialization (1970)
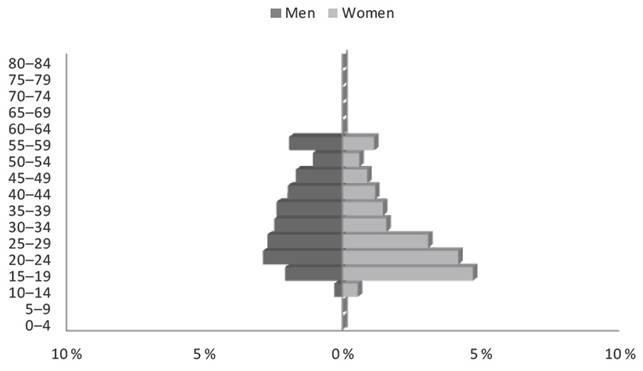
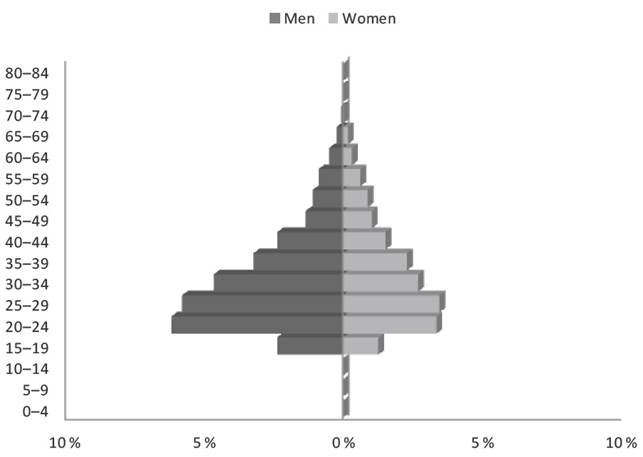
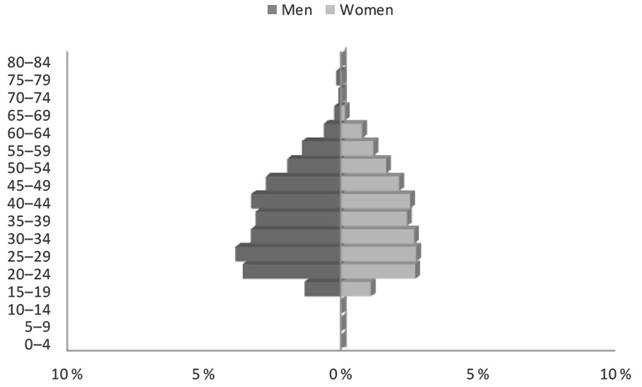
The EAP of Tjuana in 1970 was 88 016 people, or 26.1 percent of the total population, as seen in Table 1. The distribution by sex is 74.7 percent for men and 25.3 percent for women. In the breakdown by sex and age, the ages 15 to 29 stand out in the female participation of the EAP, as a result of the greater integration of the female labor force, as shown in Graph 1.
Table 1 Economically active Population and its Distribution by sex in Tijuana.
| EAP numbers by sex | EAP percentage | EAP percentage of | Percentage of | |||||
| Year | Men | Women | Total | Men | Women | Total | total population | employment rate |
| 1970 | 66 316 | 22 500 | 88 816 | 74.7 | 25.3 | 100 | 26.1 | 95.5 |
| 1980 | 109 590 | 52 474 | 162 064 | 67.6 | 32.4 | 100 | 35.1 | 95.2 |
| 1990 | 192 318 | 75 560 | 267 878 | 71.8 | 28.2 | 100 | 35.8 | 97.6 |
| 2000 | 301 112 | 149 496 | 450 608 | 66.8 | 33.2 | 100 | 37.2 | 99.1 |
| 2010 | 441 347 | 255 560 | 696 907 | 63.7 | 37.7 | 100 | 44.7 | 94.7 |
Source: Compiled by the authors with data from Inegi (1970, 1980, 1990, 2000, 2010).
*The segment of 55-59 years is atypical because that year, all those 55 and over were placed together in this group.
Source: Compiled by the authors with data from Inegi.
Graph 1 Distribution by sex and Five-year age Groupings of the EAP in Tijuana, 1970.*
Various studies indicate that the occupation of industrial worker is feminized at the northern border in comparison with the rest of the country. One explanation is that the maquiladora industry changes the patterns of segregation by sex and increases female participation in various areas of the economy (Coubes, 1999). In part, this is because from its inception, the maquiladora industry has preferred to employ women because they work for less and are considered more skillful and docile than men (Cruz, 1990). In Tijuana, 95.5 percent of those employed are concentrated in four economic areas: services, manufacturing, commerce, and agriculture, with 29.1, 21.3, 16.9 and 9.2 percent respectively, as seen in Table 3. The area of services and commerce predominate; they have been characteristic of work in Tijuana since its beginnings as an urban locality.
Table 2 Economically active Population and its Distribution by sex in the PMO in San Diego, 1970-2010.
| EAP numbers by sex | EAP percentage | EAP percentage of | Employment | |||||
| Year | Men | Women | Total | Men | Women | Total | the PMO | rate |
| 1970 | 32 300 | 14 100 | 46 400 | 69.6 | 30.4 | 100 | 38.4 | 92.7 |
| 1980 | 61 660 | 33 720 | 95 380 | 64.6 | 35.4 | 100 | 41.5 | 91.2 |
| 1990 | 125 158 | 77 809 | 202 967 | 61.7 | 38.3 | 100 | 46.4 | 90.3 |
| 2000 | 149 738 | 111 657 | 261 395 | 57.3 | 42.7 | 100 | 41.7 | 91.7 |
| 2010 | 232 038 | 181 855 | 413 893 | 56.1 | 43.9 | 100 | 45.8 | 87 |
Source: compiled by the authors with data from IPUMS (1970, 1980, 1990, 2000, 2010).
Table 3 EAP in Tijuana by economic activity* (percentage).
| Economic activity | 1970 | 1980 | 1990 | 2000 | 2010** |
| Agriculture | 9.2 | 3.1 | 1.6 | 0.6 | N/A |
| Extractive industries | 0.5 | 0.1 | 0.2 | 0 | N/A |
| Manufacturing | 21.3 | 16.7 | 28.8 | 32.5 | N/A |
| Construction | 7.2 | 6.4 | 8.5 | .9 | N/A |
| Electrical and gas industry, etc. | 0.5 | 0.2 | 0.6 | 0.3 | N/A |
| Commerce | 16.9 | 16.4 | 18.1 | 16.8 | N/A |
| Transportation | 3.3 | 3.9 | 5 | 4.1 | N/A |
| Services | 29.1 | 18.8 | 30.5 | 29.1 | N/A |
| Government activities | 3.1 | 0 | 2.9 | 2.5 | N/A |
| Not specified | 8.9 | 34.4 | 3.9 | 6.1 | N/A |
*In 1970 and 1980, the cebsus utilizes the EAP; from 1990 on utilizes the employed population.
**There is no information available ar the municipal level for 2010.
Source: Compiled by authors with data from INEGI (1970, 1980, 1990, 2000)
The industrial sector gained importance when it became the second-largest employer thanks to the opportunities and incentives the federal government provided foreign-owned maquiladoras along the border, in order to take advantage of the available labor force. There was a striking reduction of agriculture in the 1970s because of the rural-urban shift; this was seen in Tijuana before the rest of the country because of the industrialization that took place in the border zone. According to Garza and Rivera (1990), the accelerated industrialization of the 1960s produced two fundamental changes: one was the drop in agricultural production and employment, bringing about the rural exodus to urban areas, and the other had to do with the development of commerce and services, which expanded alongside the supply of industrial goods.
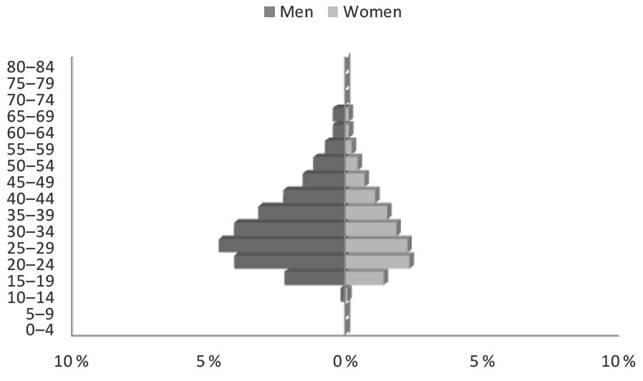
At the same time, the EAP of Mexican origin in San Diego was 46 400, or 38.4 percent of the total PMO, as shown in Table 2. The percentage of males was 69.6 percent and 30.4 percent of females. Of note is that although the PMO has a greater percentage of men of working age, these statistics show a lesser economic participation of men than in Tijuana (7.1 %). This may be because of undocumented persons' reluctance to respond to the census, indirectly showing the vast number of persons who work clandestinely (Martínez, Runsten, and Ricérdez, 2005).
In the structure by sex and age shown in Graph 2, the greater presence of the group of 20 to 24-year-olds for both sexes stands out, with that of males being the most notable. This reflects the migration selectivity for those ages and by sex. Added to this is the temporary nature of migration at the time, where the usual plan for men was to cross the border to work and send money to help support their families and build homes, with a future return in mind. The migratory process was structured with a majority of single men and young people who had gone to work in the United States at least once in their lifetimes, where their labor market integration was sporadic and they stayed only a few months each trip (Verduzco, 1997).
Source: Compiled by the authors with data from IPUMS (1970).
Graph 2 EAP by sex and five-year age groupings of the population of Mexican origin in San Diego, 1970.
The employment rate of the EAP of Mexican origin was 92.7 percent and the economic areas where they worked, in order of importance, were services, commerce, manufacturing, and agriculture with 30.2, 26.3, 14.1 and 9.6 percent respectively, according to Table 4. Manufacturing ranks third, consistent with San Diego's economy, which was geared toward services and commerce after continuous cutbacks in the defense budget, which drove San Diego's economy for decades. It culminates with the practical disappearance of the aircraft, missile, and satellite industries at the beginning of the 1990s (Alegría, 2007).
Table 4 EAP by economic activity of the PMO in San Diego, 1970-2010 (percentage).
| Economic activity | 1970 | 1980 | 1990 | 2000 | 2010 |
| Agriculture, forestry and fishing | 9.6 | 10.9 | 7.6 | 6.2 | 5.1 |
| Mining | 0.2 | 0.2 | 0.2 | 0.1 | 0.1 |
| Manufacturing | 14.1 | 18.7 | 12.5 | 11.7 | 8.6 |
| Construction | 6.9 | 7.9 | 9.6 | 10.1 | 11.1 |
| Electricity and gas | 0.8 | 0.9 | 0.3 | 0.5 | 0.6 |
| Commerce | 26.3 | 22.7 | 25.4 | 24.2 | 25 |
| Transportation | 3.5 | 2.3 | 2.5 | 2.7 | 2.6 |
| Services | 30.2 | 31.3 | 34.9 | 38.7 | 40.5 |
| Public administration | 8.4 | 4.9 | 3.8 | 2.9 | 4.1 |
| Military activities | 0 | 0.1 | 3 | 3.1 | 2.3 |
Source: Compiled by the authors with information from IPUMS (1970, 1980, 1990, 2000, 2010).
In both cases-Tijuana and San Diego-agriculture only occupies nine percent of the EAP. This low number is due to the difficulties agriculture faces because of a lack of water and because of the existence of nearby areas that have greater agricultural activity, such as Mexicali and Ensenada on the Mexican side, and Los Angeles and the Imperial Valley in the United States.
Economic recession before 1980
Table 1 shows that in 1980, the Tijuana EAP was 162 064, 89 percent greater than in the previous decade2. The male component of the EAP falls to 67.6 percent, while that of women rises to 32.4 percent. However, it should be noted that the numbers for women are larger because that year, unpaid family workers were listed as active (García and De oliveira, 1985).
The employment rate in the municipality is 95.2 percent. Also, the border zones reacted differently in economic terms to the 1976 devaluation than did the rest of the country. Tijuana, by being more competitive in terms of labor costs and services, became an attractive city for foreign investment, mainly from Asia, that saw the vicinity with the United States to be advantageous in terms of transportation costs; this growth in the manufacturing sector balanced out the influx of labor coming from internal migratory movements. Also, the evolution of the EAP toward secondary and tertiary sectors was a consequence of the general deterioration of the living standards of previous decades; part of the population that did not usually work, such as students and housewives, found they needed to seek employment.
The statistics for types of economic activity for 1980 are unusual and the not specified category has a very high value, 34.4 percent. While the data only show 16.7 percent in manufacturing, it is possible that these statistics do not accurately reflect reality. Various studies have commented on the problems of methodology and scale that made the 1980 census unreliable because of its inconsistencies (Campos, 1991; INEGI, 1996), defects that are also seen in the case of Tijuana. For that reason, they are not included in this study.
When it comes to the EAP of Mexican origin in San Diego, Table 2 shows it was 95 380, doubling in one decade. An important factor behind this growth was the U.S. economic recession, brought about by the Federal Reserve System, also known as the Fed. An effort to reduce inflation in the mid-1970s resulted in the closing of 109 maquiladora plants (Margulis and Tuirán, 1986), which stimulated the migration of border residents. A large segment of this was undocumented migration, with the majority having San Diego as their final destination, rather than it being just a step along the way to Los Angeles (Ganster and Buj, 1991). The employed population was 64.6 percent men and 35.4 percent women. The increase in female participation obviously continues, and also shows a smoother distribution in Graph 3, as opposed to the irregularities of the previous decade.
With respect to the areas of economic activity, Table 4 shows that in order of importance, services were at 31.3 percent, commerce 22.7 percent, manufacturing 18.7 percent, and agriculture 10.9 percent. This represents a continuity in the county's economic activity, where services and commerce predominate. It is worth mentioning that in the breakdown of services in Table 5, professional and related services are at 42.5 percent and personal services at 24.3 percent. The male-dominated areas of work are mining, construction, agriculture, transportation, repair services, and public administration. The data correspond to the area of work and not to the type of position assigned to it.
Table 5 PMO in San Diego by type of services, 1970-2010 (percentage).
| Type of service | 1970 | 1980 | 1990 | 2000 | 2010 |
| Public and health services | 3.4 | 1.4 | 1.2 | 1.2 | 2 |
| Financial, insurance, and real estate services | 10.8 | 9.9 | 11 | 9.2 | 10.6 |
| Business and repair services | 12.2 | 14.2 | 18.5 | 19.2 | 17.8 |
| Personal services | 33.1 | 24.3 | 22.1 | 17.9 | 14.7 |
| Entertainment and recreation | 4.7 | 3.7 | 5.2 | 4.3 | 5.4 |
| Professional and related services | 33.8 | 42.5 | 39.9 | 45.1 | 47.5 |
| Communication | 2 | 4.1 | 2.1 | 2.9 | 2 |
| Total | 100 | 100 | 100 | 100 | 100 |
Source: Compiled by the authirs with data from IPUMS (1970, 1980, 1990, 2000, 2010).
Amnesty and the change in economy policies of 1990
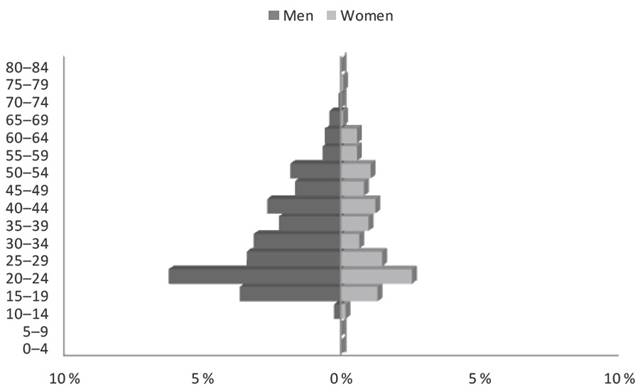
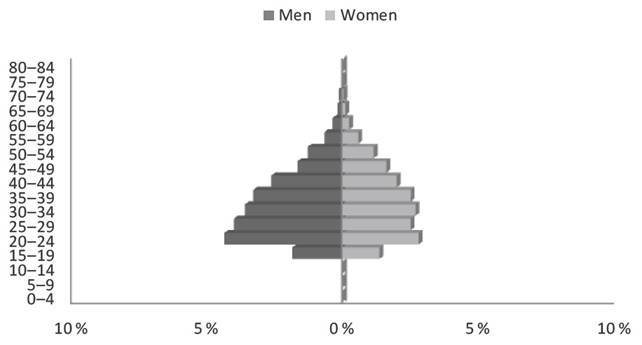
In 1990, the Tijuana EAP was composed of 267 878 people, only 35.8 percent of the total population, as seen in Table 1. Also, Graph 4 shows a drop in workers 12 to 14 years of age3, whose number was significantly higher previously. This drop must be a result of the policies to reduce children's participation in the workplace. In the other direction, the increase of the 65-69 age group starts to show the aging trend of the EAP. Female participation showed a slight decline from the previous census, because the concept of female participation changed and unpaid family workers were not taken into account, as in the 1980 census (García and De oliveira, 1985). Nationwide, female participation was on the rise as a result of various factors, such as job training, education, and productivity, in spite of discrimination in the labor market (Escamilla, 2001). On the other hand, male participation in Tijuana reached 71.8 percent.
Source: Compiled by the authors with data from Inegi (1990).
Graph 4 Distribution by sex and Five-year age Groupings of the EAP in Tijuana, 1990.
The employment rate reached 97.6 percent and the economic activities that largely absorbed this working population were services, manufacturing, and commerce with 30.5, 28.8, and 18.1 percent, respectively (Table 3). Services and manufacturing attracted almost twice the workforce, showing the changes taking place in the entire country. In spite of the so-called lost decade of the 1980s, when México could not afford external debt payments that were causing recession, economic slowdown, and an increase in inequality, Tijuana offered favorable conditions for employment, with high job mobility and economic growth.
The above data reflect México's structural economic and political reforms that took place as a result of the continual crises the country experienced from the beginning of the 1980s as a result of the structural imbalances caused by financing large amounts of imports as import-substitution ended (Salgado, 2010). The economic opening started to set the agenda of national economic policy, foreign investment increased, and as a condition of obtaining new credits from international organizations, the Mexican state cut the number of state-owned companies, privatizing 21 industries.
The launching of the maquiladora export industry, which emerged in 1965 as part of the Border Industrialization Program, allows the export and import of components free of taxes, in addition to granting access to 100 percent foreign-owned businesses (Carrillo, 2002). Also, under policies of trade opening that were part of joining the General Agreement on Tariffs and Trade4 in 1986, border cities became important centers of growth. The dynamics of the services and commerce sectors started becoming key drivers of the region's development, along with the industrial sector, in contrast to the reduced economic activity in the rest of the country.
It is interesting to note that a segment of the EAP is not reflected in the census, the commuters who live in México and cross the international border on their work days (Alegría, 2002; Estrella, 1993; Ojeda, 2009). This segment of the EAP is part of the cross-border process, defined as a way of life characterized by a continuous interaction between individuals and institutions of two different economic structures (Ruiz, 1992). This type of worker plays an important role in these communities and in the local economy; however, while migration flows mainly from México to the United States, cross-border work flows in both directions (Feltman, 2008), but with different characteristics. The inverse flow-from the United States to México-is the result of new and intense economic relations between these two countries, which have allowed Mexican and foreign entrepreneurs, large and small, to live in U.S. territory while owning businesses and working on the Mexican side (Ojeda, 2009). Tijuana benefits from this labor interaction, whether as part of the formal economy (those with work permits) or the informal one (those who are undocumented), by having an escape valve from the pressures of an oversupply of labor, allowing the unemployment rate to remain low and stable.
The available information about commuters from Baja California shows an increase from 28 000 in 1986, to almost 72 000 in 1990; this came about in part as a result of the legalization program in the Reform and Immigration Control Act of 1986 (United States Congress, 1986), colloquially known as the Simpson-Rodino Act; 66 percent of the new commuters were beneficiaries of this law (Estrella, 1993). Furthermore, the increase in work permits allowed by migratory quotas helped this group grow by 44 000 people. According to estimates, this group makes up 6 percent to 7.5 percent of the EAP (Vega, 2011; Alegría, 2002). This subject merits deeper study because of its implications for employment and the local economy; however, more up-to-date data that could improve the estimates are not available (El Colef, 2013).
Meanwhile, the EAP of Mexican origin in San Diego county increased to 202 967, 46.4 percent of the total PMO (Table 2). This is explained because demand for Mexican labor remained strong in the 1980s, particularly because of California's economic dynamism and as a result of a relative drop, beginning in 1985, in the number of California natives joining the workforce (Corona, 1990).
A downward trend in male participation continued; it fell to 61.7percent, while female participation rose to 38.3 percent. Similarly, the structure by sex and age in Graph 5 confirms the growth of women in the EAP in various age groups and the reduction of men in the 40-54 age group; this had been very prominent in the previous decade. Table 4 shows services as the top-ranking economic activity of the EAP, with 34.9 percent; commerce had 25.4 percent of workers and manufacturing 12.5 percent. In contrast to what is happening in the manufacturing sector, which is constantly growing in Tijuana, the participation of this workforce in the PMO of San Diego shows a considerable reduction. This is an important factor in the divergence of economic activity in these two cities.
San Diego follows the economic dynamics of the United States, which went through economic transitions several decades before they happened in México. San Diego has transitioned from an industrialized economy to one of services and commerce; the remaining industry is predominantly high-tech. As previously explained, this new direction of San Diego County emerged in the face of budget reductions for the defense industry and to recover from the crisis. The San Diego association of Governments (a planning agency dealing with economic development, transportation, growth, energy and public safety), along with economic development groups and local universities, promoted a strategy of cluster development5 in economic areas that have higher salaries.
As a result of that strategy, a restructuring of the San Diego economy took place, reoriented toward high-tech (Mercado, 2004). Tijuana, whose industrialization process began before the rest of the country's, has not diversified in the face of the global economic changes, although this, more than being a regional problem, is one of national economic policy.
The commercialopening (2000)
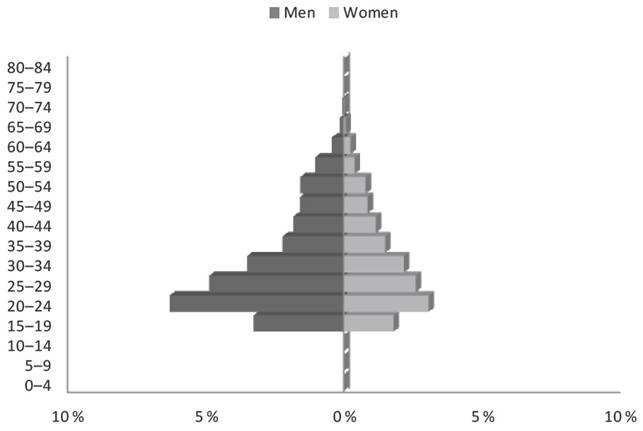
Graph 6 shows that in 2000, Tijuana had a significant redistribution in the EAP; the segments with the greatest percentage are between ages 25 and 34. When comparing previous graphs, the decline in the EAP as percentage is evident, as well as its growth in terms of people ages 45 to 69. Table 1, as previously seen, shows that in 2000 the EAP was 450 608 people, of whom 99.1 percent were employed and 66.8 percent were male. The economic areas that lead the local economy are the manufacturing industry, services, and commerce with 32.5, 29.1, and16.8 percent respectively, as previously seen in Table 3.
Source: Compiled by the authors with data from Inegi (2000).
Graph 6 Distribution by sex and Five-year age Groupings of the EAP in Tijuana, 2000.
This data shows the importance of the industrial sector, and how it came to be ranked first in terms of the size of its workforce. This can be explained because during this decade, Tijuana had the highest level of annual economic growth of all border municipalities (Anguiano, 2005). Thus, the regional and municipal economies grew because of the boost globalization gave the economy and the formalization of the North American Free trade agreement, or NAFTA (Díaz-Bautista, Avilés, and Rosas, 2003). This was a turning point in the protectionist system promoted in previous decades, and many Asian and European companies strengthened their presence to avoid being displaced from the U.S. market, turning Tijuana into a productive space with global interaction networks (López, 2004). NAFTA not only encouraged the manufacturing industry but also resulted in a significant increase in the cross-border health market as private medicine in Tijuana provided some health services for San Diego. In 1994, 250 000 border crossings were recorded for the purchase of medicine in the 1 700 pharmacies in Tijuana, while in San Diego-a larger city-there are a little more than 100 (Vargas, 2005).
The advantages of geographic location and availability of labor allowed an increase in export manufacturing, with implications for the Mexican economy in terms of manufacturing localization, the labor market, and economic integration with the United States (Mendoza, 2006). However, the changes in the manufacturing industry have more to do with international companies than with industrial or sectoral policies of integration with Mexican companies (López, 2004). This can be understood because in the 1990s, china lowered its labor costs and the transportation industry had advanced technologically to the point where oceans were crossed more quickly; thus, Tijuana's advantages of geographic proximity decreased.
Table 2 shows the EAP of Mexican origin in San Diego at 261 395, with 57.3 percent men and 42.7 percent women. Its percentage in terms of the total population of Mexican origin is 41.7 percent, and the employment rate is 91.7 percent. A marked reduction in the male percentage of the workforce stands out, with females continuing to gain ground in labor participation; the percentage of the EAP with respect to the total PMO fell nearly five points in 10 years. In Graph 7, the EAP age structure shows an increased female participation in the 45 and up age groups, while men are predominant in the younger age groups. In terms of type of economic activity, 38.7 percent were working in services, an increase of almost four points. Commerce was at 24.2 percent and manufacturing at 11.7 percent (Table 4). The percentages of those working in agriculture as well as manufacturing continued to fall because the San Diego economy was focused on biotechnology companies, communications, and the aerospace sector.
Source: Compiled by the authors with data from IPUMS (2000).
Graph 7 EAP by sex and Five-year age Groupings of the PMO in San Diego, 2000.
Between 1990 and 1998, cluster operations in San Diego increased 104 percent in biotechnology and pharmaceuticals, 101 percent in software and computing services, and 57 percent in communications (Alegría, 2007). In addition, the county followed the pattern of developed countries in outsourcing of the economy, which explains why related sectors form a larger part of the EAP.
This type of structure in the EAP of Mexican origin is explained by the creation of a bipolar demand for immigrant labor. This has a close relationship with manufacturing in the productive structure, in this case in San Diego, in an economy based on advanced technology and services that results in a dynamism in creating employment, both at the top and the bottom of the occupational scale (Leite, Angoa, and Rodríguez, 2009). This transformation in the U.S. economy required a growing amount of labor, diversified and suitable for the task, that would make integration of the expanding economic activity sectors feasible (Leite, Ramos, and Gaspar, 2003). Similarly, Giorguly and Gaspar (2008) explain that in spite of the over-concentration of Mexicans in low-skilled work, a variety of options and labor integration patterns are seen that correspond to the changes in migration history. This has been an important factor where migrants from the same place of origin perform the same economic activity, thanks to social networks that link places of origin with destination locations and foster the development of local labor niches (Durand, 2012).
The 2010 housing crisis
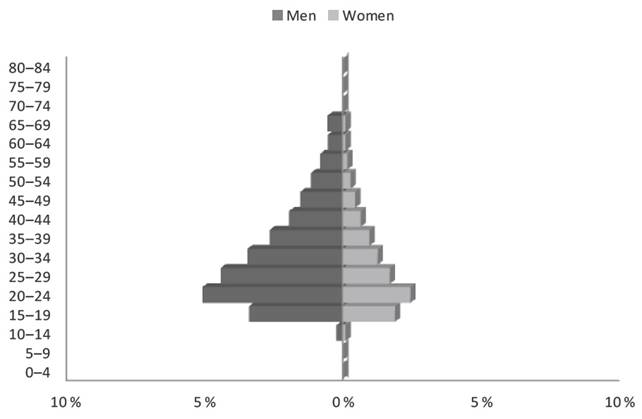
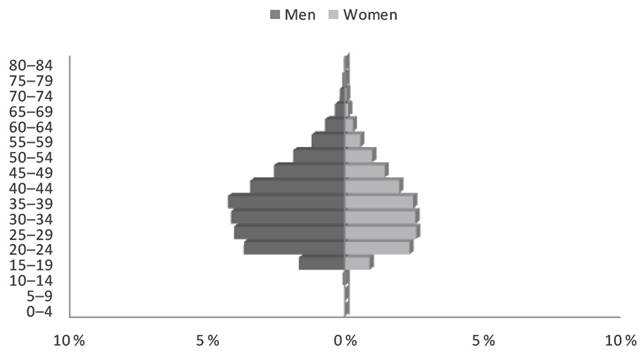
The Tijuana EAP, as seen in Table 1, surges to 696 907 people, 44.7 percent of the total population. The EAP is composed of 63.3 percent men and 36.7 percent women, and the employment rate is 94.7 percent. When compared with the previous census, the EAP percentage rose 7 points, while the employment rate fell 4.5 points. Graph 8 shows that there was not a significant change for men between 20 and 34 years of age; however, each five-year grouping of men goes up one point starting with the 35-39 age group. There is a similar growth for the five-year groupings of women starting with the 25-29 age group.
Source: Compiled by the authors with data from Inegi (2010).
Graph 8 Distribution by sex and Five-year age Groupings of the EAP in Tijuana, 2010.
The above is explained by the effects of the 2008 economic crisis in the United States and the strong trade relationship with México. This affects border transactions and remittances, which are part of the transmission mechanisms mentioned by Aspe (2009). These are: 1) fewer remittances because of the drop in employment for Mexicans in the United States, 2) impact on the price of oil and the amount of oil exported, 3) slowdown in the automotive industry, 4) diminished activity in the durable goods industry, 5) a steep decline in direct foreign investment, 6) fewer border transactions, and 7) a fall in tourism. As Tijuana's economic activity depends to a certain extent on trade and tourism, the drop in the employed population is consistent with the economic environment generated at the end of the decade because of the global financial crisis.
The EAP of Mexican origin in San Diego is 413 893, 45.8 percent of the total PMO, as seen previously in Table 2. It is 56.1 percent male and 43.9 percent female. The percentage of working women keeps growing, encouraged by the ease of labor integration. Furthermore, the continuous loss of purchasing power in México and the rise in unemployment caused women look for work in order to meet household expenditures.
The employment rate is 87.1 percent, a clear reduction from 2000. As seen in Table 4, services employed 40.5 percent of the EAP, commerce 25 percent, and construction 11.1 percent. Activities that absorb greater male labor are agriculture, construction, manufacturing, and transportation. In terms of the structure by age-in contrast to the Tijuana EAP-the increase seen in five-year age groupings begins starting with the 40-44 group in men and women. Also, the reduction in the participation of those ages 20 to 39 is clearer. As shown in Graph 9, this involves a drop in international migration predominant for these ages.
Source: Compiled by the authors using data from IPUMS (2010).
Graph 9 EAP by sex and Five-year age Groupings of the PMO in San Diego, 2010.
In the development of this work, the importance of services in the economic structure of San Diego during the period studied has been underlined; however, it is worth mentioning that this sector and the PMO have gone through a series of internal transformations shown in Table 5, with an increase from 33.8 percent in 1970 to 47.5 percent in 2010 in professional and related services such as health services, legal consultation, engineering work, and academic research, in addition to a drop in personal services such as the ones taking place in homes, hotels, laundries, repair shops, and funeral homes, which fell from 33.1 percent in 1970 to 14.7 percent in 2010. This pattern is explained in part by the general economic structure of San Diego and is bolstered by the border context, which develops processes of innovation and business learning that strengthen the competitive performance of local industry (Cabrera et al., 2008). Similarly, in the technology clusters that predominate in San Diego, labor specialization is important, contrary to what occurs nationwide, where major sectors such as agriculture and construction use lower-skilled workers.
The drop in the PMO employment rate may be understood by two events that marked this decade: 1) the hardening of U.S. migration policy after the terrorist attacks of September 11, 2001, and 2) the financial crisis caused by the real estate bubble in 2008. These events caused a return to México of migrants who left the United States due to lack of work or because they were deported (Alarcón et al., 2009). In spite of the increase in deportations, the growth of the population of Mexican origin remained equal to that in 2000; this is explained by Mexican migrants' integration into social and labor networks that have been created over the years, which provided them with the options of changing industries and moving to other locations. While the construction sector may have been the one most impacted by the crisis in the United States, it saw a slight increase, in relative terms, of the PMO who work in the sector.
Conclusions
Between 1970 and 1990, the evolution of the EAP in Tijuana and that of Mexican origin in San Diego was heavily influenced by the Border industrialization Program, the economic opening in México, and the intense migratory flows that these events brought about. In Tijuana, this change is seen with the considerable decline in the percentage of females ages 15 to 29 years in the EAP over two decades (in five-year age groupings), where the percentage of women in other age groupings went up, resulting in a generally more even distribution by age group. The change between 2000 and 2010 brings about a smoother configuration in the graph representing 2010 data, with a decrease in the percentage of men and women of younger ages and an increase starting at age 35 for men and 25 for women, modifying the graphical form of the EAP to a more oval shape. In terms of the areas of economic activity that absorb the Tijuana EAP, there was a drastic drop in agriculture, with only 0.6 percent in 2000; there was a considerable rise in people working in manufacturing, reaching 32.5 percent of the EAP, while commerce and services did not have significant changes.
The EAP of Mexican origin in San Diego, like the EAP in Tijuana, underwent significant structural changes, going from being a fragmented group in 1970 to a more homogenous one in 1990. This was a result of the migratory pattern that went from being a temporary workforce to a more permanent and homogenous one in terms of gender; playing a role was the migrant legalization brought about by the 1986 Simpson-Rodino Act. Female participation in the EAP in San Diego changed substantially during these decades. However, starting in 2000, the change is slower and it occurs mainly in the groupings starting at age 40, as seen by Graph 9's having more of an oval shape, very similar to the one representing the EAP in Tijuana; this is probably the result of the drop in international migration and the rise in deportations. The EAP of Mexican origin in San Diego differs from that in other places, as the county, unlike most others, is geared toward technological clusters; this redirects the EAP of Mexican origin to these areas of employment and away from sectors where the PMO traditionally works. This shows how the areas where the EAP works changes as the economy evolves, mainly with a drop in participation in manufacturing and agriculture and a marked rise in services and commerce.
San Diego County has been a pioneer in economic policy changes in terms of redirecting its business activity, successfully developing technological clusters while facing the decline of the defense industry; in this way it continued to be a pole of attraction for internal and external migrants and cross-border commuters. PMO occupations then follow this trend; the economic areas that absorb the EAP of the PMO are mainly in the tertiary sector, while in Tijuana the manufacturing industry continues to employ the most workers.
In this context, the municipality of Tijuana, whose economy has been more tied to the secondary sector, continues to provide San Diego with a flow of formal and informal workers and potential consumers. This last factor, of spending, is the area's most prominent economic contradiction, where Tijuana residents who are able to cross the border head north to buy products unavailable in Tijuana or ones at lower costs, while San Diego residents head south looking for lower prices for other goods and services, such as medical care that is friendlier to their pocketbooks. A big question mark remains about the effect of demographic and economic changes on these behaviors.
In the reordering of the global economy, geographic proximity was shuttled to a secondary role because of transformations in the transportation industry that brought down costs; while this is an important factor affecting the movements of cross-border workers and consumers, changes in this area must be continuously re-evaluated.
Further study is needed to find answers to old questions in terms of the changes in labor and trade f lows in this region-one of the most dynamic in the global arena-and in turn to identify the new questions brought about by the changes, which are becoming more and more frequent and lasting shorter periods of time.
Suggestions for policy makers are: 1) to seek agreements that bring about greater regional integration, 2) to promote innovation in economic policy proposals that address the EAP's new structure and the cross-border demographic dynamic, promoting job creation for women and seniors who are increasingly working longer, and 3) to develop sub-sectors in the services sector to integrate population demands such as education, employment, and health.

