


Services on Demand
Journal

Article
 text in
  English (pdf)
 Article in xml format
 Article references
 Send this article by e-mail
Indicators
 Cited by SciELO
 Related links
 Similars in
SciELO
Similars in
SciELO Share

 Permalink
Estudios fronterizos
On-line version ISSN 2395-9134Print version ISSN 0187-6961
Estud. front vol.16 n.32 Mexicali Jul./Dec. 2015
Articles
The economic value chain of wine in Baja California, Mexico
Salvador González Andrade*
* El Colegio de la Frontera Norte, Departamento de Estudios Económicos. Address: Carretera Escénica Tijuana-Ensenada, Km 18.5, San Antonio del Mar, C.P. 22560, Tijuana, Baja California, México. E-mail: salvador@colef.mx
Received: December 10, 2013.
Approved: October 27, 2014.
Abstract
Recent economic policy debates have centered on increasing and quantifying the value chain, and the objective of this research is to characterize the value chain of vitiviniculture in Baja California according to organizational subsystems, including management, marketing, quality, productivity and environment. This study presents a comparative analysis between the capabilities of the vitiviniculture industry and sectors within which it participates. The analysis shows that the primary issues are related to sectors that have weak productive infrastructure, marketing problems, product shortages and few local suppliers, and additional problems include insufficient funding, water shortages and high taxes. Moreover, investments in human capital are required to train human resources.
Keywords: competitiveness, innovation, wine cluster, agro-food industry, horizontal flowchart value chain.
Introduction1
Increased competitiveness is a primary factor in the current economic globalization environment at both the national and regional levels. In Mexico, the wine industry has broad prospects for growth, and a 12% average annual increase in domestic wine consumption is projected for the coming years. Domestic wine production barely accounts for 30% of the country's demand, and the wine trade balance has a deficit of 181.3 million dollars. In contrast, Chile has a wine production surplus of 1.0892 billion dollars (2011 data, Food and Agriculture Organization of the United Nations [FAO], 2013).
The quality of wine from Baja California, where approximately 90% of the national production is concentrated, is internationally recognized and earned over 400 international awards according to the Consejo Mexicano Vitivinícola [Mexican Board of Wine], 2010. In Baja California, the area cultivated with grapevines ranks tenth at 3,735.38 ha (one third of the available potential), with approximately 90% of the grape production intended for winemaking. The wine valleys of Baja California are located in the municipalities of Ensenada, Tecate, and Tijuana. Of the 195 grapevine production units, 166 are located in Ensenada alone. In addition, 90% of the cultivated area is concentrated in the regions of Valle de Guadalupe, San Vicente, Santo Tomas, Uruapan Ejido, and San Antonio de las Minas, and all of the wine production in the region occurs in these valleys. The area dedicated to the grapevine cultivation exceeds the combined areas of Colima, Nayarit, Aguascalientes, and Morelos. Even though, weather conditions that include low rainfall levels and scarce water and the farming conditions limit production2 to less than 10 tons of grapes per hectare, these conditions provide the grapes with a higher concentration of sugars and better physical and chemical characteristics that are representative of high-quality wines. Thus, it is important to increase the competitiveness of the vitiviniculture sector by analyzing the structure of the value chain of wine production companies in the region.
The objective of this paper is to describe the wine value chain and identify the main problems that affect small and medium producers. Such investigations are the first step toward recommending mechanisms, techniques, and strategies to reduce production costs, increase differentiation, and expand markets for the wine trading houses in Baja California.
The methodology consisted of a literature review, with two surveys performed to define the typical chain or horizontal flow pattern of the wine value chain. The costs of producing a bottle of wine were estimated, the wine distribution in the state was analyzed, and graphs with empirical values were constructed. Finally, an analysis of the above information was performed, which identified several of the major problems affecting winemakers, such as weak production infrastructure, few local suppliers, middlemen and supply problems, inadequate human resource training and development, insufficient funding, water shortages, and high tax burdens.
The paper is organized as follows. In the first section, the theoretical framework of the value chain and its relationship to regional development is disclosed. The second section describes the major wine companies in Baja California, and the third section highlights the methodology used for the two surveys, which collected information on the production and distribution of wine. The fourth section includes a diagram model and three basic types of value chain and presents an analysis of the costs of producing a bottle of wine and selling and distributing wine and the main problems affecting wine producers. The final section presents a series of conclusions.
The value chain and its impacts on economic development
The value chain
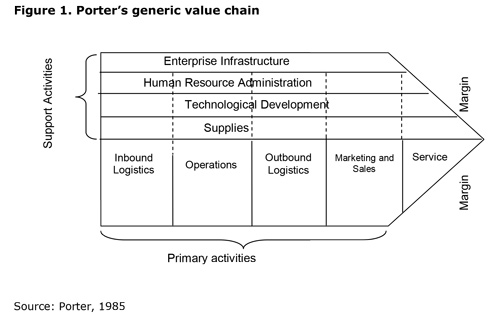
Initially, Porter (1985) suggested that analyses of sources of competitive advantage must be performed according to the level at which the company performs regional and national activities, such as designing, producing, marketing, delivering, and backing up their product. Porter indicated that each company has an activity chain that adds value to its customers, and sources of long-term sustainable competitive advantages may only be determined through careful and thorough analyses of this "chain." In addition, he proposed that corporate managers must redirect their strategic analyses towards the value chain before selecting the best strategy. The "generic" value chain of all companies consists of primary and secondary activities: primary activities include the process production, sale and delivery to the buyer as well as post-sales support, and secondary (or support) activities support primary and secondary activities by providing input, technology, human resources, and various business functions. According to Porter, there are five primary activities and four secondary activities, which are shown in Figure 1.
The value chain includes all relationships within the process, and they begin with the supplier and end with the customer, thus highlighting the relationship between the company and its suppliers. This methodology classifies strategic activities within the company to understand the behavior of production costs and differentiation sources and determine whether costs should be reduced or differentiation sources should be increased, with the latter understood as differences that are established to provide a unique and valuable product to buyers beyond low prices. Thus, the value chain is geared to meet market demands and create differentiated products with a higher value and promotes a shared commitment to meeting market requirements regarding quality, traceability, volume, and frequency. This chain supports an extensive flow of information and knowledge and coordination among relationship and roles and clearly defined rules. Similarly, value-added activities are performed in the process of creating and consuming a product. This process can be viewed as a complex value system, and at least four value chains can be identified: suppliers, business, channels, and customers.3
Analyses of value chains are important because competitive advantages are created from product differentiation and cost reduction. To achieve these benefits, the use of modern technologies, innovation, and specialized factors are necessary, with the latter arising from specific skills derived from knowledge, the unique legacy of "know-how" technology, specialized infrastructure, research, human resources training, developed capital markets, and high public support service coverage. The current environment is characterized by global markets and extensive open trade; therefore, Mexican producers compete with a significant number of foreign products, some of which have low prices. An increase in domestic supply results in lower demand for domestic products; therefore, it is urgent to develop product differentiation.
Regional economic development: value chains and competitiveness
Economic development is based on the allocation and efficient use of resources, potential represented by these resources, and the organization of production, dissemination of knowledge, and other attributes used to define a specific level (Vázquez, 2005, p. 38). In particular, endogenous development incorporates a territorial approach in which productive activities are conducted according to the availability of resources. In addition, the goal is to meet local needs and demands through participation by the local community. Therefore, endogenous development is considered a more comprehensive strategy that is designed to improve local production systems within national or international industries and increase the economic, social, and cultural well-being of the entire population (Vázquez, 2002, p. 22).4
The objective of competition is the sustainability of productive activities. This concept is important when developing and improving the strengths and capabilities of the supply chains in a specific region.5 Competition occurs between firms and individual companies as well as between entire production systems, supply chains, or value chains. Such competition creates business relationships between independent production agents (suppliers and producers) and forms a system based on trust and mutual understanding in anticipation of changes in the operational environment (Vivanco, Martínez, and Taddei, 2010, p. 170).
Qi, Zhao and Sheu (2011) analyzed the relationships between competitive strategies, supply chain strategies, and business results or developments according to the moderating effects of environmental uncertainty. This analysis involved the co-lineation of the supply chain strategy and competitive strategy (for product differentiation or reducing prices) with the environment to improve performance.
Similarly, Moguillansky, Salas, and Cares (2006) provided elements to improve policies and instruments to ensure competitiveness, and they performed an assessment of the innovation ability of two Chilean food chains, one of which is the wine chain. They analyzed the competitiveness of the industry according to its behavior by studying the characteristics of the value chain, economic environment, and market as well as the performance innovation of the major competitors in the global market. They then built a model of the innovation system, which is concentrated in seven interrelated points of analysis: business strategy, innovative practices, knowledge network creation, technological alerts, resource availability, environmental conditions, and outcomes. Based on the model, they developed a methodological instrument to collect qualitative and quantitative information that included useful variables to characterize the state of the innovation system.
In analyses of a production system, it is appropriate to apply transaction costs theory as it conforms with realism and precision to the value chain approach.6 This theory analyzes alternatives for organizing inter-business relationships that are best suited to the characteristics of each exchange to minimize risks and costs. The system involved must lower costs according to the environment in which it develops (laws, rules, customs, and society), (Iglesias, 2002).
Fischer, Hammond, Obermeyer, and Raman (1994) studied supply and demand in an uncertain world, and they indicated that global competition accelerates the development of products and flexible manufacturing systems. Manufacturers and retailers can considerably reduce the cost predicting errors by including a "detailed response," which is a new approach for predicting planning and production process. Companies can improve their forecasts and simultaneously redesign their planning processes to minimize the impact of inaccurate forecasts. By increasing the speed and flexibility of the supply chain, managers can postpone decisions related to the most unpredictable elements until they have begun receiving market signals. The results of early-season sales can help correctly match supply and demand.
In addition, Lee (2004) stated that the supply chain must meet key concepts that correspond to a "triple A" (agility, adaptability, and alignment) supply chain. Agility represents the ability to smoothly respond to and manage short-term changes in demand or supply and external interruptions, adaptability represents the ability to adjust the design of the supply chain to meet structural changes in the market and modify the network of product sourcing strategies and technologies, and aligning represents the ability to create incentives for better performance.
In addition, Lee (2010) suggested that improving environmental sustainability requires companies to adjust their supply chain and rethink their processes from beginning to end. Companies should adopt a holistic approach to sustainability and pursue broader structural changes throughout the supply chain. These changes may include radical innovations in production processes, development of fundamentally different relationships with business partners that can evolve into new service models and even collaboration with several companies to create new industry structures, reinvention of the manufacturing processes, and connections to competitors to meet the challenges of scale. The results may produce a greener supply chain that requires less capital and much lower operation costs, which would provide a competitive advantage.
Finally, Sánchez (2002) examined the organizational model of wine production systems and impacts of this structure on the enterprise's productivity and competitiveness in the Valle de Guadalupe in Ensenada.
Vitiviniculture in Baja California
Viticulture companies7
Although grape cultivation in Baja California dates back to the time of the Spanish conquest, when it was introduced by the Jesuits, Bodegas de Santo Tomas is the only company that has been in operation since the inception of the local wine industry. One of the most traditional wine companies is L.A. Cetto, which was founded in 1930, while most of the organizations that are on the market began in the 1970s and 1980s, including Monte Xanic, Chateau Camou, Casa de Piedra, Mogor Badan, Cavas Valmar, Adobe Guadalupe.8
Currently, the contribution of viticulture to the state economy, employment, and coverage ranks eighth in significance. In 2008, grape cultivation accounted for 3,610 ha, with 2,918 ha harvested, and the average productivity was 5.49 tons per hectare, with a production value of 133.61 million pesos and accounting for 1,638 jobs (Sepulveda, 2009, p. 17). By 2010, the areas cultivated with grapevines accounted for 3,735.38 ha.
In Baja California, the area covered by grapevines is located in four of its five municipalities. Ensenada contributes 89.94% of the cultivated area (3,359.75 ha.) and is followed by Mexicali with 7.29% (272.23 ha.),9 Tijuana with 1.79% (66.90 ha.), and Tecate with 0.98% (36.50 ha.), (Sefoa, 2011).
Of the cultivated areas in the state, 2,904.40 ha (77.75%) are allocated to winemaking. However, approximately 8,000 ha have the potential grape cultivation. The inventory contains 46 different varieties in production that have different origins (mainly Spanish, French, and Italian).
In Ensenada, vine production is located in six wine regions, and Valle de Guadalupe has the largest cultivation area for wine making (46.61%). Next is Valle de San Vicente (34.19%), which is followed by Santo Tomas (6.9%), Ejido Nuevo Uruapan (3.44%), San Antonio de las Minas (3.34%), Ojos Negros (1.52%), and other areas (4.00%) (Sefoa, 2011, p. 26).
Primary production is conducted by a large number of producers: 14 producers that have growing areas of 50 or more acres and account for 1,250.85 ha of crops (46%), 22 small and medium producers that have growing areas between 20 and 49 ha and account for 696.04 ha (28%), and 132 producers that have growing areas between 1 and 19 ha and account for 741.62 ha (26%) (SPV, 2008).
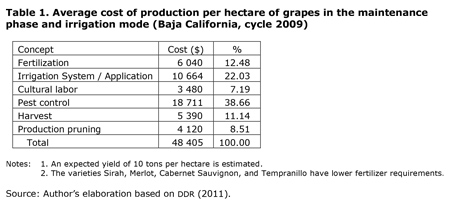
Table 1 show that the costs of grape production in the maintenance and irrigation phases10 amounted to 48,405 pesos per hectare in 2009, which had an estimated performance of 10 tons.11 High expenses are primarily caused by pest control and irrigation systems, although the costs of fertilization, harvesting, pruning, and cultural labors contribute to the expenses as well (DDR, 2011).
Wine production
There are approximately 57 vineyards in the region, and most are organized in the Sistema Producto Vid (Vid Product System) (VPS) in Baja California, which includes 47 partners and 10 non-unionized companies.12 The following vineyards are highlighted: Acrata, Adobe Guadalupe, Alborada Guadalupe, Baron Balché, Bibayoff, Bodegas San Antonio, Bodegas de Santo Tomas, Casa de Piedra, Casa Domecq, Cavas Valmar, Chateau Camou, Jala, L.A. Cetto, Mogor Badan, Monte Xanic, Roganto, Viña de Liceaga and Vinisterra.
Wine production accounts for approximately 9,000,000 L, which amounts to 1,005,000 cases of nine bottles each. According to the latest data from VPS (2008), the production by company size is as follows: three large trading houses concentrate 82% of the wine production in the region (821,000 cases); three medium-sized companies have a production of 120,000 cases (12%); 25 small companies, which use artisanal techniques in the production process, have an annual production volume of 59,000 (5%); 26 micro-enterprises have a production of 5,000 cases (1%). These companies combine handcrafted and modern techniques in the wine making process.
The oenological "schools" have different origins, such as Spain, Italy, France, Chile, Argentina, and Switzerland. In Ensenada, 83.18% of the farmland (2,794.75 ha) is intended for the production of wine grapes, with the remainder for table grapes. Seven varieties of wine account for more than half the area, including Cabernet Sauvignon (20.23%), Chenin Blanc (6.77%), Merlot (6.69%), Tempranillo (5.43%), Nebbiolo (5.26%), Grenach (4.14%) and Chardonnay (4.04%).
Historically, the export price of Mexican wine has followed a steady upward trend, increasing from approximately half a dollar per liter in the 1960s and 1970s and reaching US $ 4.43 per liter at the present time. This increase in the average export price reflects a market orientation towards higher quality wines and greater competitiveness.
International wine export prices indicates that Spain and Chile are the main competitors for Mexico. These countries boast an extremely low price at 1.33 and 2.55 dollars per liter of wine, respectively. To a lesser extent, the price of Mexican wines is competitive with that of Italy, Germany, and Portugal. Table 2 shows the average prices of wines exported from Mexico and the main competitors at different times.
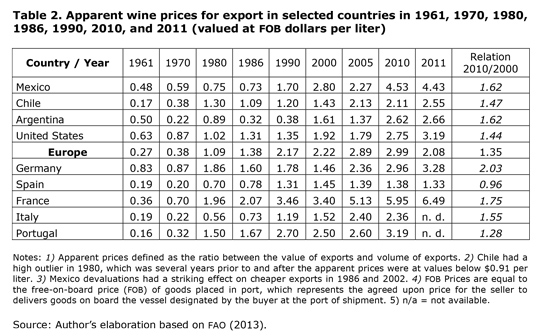
Wine prices from Argentina have fluctuated, although they have remained at a relatively low price compared with that of Mexico, the United States, and Chile (until 1999). In Europe, Spain and Italy have maintained a policy of relatively low prices compared with that of Mexico. Currently, Mexican wines are approximately three times more expensive than Spanish wines and approximately twice as expensive as Italian wines, whereas the prices of German wines are approximately a third cheaper than Mexican wines. However, France has followed a systematic and consistent trend over the second half of the past century and strived for high-quality wines at relatively high prices. Although the gap between the average price of French wines and Mexican wines has tended to decline, wines from France are approximately 30% more expensive than those from Mexico.
In 1990, domestic wine producers shifted to the high-quality wine market, which is labeled as Premium Wine. This quality policy has maintained new enterprises and acknowledged Baja California wine as having high quality in the market. To date, this wine-producing region has more than 300 international awards.13 The domestic market has also acknowledged the quality of domestic wine, which is gradually gaining grounds against imported wines, especially those from Europe.
Nevertheless, the current participation of Mexican wine in the domestic market is only 30% with the rest of the market covered by imported wines characterized by lower prices (lower than 100 pesos), especially Chilean wines. Viticulture in Baja California offers valuable opportunities. First, according to estimates from Mexico's National Wine Council (2012), the table wine market has been growing at average rates of 12% annually over the last decade, and a conservative expectation predicts that this trend will continue for several years more. In addition, the wine industry of Baja California has the potential to participate in a larger segment of the domestic market.
Methodology
Certain elements of the methodology proposed by Lundy, Gottret, Cifuentes, Ostertag, and Best (2004), who formulated a process of building various strategies to increase the competitiveness of productive chains with small-scale producers, are considered here. These authors also proposed that working groups should be developed with producers to identify strengths and weaknesses in the value chain and develop strategies to increase competitiveness.
In recent studies and interviews with key informants, fieldwork was undertaken and two surveys were performed. The first survey occurred in 2011, and information on 25 small and medium winemakers was collected. The second survey occurred in 2012, and information on 24 wine distributors from the region was collected. This information was used to build the generic (horizontal diagram) and empirical structure of the value chains within the wine industry, estimate the costs of producing a bottle of handcrafted wine, analyze the distribution of wine, and identify problems in the wine sector.
Identification of Baja California value-chain winemakers
Based on the pattern recorded in the Vine Growers Product System of Baja California, a random sample of 25 small and medium winemakers from the municipality of Ensenada (approximately 40% of the 57 winemakers in the 2008 census) was selected. A survey was distributed to the selected producers in 2011 to identify the value chain of the company. The primary research questions were as follows: Is it possible to reduce the production costs without affecting the quality of the wine? What are the value chain segments facing the biggest problems where corrective actions would be required? These questions identified the main accomplishments and problems in developing wine production and determined the competitive and non-competitive segments of the wine production value chain.
Survey of wine distributors in the region
The second survey collected information for an analysis of the wine distribution process in the region. The survey was conducted in June 2012 and distributed to 24 wine distributors located in the municipalities of Ensenada (5), Mexicali (5), Tijuana (11), and Playas de Rosarito (3). The survey was used to estimate the participation of Mexican wine in the domestic market, price ranges of the most frequently sold wines, and the main grape varieties. In addition, the survey was also useful for identifying the main problems in the distribution channels and acquiring solutions and recommendations from the wine distributors.14
Construction of the value chain of Baja California winemakers
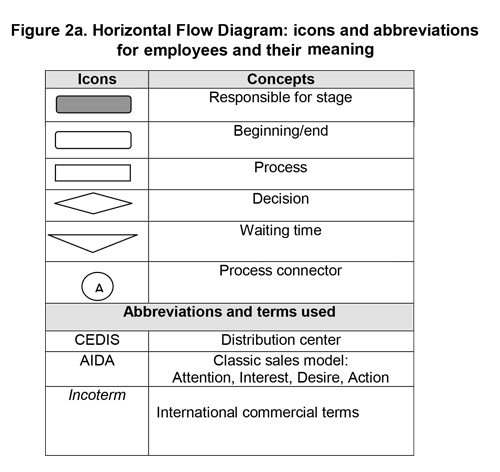
The wine making process is illustrated by a horizontal flow diagram of the value chain (Figures 2a and 2b). In this diagram, the primary and secondary stages of the wine value chain are identified along with the responsible parties in each stage, such as the harvester, lab worker, distribution center operator, and consumer. Although the diagram is extensive and detailed, to facilitate its reading and comprehension, six icons are used, and an explanation of each icon is included in Figure 2a. For example, when deciding whether white, pink, or red wine should be produced, a specific process must be followed, which includes deciding whether to add sulfur dioxide or sulfite. Thus, the type of wine to be produced determines the steps in the process. For example, for reserve red, the wine must be placed in barrels for oxygenation, although certain white or pink wines do not require this step; therefore, process connectors must be used (A and B). The icon timeout is only used to illustrate the step for aging.
Costs of "handcrafted" production per wine bottle
There are several factors that directly influence wine production costs, such as the type of technology used, volume of production, and type of wine to develop. Based on Lagos, Espinoza, and Rojas (2010), the costs of producing a bottle of wine from "x" variety in US dollars using artisan technology (non-industrial large volumes) were estimated. The supply prices were updated in 2012 and obtained by direct information from distributors, such as "the article distributor for wine and olive" (Duarte, 2012).
The average cost of a bottle of wine was estimated as follows. Production of 500 L of low-cost or premium wine, which directly influences variable costs, was considered. The cost structure has three components: 1) assets, which include general pre-operational expenses and investments in fixed assets that assume an average annual depreciation of 20%; 2) variable costs, which include raw materials, supplies, and labor, and 3) administrative costs, which include rent, electricity, water services, insurance, and records.
Wine aging is a long and delicate process designed to impart different characteristics to the wine.15 To produce a wine of premium quality, costs related to aging include the use of oak barrels for a 12 month period, which assumes that the barrels depreciate by 100%.
The producers from Baja California use Bordeaux barrels with a capacity of 225 L. Based on prices and preferences, an average of two thirds American oak and one third French oak are used. This proportion is referred to as a "standard barrel."
Results
Value chain of Baja California winemakers
The horizontal flow diagram of the value chain of Baja California wine shows the 12 stages that are considered most relevant throughout the entire process (Figure 2b). These stages are placed in the column on the left side of the diagram and the most important steps for the corresponding stages were placed on the right side along with elements or individuals responsible for conducting such processes. The initial stage is wine grape (vintage) harvesting, in which a winemaker initially analyzes the grape's maturity, then harvests the fruit and ships it to the storer. The second stage is grape crushing, and the grinder is responsible for stripping and selecting the stalk. The third step is pressing the grape clusters, followed by mixing the wine yolk, and decanting the product, which separates solids and liquids. Barreling is the fourth stage in the process, and the operator is responsible for pouring the grapes in barrels and withdrawing the must. The fifth stage is sulfiting followed by fermentation,16 racking, and other stages that add value until bottling and labeling. Distribution and marketing and the next stages, which are the responsibility of distribution centers (DCs).
Major decisions occur during the commercialization of wine, such as whether to export the product to domestic or foreign markets. If the product is exported, the process will continue to the phases of import declaration, analysis of international trade terms (Incoterms), payment of taxes, development of commercial invoices, and acquiring a certificate of embarkation before arriving in the hands of the consumer. If the product is oriented to the domestic market, the process continues to the phases of customer identification; candidate evaluation; pre-entry work; attention, interest, desire, and action messages (AIDA); and post-sale services offered to the final customer.
Empirical value chains of wine
Small and medium sized wine companies primarily use family labor, and 75% of these companies only have one employee and approximately 19% have four to six employees. Additionally, certain companies have specialist consultants, including engineers and/or ethnologists, and relatively few provide training and promote wine culture to their workers.
The winemakers in Baja California are grouped into three types: wine growers, winemakers, and vintners. The development of the value chain is segmented by the size of the producers to identify internal factors in the company that determine its position in the market (supply, technological development, human resources, enterprise infrastructure, operations, logistics, marketing, and sales). Correct interpretations can identify the activities that create value or cause losses to the company. Based on the results of the survey applied to winemakers, three graphic diagrams were constructed (see Figures 3, 4 and 5) showing the added value chain. Figure 3 displays the four main links of the chain, which can be analyzed by building a value chain for each link. Figure 4 shows certain relationships between producers, consumers, and intermediaries.
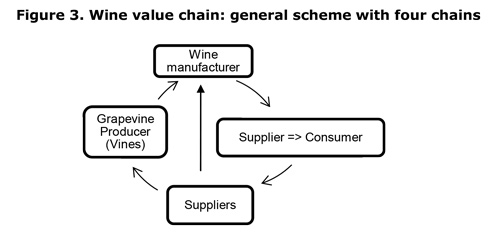
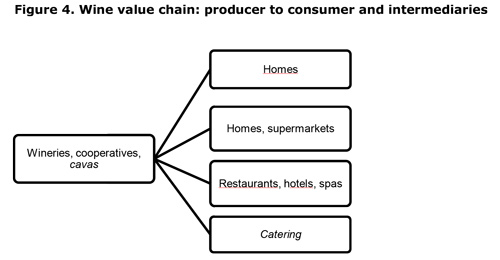
Figure 5 shows the basic process of transportation and follows wine from the cellar or manufacturer to the final consumer. From the basic diagram, different variations and combinations are observed depending on the volume of production and marketing channels. In small and medium cellars, the transportation process may include multiple combinations of steps or intermediaries that take the product from the cellar to the end consumer. For medium and large cellars, the product can follow routes that include a logistics operator or the process could be simplified by directly joining the producer with the final consumer. Certain producers rely on promotions and virtual sales by using the web and internet. Because different methods can be used to retail the product at the end of the chain, by increasing the number of commercial channels, sales opportunities are increased. The direct channel of the cellar to final consumer would be the most desirable and recommended because it can increase the income of wine producers. Although the direct link is the most efficient, other retail methods should not be neglected.
Artisanal production costs per bottle of wine
The process of artisan winemaking involves at least three groups of costs: total assets (including pre-operational and investment costs), variable costs, and variable administrative expenses. The general pre-operational expenses amount to $600, and the investment in fixed assets, such as scales (from 2 to 100 kilograms), calculators, weighers, pH tape, buckets, hoses, stirrers, funnels, and "tocuyo" fabric, amount to $189 or $37.8 dollars a month considering an average annual depreciation of 20%.
Variable costs add up to $2,094.45 and consist of raw materials and supplies (US $1,994.45) and labor ($100, five employees at $20 each). The costs of raw materials and supplies include grapes, bottles, corks, sugar, caps, cotton, bio-pectinase, potassium carbonate, yeast, sodium bisulfite, and detergent. One kg of grape produces approximately 650 mL of wine. Because approximately 800 kg of grape are required to produce 500 L of wine, the grape represents approximately 50% of the variable costs, which is shown in Table 3.
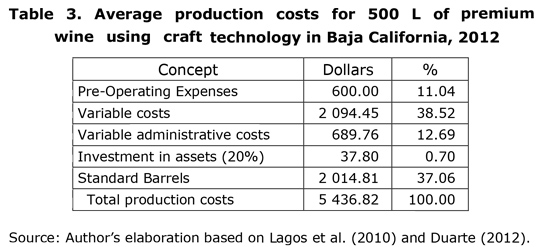
In addition, variable administrative expenses include payments for rent, electricity, water services, insurance, and records, which total $58.48 dollars monthly or $689.76 dollars annually. The wine produced up to this stage is fit for consumption and include wines of lower value. However, it is possible to improve the quality by aging.
Baja California winemakers face difficulties because of low water availability. Water scarcity in the region requires producers to adopt what Lee (2010) referred to as a holistic approach to sustainability and promote broader structural changes. To increase competitiveness, wine producers are focused on niche markets in which they offer a differentiated product, higher quality wine or premium wine. Producers incorporate various improvements and distinctive elements in the production process to develop innovation systems in their enterprises as suggested by Porter (1985) and Moguillansky et al. (2006). Similarly, to improve performance and reduce environmental uncertainty, the supply chain strategy and competitive strategies are co-lineated by product differentiation or price leaders (Qi et al., 2011).
In the aging process, the length of time that the wine stays in the barrel can average between 6 to 18 months, depending on the age of the barrels.17 Extended processes enhance the characteristics of the wood transferred to the wine and result in a loss of fruit. To obtain a quality premium wine, at least 12 months of aging in new oak barrels is required. The cost to produce Bordeaux oak-barrel "type" (2/3 American and 1/3 French) wine is $2,014.81 dollars.
From 500 L of wine, 666 750 mL bottles are obtained. Therefore, the average cost in 2012 of producing a bottle of premium quality handcrafted wine was $8.2, and the cost of producing a bottle of wine without aging was $4.2. At a commercial rate exchange of 13.2 pesos per dollar, the average production cost of a bottle of wine is approximately 55 pesos without aging and 108 pesos for premium quality.
Wines distributors in the region
Of the total number of conducted surveys, 17 correspond to liquor distributors, 6 correspond to restaurants and wine-bars, and 1 corresponds to a retail chain. The results indicate that of the participating companies, 84.4% offer domestic wines, with 95.6% of the sales accounted for by wines from the Baja California region and only 4.4% of the sales from the rest of the country. Imported wines represent 15.6% of the sales, with 34.8% from Chile, 21.7% from Argentina, 17.4% from Spain, and 8.7% from the USA. Red wine has the largest share of sales (75.5%), and the main varieties are Cabernet Sauvignon (51.1%), Merlot (18.0%), Tempranillo (16.4%), Petite Syrah (3.6%), and mixed reds (3.6%). White wines present a minor contribution to the market (15.9%), and the main varieties are Chardonnay (26.9%), Chenin Blanc (25.0%), mixed white (16.4%), Sauvignon Blanc (13.6%), and Colombard (9.5%). Pink wines have a reduced market share (8.6%), and the most common varieties are mixed (29.4%), Grenach (28.2%), Zinfandel Blanc (16.3%), Zinfandel (13.9%), and Merlot (2.9%).
In 79.2% of sales, the bottle of wine costs over 150 pesos, and only 12.5% of sales are less than 100 pesos. Red wines are more expensive than white wines, but the price range is wide. According to nearly 80% of the respondents, the price of red wine can be nearly 50% greater than the price of white wine.18
Regarding marketing strategies, approximately 74% of the wine distributors advertise on a website. Nevertheless, approximately 20% of the respondents indicated that regional wine marketing requires additional promotion and new market exploration and stated that the culture of wine consumption must be promoted through workshops.
In relation to marketing wine produced in the region, wine distributors indicated that major supply problems occur with regards to time of product delivery, quantity of product, and training of employees in charge of the distribution. These distributors also indicated that middlemen are occasionally used between producers and distributors. Such issues indicate that the supply chain must be improved in at least two areas, and manufacturers and retailers must include a "precise response" to planning and throughout the production process (Fischer et al., 1994). In addition, the supply chain must address the triple "A" concepts of agility, adaptability, and alignment (Lee, 2004).
Nearly 50% of wine distributors indicated that high taxes and high prices for wine produced in the region are restricting the sales of the product. Therefore, the government can support the wine industry by lowering taxes and providing assistance to meet tax obligations and financial support, which will help increase the position in the market of wines produced in the region.
Problems faced by wine producers from Baja California
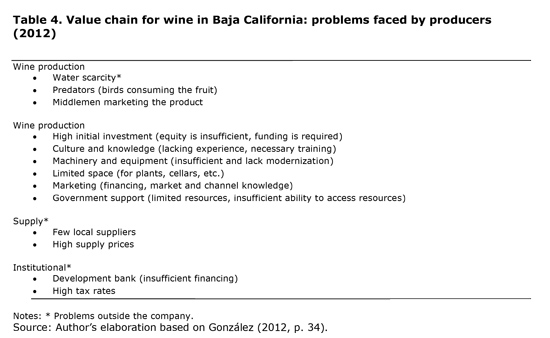
In the development of viticulture, producers in Baja California face a wide range of problems that can be divided into two groups: internal to the company and external to the company (institutional). Internal problems highlight different weaknesses, such as a lack of financial resources, need for modern equipment and machinery and reduction of bargaining power and product distribution capacity.
External problems affect the wine sector at a global level. For example, water shortages directly impact soil salinization and the quality of wine, lack of local suppliers result in high prices of supplies, poor government funding and high taxes (at a similar level to those charged to other beverages with higher concentrations of alcohol, such as distilled beverages) reduce competitiveness. These limitations require broad participation and an organized response by entrepreneurs, the academic and research sector and three levels of government. Table 4 shows a summary of the main problems that affect winemakers.
Conclusions
Approximately 90% of the wine consumed nationwide is produced in the region of Baja California, and just over 50 commercial firms produce this wine. The analysis of the wine value chain is useful for increasing regional competitiveness through cost reductions and product differentiation. This paper constructed a horizontal flow diagram scheme of the wine value chain that was used to identify strengths and weaknesses in the production process stages and propose corrective actions that should be promoted by those responsible in each stage.
Based on the volume and characteristics of the production techniques, the companies producing wine in Baja California are differentiated into four groups. Large companies use modern techniques and scale production throughout the wine-making process, and some of these companies import a significant portion of their must or juice from abroad; medium-sized companies combine traditional and modern techniques in the production process, whereas small companies and micro-enterprises use traditional techniques in wine production and they may also manufacture segments of the production process for medium and large companies.
The average production cost of Baja California wine fluctuates between 55 pesos a bottle without oak aging to up to 108 pesos a bottle for premium quality created with artisan technology.
The distributors of Baja California wine face major supply problems in the areas of product delivery time, product quantity, and distribution staff training. Additionally, implementing government actions such as reducing taxes, constructing new facilities to comply with tax obligations, and providing competitive financing schemes could help position Baja California wines in the market.
Based on the empirical estimation of the wine value chain in Baja California, at least two conclusions can be made. First, the value chain tool is directly related to the added value of a product and what the customer is willing to pay for the product, and it measures the competitive position. In this sense, it is essential for wineries to utilize this analysis tool because it provides a full study of the processes involved in production inputs and products as well as the management and development of the properties derived from the grape.
Second, the analysis of the value chain identified the main problems to which corrective actions should be directed both internally within the companies and externally within the sector. Highlights include restrictions related to productive infrastructure, financing, local suppliers, marketing, training and human resource development, water scarcity, and high taxes. Overcoming these restrictions, introducing improvements in the production processes, and identifying new market niches are keys factors that can increase the participation of Baja California wines in national and international markets.
References
Consejo Mexicano Vitivinícola (CMV). (2010). Consejo Mexicano Vitivinícola. Recuperado del sitio de Internet del Consejo Mexicano Vitivinícola: http://vinoclub.com.mx/index.php?module=Articulos&aid=67 [ Links ]
Consejo Mexicano Vitivinícola (CMV). (2012). Economía y mercados: Mercado de vino en México. Recuperado del sitio de Internet del Consejo Mexicano Vitivinícola: http://www.uvayvino.org/index.php/eonomia [ Links ]
Cooke, G. y Lapsley, J. (1988). Home Winemaking: Making Table Wine at Home. Oakland, California: Viticulture & Enology, University of California. [ Links ]
Distrito de Desarrollo Rural (DDR). (2011). Entrevista a DDR 001-Ensenada, área de Extensión Agrícola/Entrevistador: S. González. Costos de producción por hectárea de uva en la etapa de mantenimiento y en la modalidad de riego, ciclo 2009-2009. Secretaría de Agricultura, Ganadería, Desarrollo Rural, Pesca y Alimentación (Sagarpa). Copia en posesión del autor. [ Links ]
Duarte, A. (2012). Precios de artículos para vinícolas y oliveras. Entrevista a A. Duarte/Entrevistador: S. González. Distribuidora de artículos para vinícolas y oliveras (DAVO). Copia en posesión del autor. [ Links ]
Fischer, M., Hammond, J., Obermeyer, W. y Raman, A. (Mayo-junio, 1994). Making Supply Meet Demand in an Uncertain World. Harvard Business Review, 72(3), 83-93. [ Links ]
Font, I., Gudiño, P. y Sánchez, A. (2009). La industria vinícola mexicana y las políticas agroindustriales: panorama general. Redpol Estado, Gobierno y Políticas Públicas, (2), 1-30. [ Links ]
Food and Agriculture Organization of the United Nations (FAO). (2013). FAOSTAT: Trade. Recuperado de http://faostat.fao.org/ [ Links ]
Galitsky, C., Worrell, E., Radspieler, A., Healy, P. y Zechiel, S. (2005). Best Winery Guidebook: Benchmarking and Energy and Water Savings Tool for the Wine Industry. Berkeley, California: Energy Analysis Department, Environmental Energy Technologies Division, Ernest Orlando Lawrence Berkeley National Laboratory, University of California. [ Links ]
Girán, R., Vargas, H. y Osta, K. (2008). Propuesta metodológica para el análisis de competitividad empresarial en la pequeña y mediana agroindustria alimentaria. Revista Ingeniería Industrial, 7(1), pp. 5-14. [ Links ]
González, S. (2012). Cadena de valor del vino en los valles vitivinícolas de Baja California. En Autor (Coord.), Plan de acción para la innovación y competitividad de los valles vitivinícolas de Baja California. Tijuana, Baja California: Proyecto Conacyt-Fordecyt, El Colegio de la Frontera Norte. [ Links ]
Iglesias, D. (Febrero, 2002). Cadenas de valor como estrategia: Las cadenas de valor en el sector agroalimentario. La Pampa, Argentina: Estación Experimental Agropecuaria Anguil, Instituto Nacional de Tecnología Agropecuaria. [ Links ]
Lagos, J., Espinoza, C. y Rojas, W. (2010). Proceso y estructura de costo de producción. Recuperado de http://www.slideshare.net/jaldon/proceso-y-estructura-de-costo-de-produccin [ Links ]
Lee, H. L. (Octubre, 2004). The Triple-A Supply Chain: The Triple-A Supply Chain. Harvard Business Review, 102-122.
Lee, H. L. (Octubre, 2010). Don't Tweak You Supply Chain-Rethink It End to End. Harvard Business Review, 63-69.
Lundy, M., Gottret, M. V., Cifuentes, W., Ostertag, C. F. y Best, R. (2004). Diseño de estrategias para aumentar la competitividad de cadenas productivas con productores de pequeña escala: Manual de campo. Colombia: Proyecto de desarrollo de agroempresas rurales CIAT. [ Links ]
Mendoza, Á. A. (2011). Vinificaciones clásicas y no convencionales. Revista Enología, (1), 1-16. [ Links ]
Moguillansky, G., Salas, J. C. y Cares, G. (2006). Capacidad de innovación en industrias exportadoras de Chile: la industria del vino y la agroindustria hortofrutícola (núm. 79). Santiago de Chile: CEPAL, Serie comercio internacional. [ Links ]
Ponce, A. (2009). La fermentación del vino. La química entre dos. Recuperado de http://www.articuloz.com/vino-articulos/la-fermentacion-del-vino-la-quimica- entre-dos-964223.html [ Links ]
Porter, M. (1985). Competitive Advantage: Creating and Sustaining Superior and Performance. Nueva York: The Free Press. [ Links ]
Qi, Y., Zhao, X. y Sheu, C. (2011). The Impact of Competitive Strategy and Supply Chain Strategy on Business Performance: The Role of Environmental Uncertainty. Decision Sciences Journal, 42(2), 371-389. [ Links ]
Sánchez, S. (2002). La competitividad en el sistema productivo local del vino en el Valle de Guadalupe (Tesis de maestría). El Colegio de la Frontera Norte, Tijuana, México. [ Links ]
Secretaría de Fomento Agropecuario (Sefoa), Oficina Estatal de Información para el Desarrollo Rural Sustentable. (2011). Estudio estadístico sobre producción de uva en Baja California. Baja California: Gobierno del Estado de Baja California, Sagarpa, OEIDRUS. [ Links ]
Sepúlveda, J. (2009). Aspectos geográficos y estadísticos de la viticultura del estado de Baja California. Ensenada, Baja California: Sistema Producto Vid de Baja California y Fundación Produce de Baja California. [ Links ]
Sistema Producto Vid de Baja California (SPV). (s/f ). Información general del clúster. Recuperado del sitio de Internet de Sistema Producto Vid de Baja California: http://vidyvino.org/docs/SPVid_Info_Cluster.pdf [ Links ]
Sistema Producto Vid de Baja California (SPV). (2008). Información general del clúster. Recuperado del sitio de Internet de Sistema Producto Vid de Baja California: http://vidyvino.org/docs/SPVid_Info_Cluster.pdf [ Links ]
Vázquez, A. (2002). Endogenous development: Networking, innovation, institutions and cities. Londres: Routledge. [ Links ]
Vázquez, A. (2005). Las nuevas fuerzas del desarrollo. España: Antoni Bosch Editor. [ Links ]
Vivanco, M., Martínez, F. y Taddei, I. (2010). Análisis de competitividad de cuatro sistema-productos estatales de Tilapia en México. Revista Estudios Sociales, 18(35), 166-207. [ Links ]
Footnotes
1 This work is an updated version of the value chain for wine in the valleys of Baja California. The study is one of eight technical reports derived from the "Action Plan for Innovation and Competitiveness for Baja California Viticulture Valleys." This project was funded by the National Council of Science and Technology (Conacyt) through the Institutional Regional Fund for Scientific, Technological, and Innovative Development (Fordecyt). The author served as technical manager.
2 Water scarcity is a major restriction according to the System Product Vid Baja California (SPV, nd, p. 7). The sustainable development of viticulture in the Valle de Guadalupe in Ensenada, Baja California, must address the following issues: limited availability of water in the valley, reduced rainfall, increasing water demand of the urban population, and overexploitation of aquifers.
3 Each value activity includes supplies, human resources, and technology. In addition, each value activity creates and uses information, such as buy details, machinery and equipment performance parameters, product quality statistics, etc.
4 Local production systems are based on a division of labor between firms. The creation of local exchange systems results in increased productivity and economic growth (Vázquez, 2005).
5 The concept of competitiveness was initially used to compare countries using economic indicators. However, by 1991, Porter had suggested its application in comparisons of similar companies or products competing in either national or international markets (Giran, Vargas, and Osta, 2008).
6 The market creates costs that can be avoided in certain cases by allocating resources more efficiently. For example, a production and transaction cost analysis is divided into information and bargaining costs. The former are useful to determine relevant prices, whereas the latter are incurred in the preparation and closing of contracts in each exchange relationship.
7In this paper, the three different types of companies are identified: a) viticulturist or wine grower, the wine grape producer, b) vintner, the wine producer, and c) winemaker, the grape and wine producer.
8 New producers have recently been incorporated, and 22.33% (683.32 ha.) of the grape harvests are from new plants at one to five years of age (Ministry of Agricultural Development [Sefoa], 2011, p. 33).
9 In Mexicali, the viticulture areas are located in the Colorado River Basin entirely in the Mexicali Valley. Viticulture is focused 100% on the production of table grapes and raisins.
10 In this area, only 5.38% of the vine surface is temporary (District Rural Development [DDR], 2011).
11 Weather and wine growing conditions contribute to achieve quality production. It is important to monitor the performance and excessive growth and to avoid factors that favor performance and growth, such as irrigation, excessive nitrogen, wide plantation frames, vigorous carriers, etc. It is also important to choose the proper date of harvest and preparation carefully to obtain quality wines. The wine valleys of Ensenada are characterized by low levels of precipitation and water scarcity in the region, and these factors contribute to low yields of less than 10 tons of grapes per hectare. Hence the pulp of the grapes is characterized by a high concentration of sugars or low water content. In contrast, different varieties of grapes used to produce wine can exceed 20 tons per hectare in Chile.
12 The following participate in the grapevine system in Baja California: vine producers, wineries, suppliers and equipment providers, grape or wine distributors, related organizations (Canirac, Canacintra, Proturismo), financial institutions (FIRA development, FIRCO, Finrural, and commercial Banorte and Bancomer), educational and research centers, federal and state government institutions (SAGARPA, Sefoa, Tourism Ministry, Sedeco), and the city of Ensenada (SPV, 2008).
13 In 2010, Monte Xanic won nine awards, L.A. Cetto won eight, Chateau Camou won two, St. Thomas Vineyard won one, and Liceaga won one.
14 The survey results identified the locations of 45 restaurants offering wines produced on the valley, with 19 in Tijuana, 11 in Mexicali, 11 in Ensenada, and 4 in Playas de Rosarito. Providing information to residents and tourists is useful in promoting the consumption of wine in Baja California (González, 2012, p. 44).
15 The aging process has two phases: oxidative and reductive (without oxygen). The first occurs in wooden barrels, where small amounts of oxygen naturally penetrate the container and modify the chemical structure of the wine components. The second phase occurs inside the bottle, which does not allow penetration by oxygen except for minute amounts of gases that are filtered through the cork cells; thus, wine elements react in the absence of oxygen.
16 Fermentation is a complex chemical reaction that is completely natural. The grapes ferment when the grape skins are broken and the sugars contained in the mature fruits come into contact with the yeasts present in the skin. The fermentation process is strongly exothermic, releasing 23.5 kcal per mol of consumed glucose. In addition to the death of yeast, the high temperature causes a loss of volatile aromatic compounds and increased extraction of tannin and bitter substances from the solids. Temperature control can be achieved by a suitable cooling system and altered to the desired ranges of the winemaker. The fermentation process is usually divided into three phases: I) pre-fermentation, which is the set of processes before fermentation; II) fermentation; and III) post-fermentation, which is the final set of process. Slow fermentation occurs in the post-fermentation stage (Ponce, 2009). Mendoza (2011, p. 11) indicates that maceration occurs in the period of post-fermentation and states that prolonged barreling affects the evolution of tannins and creates increased body, complexity, depth on the palate, and stability in color. The rate of norisoprenoids, which are aromatic precursors located in epidermal cells of the skin, may also be increased.
17 New or gently used barrels convey their characters to the wine more rapidly than old barrels. Because the latter have lost a portion of their distinctive characteristics with use, a longer wine residence time is required.
18 Font, Gudino, and Sánchez (2009, pp. 12-13) indicate that Mexican wines are placed at a disadvantage relative to foreign wines because of price. The most economic wines with higher quality are between $70 and $80 Mexican pesos, whereas Spanish and Chilean wines can be found for $55 pesos. Mexican white and red wines range from $70 to $100, whereas Chilean, Argentinean, and Spanish whites and reds range from $55 to $100. For top-quality wines (reserve reds), Mexicans prices range from $140 to approximately $500, whereas foreign wines range from $115 to $300. When considering top-quality wines, the price difference is not great, with Mexican wines between $500 and $1,000 and foreign wines between $325 and $1,200.

