


Servicios Personalizados
Revista

Articulo
 Inglés (pdf)
 Artículo en XML
 Referencias del artículo
 Enviar artículo por email
Indicadores
 Citado por SciELO
 Links relacionados
-
 Similares en
SciELO
Similares en
SciELO
Compartir

 Permalink
Atmósfera
versión impresa ISSN 0187-6236
Atmósfera vol.23 no.3 Ciudad de México ene. 2010
South American atmospheric circulation anomalies related to droughts in the northwest of Argentina (1951–1980)
M. E. BOBBA
Departamento de Geografía, Laboratorio Climatológico Sudamericano, Universidad Nacional de Tucumán, Argentina. Corresponding author; e–mail: elvirabobba@hotmail.com
J. L. MINETTI
Consejo Nacional de Investigaciones Científicas y Técnicas, Laboratorio Climatológico Sudamericano y Departamento de Geografía, Universidad Nacional de Tucumán, Argentina
Received July 29, 2009; Accepted April 19, 2010
RESUMEN
Con base en un índice de sequía regional realizado por otros autores (Minetti et al., 2004), ha sido posible asociar sequías con anomalías de presión atmosférica en América del Sur. Se ha tratado de agrupar los campos de anomalías de presión atmosférica, que muestran cambios de circulación, con los índices de sequía. Se aplicó la metodología de Lund a escala mensual, estacional y anual, lo que permitió seleccionar un pequeño número de sequías fuertes relacionadas con la circulación. Como resultado hemos concluido que algunas de estas sequías fuertes están asociadas con los factores que se mencionan a continuación. Las principales alteraciones de circulación relacionadas con sequías describen en la mayoría de los casos lo siguiente: a) gradientes transcordilleranos significativos, en este caso incluimos aquellas que intensifican los vientos zonales del oeste (oeste–este) sobre Patagonia, lo cual genera anticiclogénesis sobre la costa oceánica pacífica y ciclogénesis en el continente; b) subsidencia anticiclónica; c) debilitamiento de la corriente húmeda del norte debido a una disminución del gradiente entre el anticiclón del océano Atlántico y la depresión continental y/ o subsidencia continental asociada con la corriente proveniente de esta dirección.
ABSTRACT
Based on a regional drought index carried out by other authors (Minetti et al., 2004), it has been possible to associate droughts with atmospheric pressure anomalies in South America. We attempted to group the fields of atmospheric pressure anomalies, which show circulation changes, with these drought indexes. We applied Lund's methodology based on a monthly, seasonal and annual scale. It has been possible to select a small number of severe droughts related to circulation. Consequently, we conclude that some severe droughts are associated with the factors listed below. The main circulation alterations related to droughts describe in most cases the following: a) significant mountain range gradients, in this case we include the one that intensifies the western zonal flow (west–east) over Patagonia, which generates an anticyclogenesis on the Pacific Ocean coast and a cyclogenesis on the continent, b) anticyclonic subsidence, c) weakness of the north humid flow due to a diminution of the gradient between the Atlantic Ocean anticyclone and the continental depression and/or subsidence associated with the flow coming from this direction.
Keywords: Drought, atmospheric pressure anomaly, circulation.
1. Introduction
The tropical–equatorial circulation of South America, represented by seasonal average fields, shows interdiurnal changes which are not very significant. On the other hand, the extratropical circulation is highly variable regarding time and space; this characteristic increases as the latitude rises. The outstanding atmospheric systems in the circulation within the continental macro–scale are: the subtropical anticyclones of the Atlantic and South Pacific, the intertropical convergence zone, and the thermo–orographic low of the Argentinean northwest (NWA) or Chaco.
The interaction between the subtropical anticyclones, together with their north–south seasonal movement, and the Argentinian northwest continental low defines the rainy period and mark the season characterized by very few rains.
Droughts are considered to be one of the most significant atmospheric adversities causing great economic loss in a society. In the NWA Minetti et al. (2004) have identified droughts in relation to space, intensity and time by means of carrying out an inventory of the phenomenon. Bobba and Minetti (2001, 2002) have shown some relationships between topography and droughts in NWA. On the other hand, Figueroa et al. (1995) and Satyamurty et al. (1998) have dealt with the exogenous circulation factors based on a large scale. The circulation analyses and the analyses of the interaction between the former and remote sea temperatures (SST) revealed the association between the phenomena based on a large scale and droughts in South American regions (Aceituno, 1988; Ropelewski and Halpert, 1987, 1989, 1996; Kiladis and Díaz, 1989). Within the region under analysis, these predictors are spatially diffuse due to the interaction between predictors and local factors (Minetti and Leiva, 2005; Minetti and Vargas, 2005). In order to associate droughts with abnormal circulation, a file of atmospheric pressure anomalies has been created in South America. This file has been typified according to its anomalous characteristics and it has been associated with drought indexes.
2. Data and methods
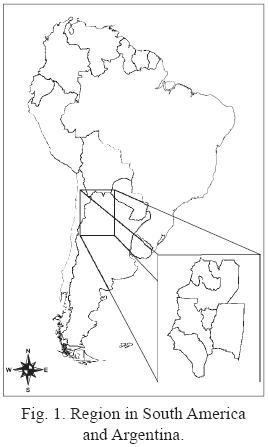
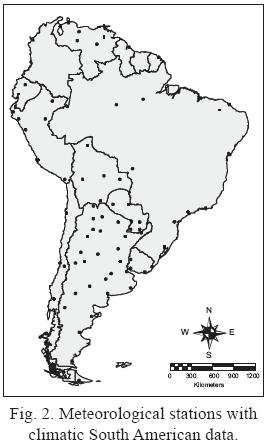
Figure 1 shows the region under analysis in South America. In addition, Figure 2 highlights the atmospheric pressure data of seventy–six localities. This information was obtained from the Meteorological National Services in South America, compiled by NOAA and published by World Weather Records (US Department of Commerce, 1966, 1982, 1991). These data, previously analyzed in the Laboratorio Climatológico Sudamericano (LCS)–Fundación Caldenius, have been applied to the period 1951–80.
Minetti et al. (2007) have made an inventory of sub–regional droughts in southern South America in order to apply it afterwards to investigate causes of regional droughts or to human activities such as agriculture. This inventory consists of drought's annual and monthly indexes for six sub–regions; one of them is NWA. Basically, drought's monthly indexes are calculated using monthly rainfall data obtained from the pluviometer–network of the Servicio Meteorológico Argentino, during the period 1916–2004. The monthly drought index, in this case, is an established proportion between those localities whose rainfall is below the median over the totality of the localities under analysis. This index ranges between 0 and 1, and for quarterly or semi–annual periods the indexes are obtained by the sum of monthly values. These are the indexes which have been associated with fields of atmospheric pressure anomalies in South America.
After these values were calculated, their monthly anomalies were estimated. These anomalies were defined by substraction of the average in the period 1951–80. These data, presented on a monthly scale, have been analyzed using Lund's methodology (1963) with the purpose of characterizing anomaly fields in groups. These groups were shown in maps as the average anomalies (Minetti and Sierra, 1989).
Lund's methodology associates (with a level of pre–established statistical signification) a particular atmospheric situation corresponding to any month of a year, which is identified as the principal one. The first and major group of associations is called type 1 or A, the second group type 2 or B, and so on until there are no further associations. Those situations remaining without groups fall into a category called residues. Besides, we obtained averages from each type, which were used to represent cartographically those situations related to the phenomenon under discussion.
The situations associated with each type were compared with drought indexes (considering the median) in order to identify which type constituted the group that with closer approximation represented an atmospheric situation generating drought in the NWA. Knowing that the average types produce diverse situations of circulation, we deduce that they will represent rainfall or drought situations. In this way, we obtained those cases related to droughts whose averages have been shown in maps.
We have worked with annual, seasonal (dry and rainy semesters), and monthly groups making use of monthly database. In order to determine which of the models define a drought with statistical signification we have applied the chi square test to those models that were grouped in months (Spiegel, 1991).
The associations between the monthly atmospheric pressure anomalies with the suggested drought index were examined. The fields selected by using this methodology were associated with droughts or precipitation excesses. According to our own viewpoint, a regional drought occurs when the amount of rainfall in NOA's stations equals or surpasses 50% of those localities presenting data which are below their respective medians. By taking into account this percentage, two balanced samples between droughts and excesses were created in order to include the widest range of situations under analysis. In the past, Lund's methodology, or any other orthogonal selective method, selected, in the first type, the greatest number of cases accumulated in the variance. This is shown in the regional drought index formulated by Minetti et al. (2004, 2007). The periods characterized by scarce rainfall, associated with the apparently movement of the sun, constitute the so–called "seasonal droughts" or "periodic droughts", which are not regarded as droughts themselves because they represent "what is expected" for those months. The term drought is applied only to those cases where rainfalls are below the median for a particular period of the year. It is in those periods where the rainfall is insufficient, occurring during winter in the Cw and BSh climates (Köppen, 1923, 1948).
3. Results and discussion
As analyses are based on inferences carried out about anomalies occurring in the average field of atmospheric pressure, January and July's normal isobar maps are shown in figures 3 and 4 (Hoffmann, 1992).
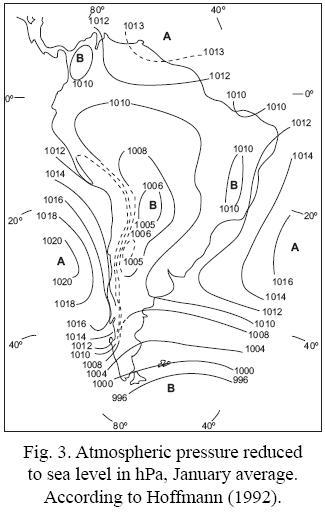
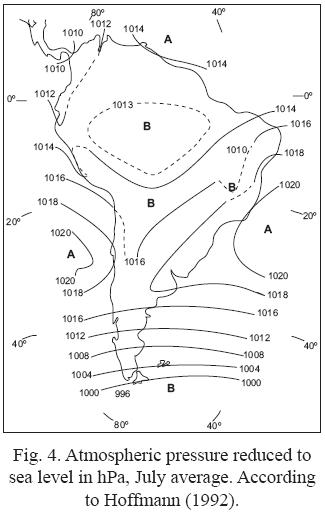
Table I shows 12 types of monthly atmospheric pressure anomalies selected by Lund's methodology (1963) in a sample of 12 months x 30 years = 360 cases under analysis in the period 1951–80.
From this table it is possible to infer that the greatest amount of anomalous cases may represent either droughts or rain excesses in the region (types A, B and C). However, only a small amount (18/360 x 100 = 5% of types explaining 18/192 x 100 = 9.4% of droughts) can define a typical drought (types H, J and K). The remaining cases of drought can be explained by almost normal atmospheric pressure fields which are difficult to characterize within the circulation field. The atmospheric pressure averages of these anomalous fields (Minetti and Sierra, 1989) are shown in figures 5, 6 and 7.
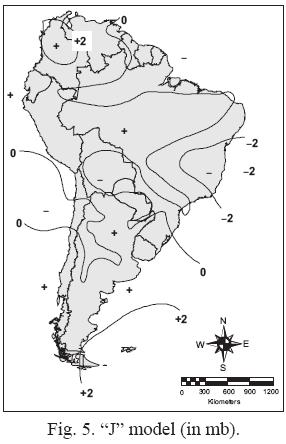
J model, shown in Figure 5, covers a great continental area including the greatest part of Argentina and adjoining seas dominated by positive atmospheric pressure anomalies. On the north–eastern coasts of Brazil and Guyana prevail a field of low–pressure anomalies. The anticyclonic subsidence is a pattern covering almost all the tropical–subtropical Argentinian region and the pressure gradient between the continent and the Atlantic Ocean is diminished. These two circumstances would explain the droughts occurring in this region.
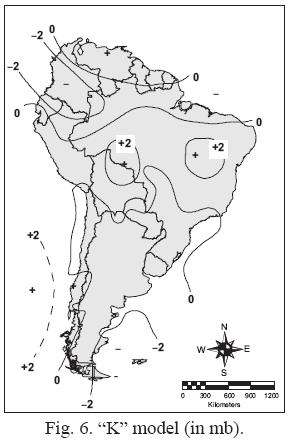
K model, Figure 6, shows the territories of Argentina, Paraguay, Uruguay and southern region of Brazil where pressures below the normal standard prevail. The eastern side of the South Pacific anticyclone is intensified; for this reason the mountain range dry flow may increase. The low atmospheric pressures in the Amazonas' mouths may indicate that the inter–tropical convergence zone (ITCZ) is in a position further towards the South. It is true that each season has its own characteristic circulation type, but anomalies can occur and they may alter the results, and in this research we work with anomalies. The situation previously described means favorable conditions for precipitations in the northeast of Brazil and a drier situation in the Argentinian plains resembling La Niña phenomena described by Ropelewski and Halpert (1987, 1989 and 1996). The negative anomalous cases of the northern humid flow in J and K models may be related to the diminution of individual cases (synoptic scale) of the South American Low Level Jet (SALLJ–Paegle and Mo, 1997; Paegle et al., 2000). Furthermore, in K model atmospheric pressure excesses in a wide tropical strip might be related to the northern subtropical anticyclone's movement and also to a subsidence carrying drier air towards NWA. Besides, an extensive positive atmospheric pressure anomaly on the Pacific Ocean coast might be associated with La Niña's cold sea (Trenberth, 1997). Lund's methodology associates circulation types, and these were in turn associated with regional drought indexes. We do not put emphasis on months but on the process of circulation which generates droughts in the northwest of Argentina (NWA).
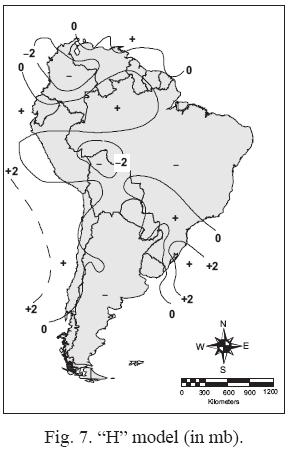
H model, Figure 7, shows an extensive high–pressure field on the Pacific Ocean coast and a field of negative anomalies on almost all the continental area. This phenomenon develops a significant mountain range gradient related to dry orographical subsidences favourable for droughts on the continent (Minetti et al., 1990).
The results of monthly information grouped in seasons are shown in Table II. In this table it is possible to observe drought frequencies associated with atmospheric pressures and their fields of monthly anomalies during annual seasons.
The fields of monthly anomalies grouped in trimesters have been selected by Lund's methodology. We analyze the three main groups having the major percentage of the cases. These are types I, II and III.
Note that within the three main types of atmospheric pressure anomalous fields covering more than 60% (65 and 66%) of all the cases which have been analyzed, only those occurring during autumn and winter, a basic type (Type I), can explain droughts. This situation has been defined for 50% or more localities with droughts in NWA.
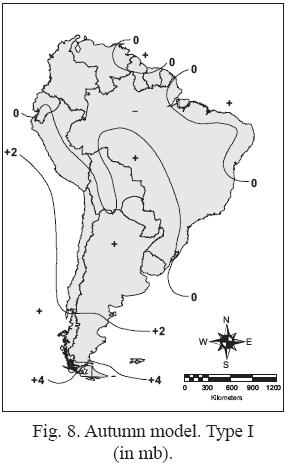
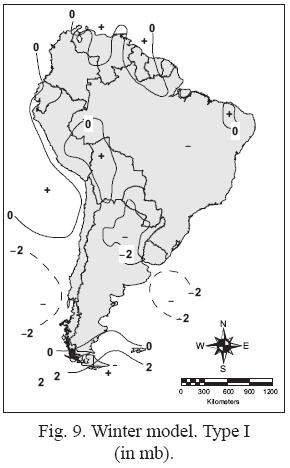
Figures 8 and 9 show fields of monthly atmospheric pressure anomalies related to droughts during autumn and winter trimesters. Figure 8 describes a positive anomaly in NWA region; consequently there will be a humid flow's diminution towards this area. Knowing that a significant pressure gradient from the Atlantic Ocean is the one that carries water vapour to the region, we infer that the inverse will cause drought. Besides, this anomaly is associated with positive deviation fields extending towards the south, which may indicate a dry–cold advection in the average. Figure 9 shows a deeper negative anomalous field on the continent. Therefore, it can be said that this situation implies a bigger pressure gradient between the Pacific Ocean coast and the continent showing air–dryness caused by orographical subsidence.
The results of monthly information grouped in semesters of warm (ONDJFM) and cold seasons (AMJJAS) are shown in Table III.
It is worth noting that the three main types of atmospheric pressure anomalies do not group any drought during the warm–rainy season. However, during the cold season the two main types are associated with droughts fulfilling their condition in 50% or more localities. If in the later case exigency increases concerning droughts fulfilling 70% of those localities suffering from droughts in NWA, types I and II will agglutinate 37% and 33% of all the cases. The fifthy–eight cases associated with droughts correspond to 32% of the total cases analyzed within this period and to 64% of droughts. This fact implies that those situations related to models I and II are highly frequent during cold seasons.
Figures 10 and 11 show averages of atmospheric pressure anomalies associated with droughts for types I and II during cold season. Type I associates them with an increase in mountain range gradient and also with dry orographical subsidence through the Central–North–Andean area (Zonda effect). On the other hand, Type II describes atmospheric pressure excesses on the continent and its western area possibly due to an effect of anticyclonic subsidence and also due to a western flow decrease over Patagonia. The latter case is related to the former because a decrease in the zonal flow diminishes the Andean leeward cyclogenesis, which favours the production of positive anomalies on the continent.
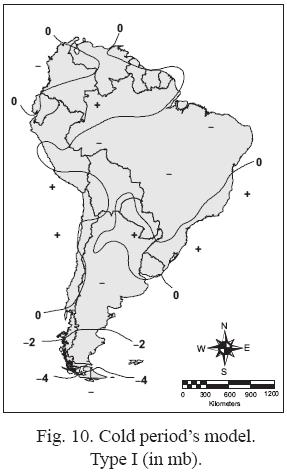
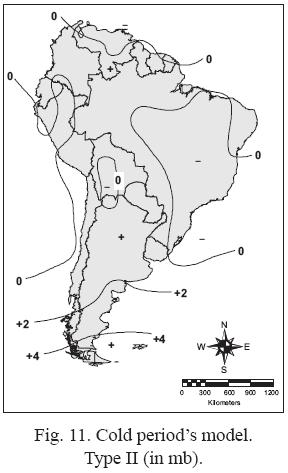
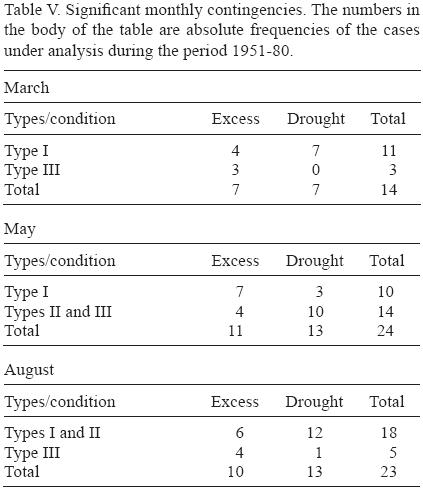
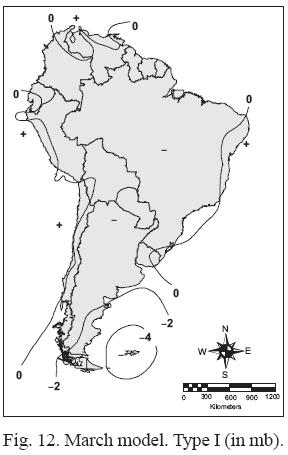
Table IV presents a monthly analysis of all the characterized anomaly types from 1951 to 1980. In this table it is possible to observe that droughts are not very frequent within the main types, or at least those situations concerning droughts are not clearly seen within the main types. If a seasonal analysis of the three main types of circulation anomalies is carried out, it will be possible to observe in Table V that only in March, May, and perhaps August exist a significant contrast between the main types describing droughts. Concerning the remaining months, droughts should be looked for within extremely disturbed circulation types with low probability value.
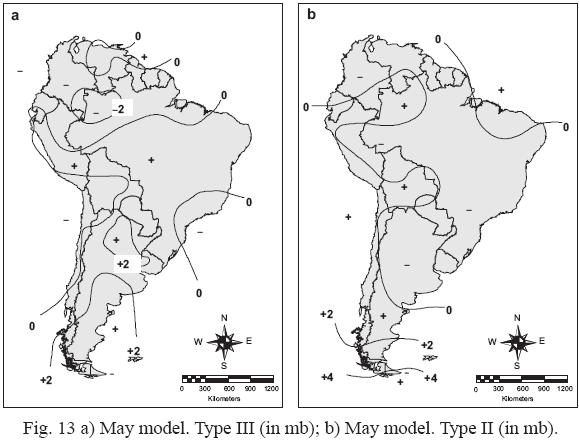
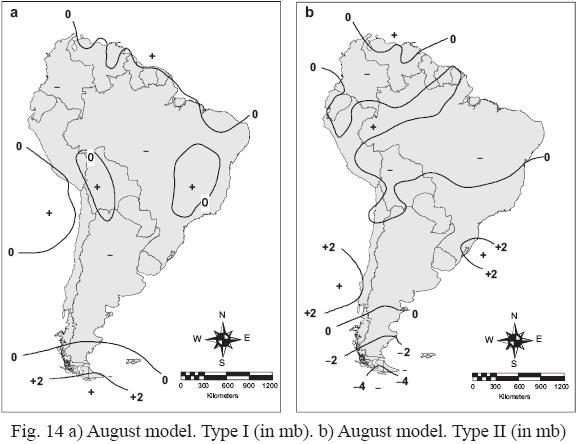
Figures 12, 13a, b, and 14a, b show March, May and August's averages of anomalies associated with droughts. It is possible to observe that during March, drought is related to atmospheric pressure excesses on the Central–North–Chilean coast and to pressure deficit on the continent. This situation increases the mountain range gradient and the leeward orographical subsidence. Precisely, during March the phenomena previously described are not very frequent due to the entrance of humid flow into NWA during autumn. In May, drought is associated with atmospheric pressure increase on the continent and with depressurisation on the subtropical coastal anticyclones diminishing humid flow's advection. Consequently, there is a diminution of the gradient between the Atlantic Ocean and the continent as well as an anticyclonic subsidence. Although the types in August (Fig. 14a, b) represent droughts, the detected circulations represent generalized anomalies of positive or negative sign in the atmospheric pressure field on the subtropical anticyclone.
4. Conclusion
Only few of the droughts in the Argentinian northwest (NWA) are clearly associated with fields of anomalous circulation patterns. In other words, these patterns are represented by atypical "models" (in the sense of the context of the methodology of this work) of low probability corresponding to 6% of circulation models; this fact explains only 9% of typical droughts.
Only in March, May and probably August, droughts may be related to frequent fields occurring in the first three types of basic circulations. In a trimestral analysis it is possible to observe this situation during autumn and winter. During cold semesters, the two main types of circulation anomalies describing droughts explain 64% of the cases.
The main alterations of those circulations associated with droughts describe in most cases the following: a) significant mountain range gradients, in this case we include the one that intensifies the western zonal flow (west–east) over Patagonia, which generates an anticyclogenesis on the Pacific Ocean coast and a cyclogenesis on the continent, b) anticyclonic subsidence, c) weakness of the north humid flow due to a diminution of the gradient between the Atlantic Ocean anticyclone and the continental depression and/or subsidence in the flow coming from this direction. Other atmospheric mechanisms will be more difficult to be detected and if such mechanisms are based on a monthly or larger scale they could not be observed because they will correspond to a synoptic scale.
Acknowledgements
Special thanks to Servicio Meteorológico Nacional of Argentina and other South American countries for providing us with useful information; CONICET for its financial support for the following projects: PID 2157/ 2001 "Sequías en Argentina" (Droughts in Argentina); SECYT for ANPCYT 07–06921 project's resources; and UNT's Science and Technique Secretary –CIUNT–1796/04: "Las Sequías en el NOA" (Droughts in NWA). Finally, we wish to express our gratitude to Laboratorio Climatológico Sudamericano–Fundación Caldenius for providing useful data, specific software and all the necessary means for this research.
References
Aceituno P., 1988. On the functioning of the southern oscillation in the South American sector, Part I, Surface climate. Mon. Wea. Rev. 116, 505–524. [ Links ]
Bobba M. E. and J. L. Minetti, 2001. Las sequías en la región del noroeste Argentino por áreas morfológicas. Revista del Departamento de Geografía, Universidad Nacional de Tucumán 6, 3–15. [ Links ]
Bobba M. E. and J. L. Minetti, 2002. Comportamiento espacio–temporal de las sequías en la región del Noroeste Argentino. Breves contribuciones del Instituto de Estudios Geográficos–Universidad Nacional de Tucumán 14, 91–112. [ Links ]
Figueroa S. N., P. Satyamurty and P. L. Silva Días, 1995. Simulations of the summer circulation over the South American region with a coordinate model. J. Atmos. Sci. 52, 1573–1584. [ Links ]
Hoffmann J. A. J., 1992. The continental atmospheric pressure and precipitation regime of South America. Erdkunde 46, 42–51. [ Links ]
Kiladis G. N. and H. F. Díaz, 1989. Global climatic anomalies associated with extremes in the Southern Oscillation. J. Climate 2, 1069–1089. [ Links ]
Köppen W., 1923. DieKlimate der Erde, Grundriss der Klimakunde. Berlin und Leipzig, 369 pp. [ Links ]
Köppen W., 1948. Climatología, Fondo de Cultura Económica, México – Buenos Aires, 479 pp. [ Links ]
Lund I. A., 1963. Map pattern classification by statistical methods. J. Appl. Meteorol. 2, 56–65. [ Links ]
Minetti J. L. and E. A. Sierra, 1989. The influence of general circulation patterns on humid and dry years in the Cuyo Andean Region of Argentina. Int. J. Climatol. 9, 55–68. [ Links ]
Minetti J. L., W. M. Vargas and A. G. Poblete, 1990. La perturbación en la circulación zonal que originaría el Subcontinente Sudamericano. Rev. Geofísica IPGH–OEA. México. 33, 161–178. [ Links ]
Minetti J. L., W. M.Vargas, L. R. de la Zerda, A. G.Poblete, G. A.Casagrande, L. R Acuña, I. J. Nieva, F. L Frasseto, G. E Ostertac, L. R Minetti and E. A. Mendoza, 2004. Inventario de las sequías regionales en Argentina y Chile. Informe Técnico del Laboratorio Climatológico Sudamericano–Fundación Caldenius. Tucumán, Argentina, 104 pp. [ Links ]
Minetti J. L. and M. del V. Leiva, 2005. Variabilidad y cambio climático en el Noroeste Argentino. In: El Clima del Noroeste Argentino (J. L. Minetti, Ed.) Magna, Tucumán, Argentina, 235–255. [ Links ]
Minetti J. L. and W. M. Vargas, 2005. La circulación regional en el Noroeste Argentino y condiciones del tiempo asociadas. In: El Clima del Noroeste Argentino ( J. L. Minetti, Ed.) Magna, Tucumán, Argentina, 77–115. [ Links ]
Minetti J. L., W. M. Vargas, B. Vega and M. C. Costa, 2007. Las sequías en la Pampa húmeda: Impacto en la productividad del maíz. Rev. Bras. Met. 22, 218–232. [ Links ]
Paegle J. N. and K. C. Mo, 1997. Alternating wet and dry conditions over South America during summer. Mon. Wea. Rev. 125, 279–291. [ Links ]
Paegle J. N., L. A. Byerle and K. C. Mo, 2000. Intraseasonal modulation of South American summer precipitation. Mon. Wea. Rev. 128, 837–850. [ Links ]
Ropelewski C. F. and M. S. Halpert, 1987. Global and regional patterns associated with the El Niño/Southern Oscillation. Mon. Wea. Rev. 115, 1606–1626. [ Links ]
Ropelewski C. F. and M. S Halpert, 1989. Precipitation patterns associated with the high index phase of the southern oscillation. J. Climate 2, 268–284. [ Links ]
Ropelewski C. F. and M. S. Halpert, 1996. Quantfying southern oscillation–precipitation relationships. J. Climate 9, 429–438. [ Links ]
Satyamurty P., C. A. Nobre and P. L. Silva Días, 1998. Meteoroloy of the southern hemisphere. In: Meteorological Monographs (D. Caroly and D. G. Vicent, Eds.). American Meteorological Society. Boston, MS, 119–139. [ Links ]
Spiegel M. R., 1991. Estadística. Mc Graw Hill. New York– Panamá. 556 pp. [ Links ]
Trenberth K. E., 1997. The definition of El Niño. B. Am. Meteorol. Soc. 78, 2771–2777. [ Links ]
US Department of Commerce, Environmental Science Services Administration, Environmental Data Services. 1966. World Weather Records 1951–60, Volume 3, South America, Central America, West Indies, The Caribbean and Bermuda. Washington, DC, 356 pp. [ Links ]
US Department of Commerce, Environmental Data and Information Service. 1982. World Weather Records 1961–70, Volume 3, West Indies, South and Central America. NOAA. Washington, DC, 434 pp. [ Links ]
US Department of Commerce, Environmental Science Services Administration, National Environmental Satellite, Data, and Information Service. National Climatic Data Center. 1991. World Weather Records 1971–80, Volume 3, West Indies, South and Central America. NOAA. Washington, DC, 469 pp. [ Links ]

