


 nueva página del texto (beta)
 Inglés (pdf)
 Artículo en XML
 Referencias del artículo
 Enviar artículo por email
 Citado por SciELO
  Similares en
SciELO
Similares en
SciELO 
 Permalink
Introduction
The planning stage in mineral extraction is fundamental to the operational and economic success of a mine, because in addition to determining the useful life of the project, proper planning contributes significantly to reducing costs during exploitation and to the safety of operations (Aalst, 2016). Careful analysis of variables such as geology and ore characteristics is essential to optimize the extraction process and ensure long-term sustainability (Worlanyo & Li, 2021). Small-scale mining essentially produces non- metallic mineral inputs, with low aggregate value, for transportation and consumption in nearby municipalities in the civil construction sector. The profile of residential construction in Brazil, like in other South American countries, has historically used materials available in a tropical climate: sand, clay minerals and stone (ANM, 2021). Clay materials are used to make bricks and ceramic tiles, which are used to build foundations, walls and roofs. Limestone is used to make cement, which, combined with crushed igneous rocks such as diabase and granite, makes it possible to combine gravel and cement to produce concrete, which is used to build beams to support walls, slabs and other structural elements in civil construction.
The low aggregated value of small-scale mining operations aimed at producing gravel for the construction industry depends on low-cost conditions for its operational viability: soil layer less than 10m thick, homogeneous rock with a low degree of fracturing and mining operations limited to exposure of the water table, where the increasing cost of pumping water as the pit deepens makes the operation unfeasible. In this context, it is essential to look for research tools that help reduce operating costs. These costs are often associated with geological surveys, which, although essential, are more expensive and require more time to acquire and analyze data. In Brazil, around 88% of mining companies are small, with a predominance of construction aggregates such as sand, clay and gravel (ANM, 2021). The possible appearance of heterogeneities in the rock mass or intercalations of different rocks makes small-scale mining difficult or even unfeasible, with emphasis on mines producing gravel, given the very different compositions for concrete produced with diabase gravel (predominantly magnesium and iron minerals) or granite gravel (predominantly silica and potassium minerals).
The estimation of mineral reserves and investigations in areas of advance in small-scale mining for gravel is based on low-power pneumatic roto-percussive drilling at depths of up to 30m, with holes strategically planned to be used later for loading explosives, blasting and dismantling. This depth has been chosen because, in general, in gravel mining areas, the 30 m limit is sufficient to reach the contact between the upper layers of soil or saprolite and the bedrock, which is predominantly made up of highly resistant igneous or metamorphic rocks. From these depths, the rock mined has characteristics that are considered suitable for the production of gravel, while deeper mining can lead to operational challenges, such as increased water pumping costs and greater complexity in dismantling the material. This scenario explains the focus on technological solutions that investigate rock masses, allowing for more efficient planning of operations, reducing dependence on equipment for blasting, loading and transportation in small-scale mining operations in Brazil (Machado et al., 2020; Tichauer et al., 2021). The use of geophysical methods is a highly satisfactory alternative due to their versatility in operational mine conditions, speed and very attractive cost compared to the use of drilling rigs (Dentith & Mudge, 2014; Moon et al., 2006). The growing use of geophysics in this area of activity is accompanied by scientific and technological challenges that allow for application and satisfactory results at the same time (Casagrande et al., 2020; Targa et al., 2021; Nascimento et al., 2022; Marques et al., 2022; Camarero et al., 2022).
Geophysics is a science based on the indirect study of the Earth's interior, based on measurements of physical properties intrinsic to geological materials, such as electrical conductivity, density, radioactivity, magnetism or gravitational field variations (Reynolds, 2011, Mussett & Khan, 2000). Electrical and electromagnetic geophysical methods are frequently applied in shallow geophysics and investigations in mineral research, hydrogeology, geotechnics and in the diagnosis of environmental liabilities, with several success cases given the frequent contrast of electrical properties between targets and the surrounding soil or rock (Lghoul et al., 2012; Cortada et al., 2017, Guireli Netto et al. 2023). In regard to issues such as equipment and operating costs, these are geophysical methods with a lower relative cost and in many cases affordable for small-scale projects (Tichauer et al, 2020).
This work presents a case study of the use of the geophysical method of Electroresistivity, using the technique of electrical resistivity tomography (ERT), in a small mining operation for the production of diabase gravel used in civil construction. The deepening of the open-pit mine revealed the existence of granite at varying depths, in a geological context of diabase intruded into a sedimentary basin and the occurrence of granite 9km away from the mine. The great difference between these rocks in terms of drilling, blasting and crushing costs, which are higher for granite than for diabase, implies the need for geological detailing for the purposes of mine planning and the eventual viability of the mining project. Given the need to map and discriminate between diabase and granite and the similarities in electrical resistivity between these rocks, this study also sought to overcome a scientific and technological challenge, based on the geological/structural characteristics of each rock and the aid of climatic and seasonal variables.
Location and geological context of the study
The studies were carried out at a quarry located in southeastern Brazil, which produces different types of fine aggregate (sand or crushed stone less than 9.55 mm in diameter) and coarse aggregate (between 9.5 mm and 37.5 mm in diameter) used in construction in the state of São Paulo (Figures 1 and 2). The mine was set up in an open pit (Figure 1A) and operates by blasting and crushing the diabase. Locally, it was possible to identify partially saturated columnar diabase at the mining front at the bottom of the pit (Figure 1B) and columnar diabase covered by red saprolite (Figure 1C). The presence of thick layers of soil is a challenge for mineral exploration activities in mines located in tropical environments. In tropical environments, the soil tends to be composed of clayey or very compacted materials, which makes drilling and excavation difficult. Once extracted and crushed, the different types of aggregates are separated into piles of different particle sizes (Figure 1D)(Frazão, 2007).
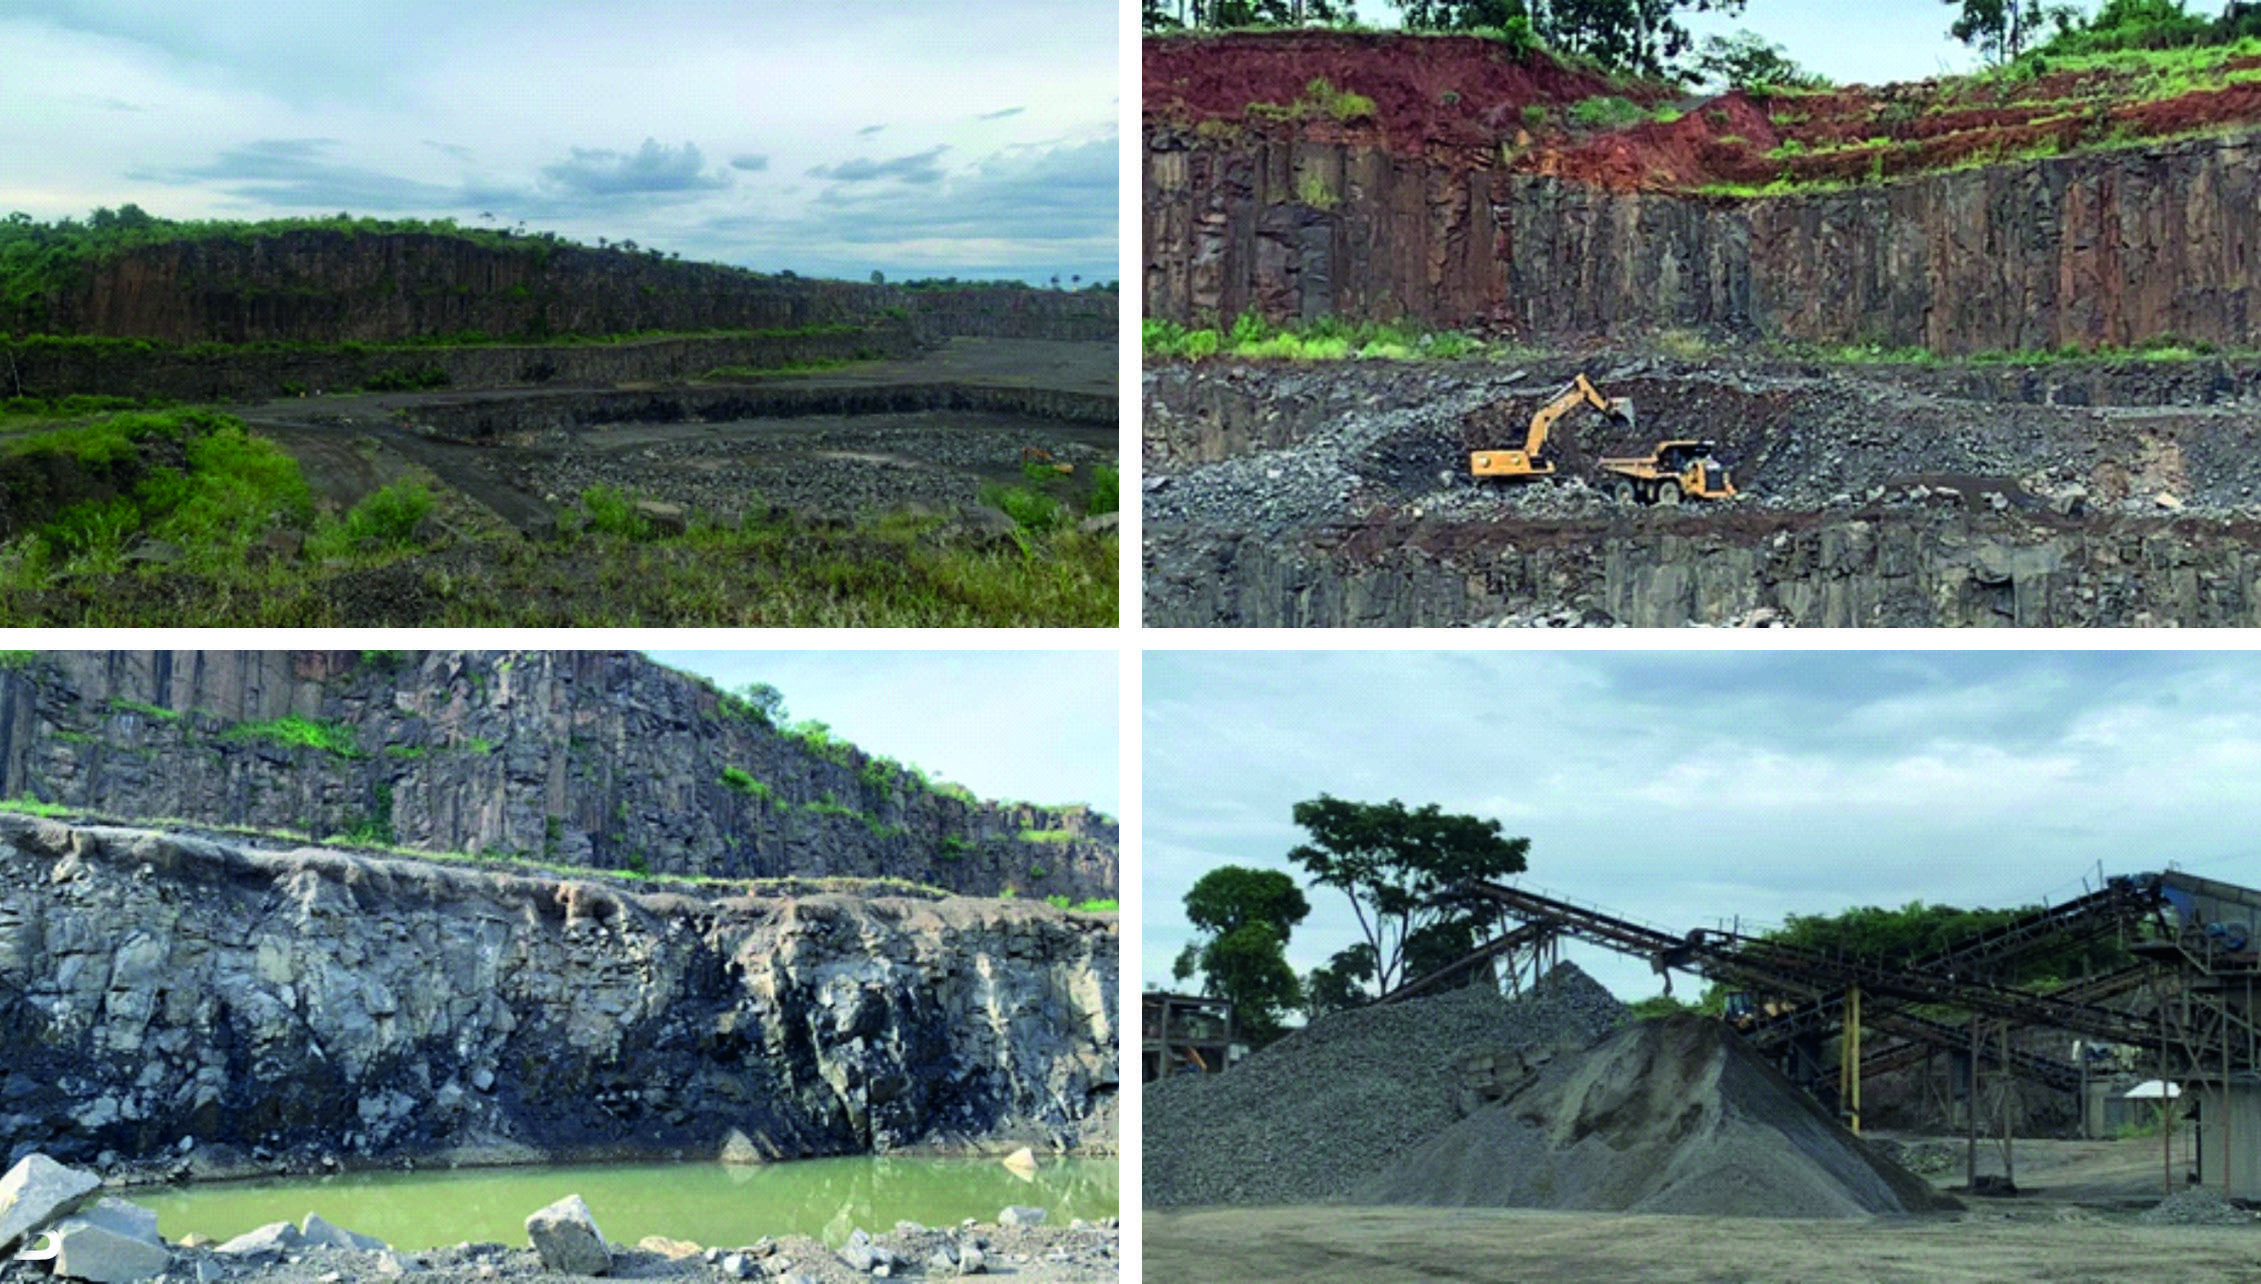
Figure 1. Main compartments of the study area. A) Panoramic view of the open pit mine. B) Bottom of pit with diabase saturated in water. C) Loading and transportation of dismantled rock, with soil and columnar diabase in the background. D) Crushing process and stacking the ore for sale.
The regional geological context is represented by a basic intrusive body (diabase) associated with the Serra Geral Magmatic Event (Serra Geral Formation), intruded into sediments of the Itararé Group. The Itararé Group is a sequence deposited in the Permo-Carboniferous consisting of sandy sediments, ranging from very fine-grained to conglomeratic (Schneider et al. 1974). Large packages of diamictites, siltstones, shales and rhythmites are present, sometimes containing random pebbles and blocks. Thin layers of coal occur subordinately (Soares, 1972). Its records represent glacial processes, with continental sediments, a marine environment of pelitic facies and deltaic lobes, with turbidites and associated mass flows. The Serra Geral Formation comprises a sequence of basaltic lavas with intercalated lenses and sandy layers. The Formation consists of basaltic, tholeiitic lavas with an aphanitic texture, gray to black in color, amygdaloidal at the top of the flows and with great development of vertical and horizontal joints. Interbeds of fine to medium sandstones, with tangential cross-stratification (identical to that of the Botucatu Formation), occur mainly in the basal part. The main form of occurrence of the unit in the eastern region of the state of São Paulo is in the form of basalt or diabase sills and dykes and some flows, as well as fault fills (Machado et al. 2015; Machado et al. 2018).
Locally, the diabase has a columnar structure and horizontal fractures (Figure 3), with completely dry portions and places with clear water infiltration through the fractures. These fractures play a significant role in resistivity measurements, as they act as preferential paths for water flow and can increase electrical conductivity compared to intact rock. The presence of water in the fractures reduces the measured resistivity, while dry fractures tend to have a limited impact on the values obtained, keeping the resistivity relatively high (Moreira et al. 2024). The intrusive is covered by saprolite with weathered rock fragments and red clay soil of varying thickness and lateral continuity. During mining operations, an abrupt contact with granite was recognized at the bottom of the pit. This granite has a gray color, porphyritic texture, light gray plagioclase phenocrysts, with a matrix represented by biotite and quartz. This lithotype is not described on geological maps of the region and only occurs on the surface in the municipality about 9 km away, belonging to the Amparo Complex (Figure 2). Although the mineralogical composition of granite includes minerals such as quartz and feldspar, which have low intrinsic electrical conductivity, resistivity measurements can be influenced by the presence of biotite (a conductive mineral) and by water saturation in fracture zones or at the interfaces between mineral grains. Thus, the impact of granite on measurements depends on both its composition and its structural characteristics, such as the degree of fracturing and the associated water content. In the specific case of the study area, these variables were taken into account when interpreting the electrical resistivity data, making it possible to distinguish between granite and diabase, even with similar apparent resistivities.
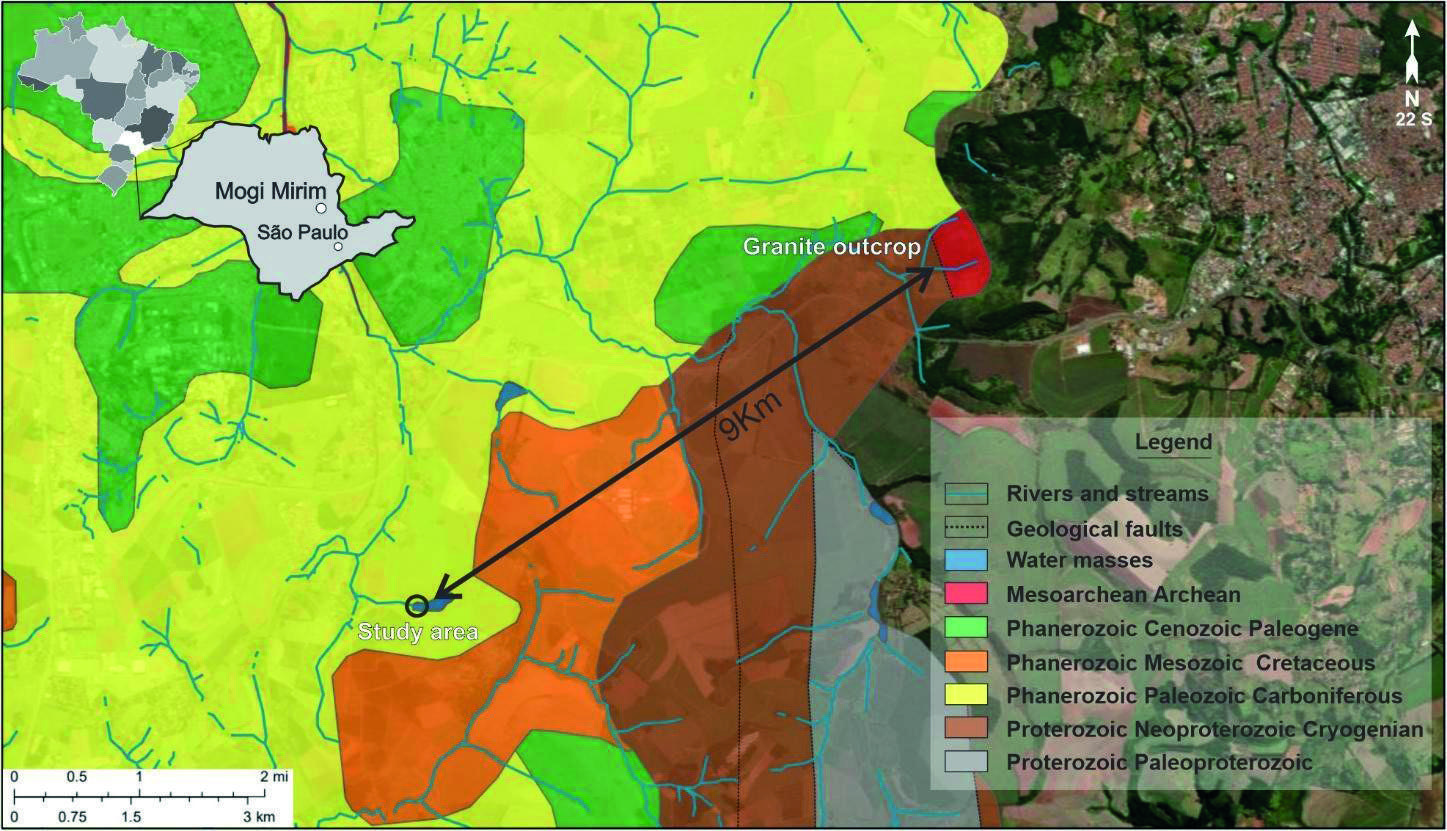
Figure 2. Geological map of the study area with the age of each lithology and highlighting the distance between the granite outcrops typically present in this area of the state of São Paulo and the quarry.
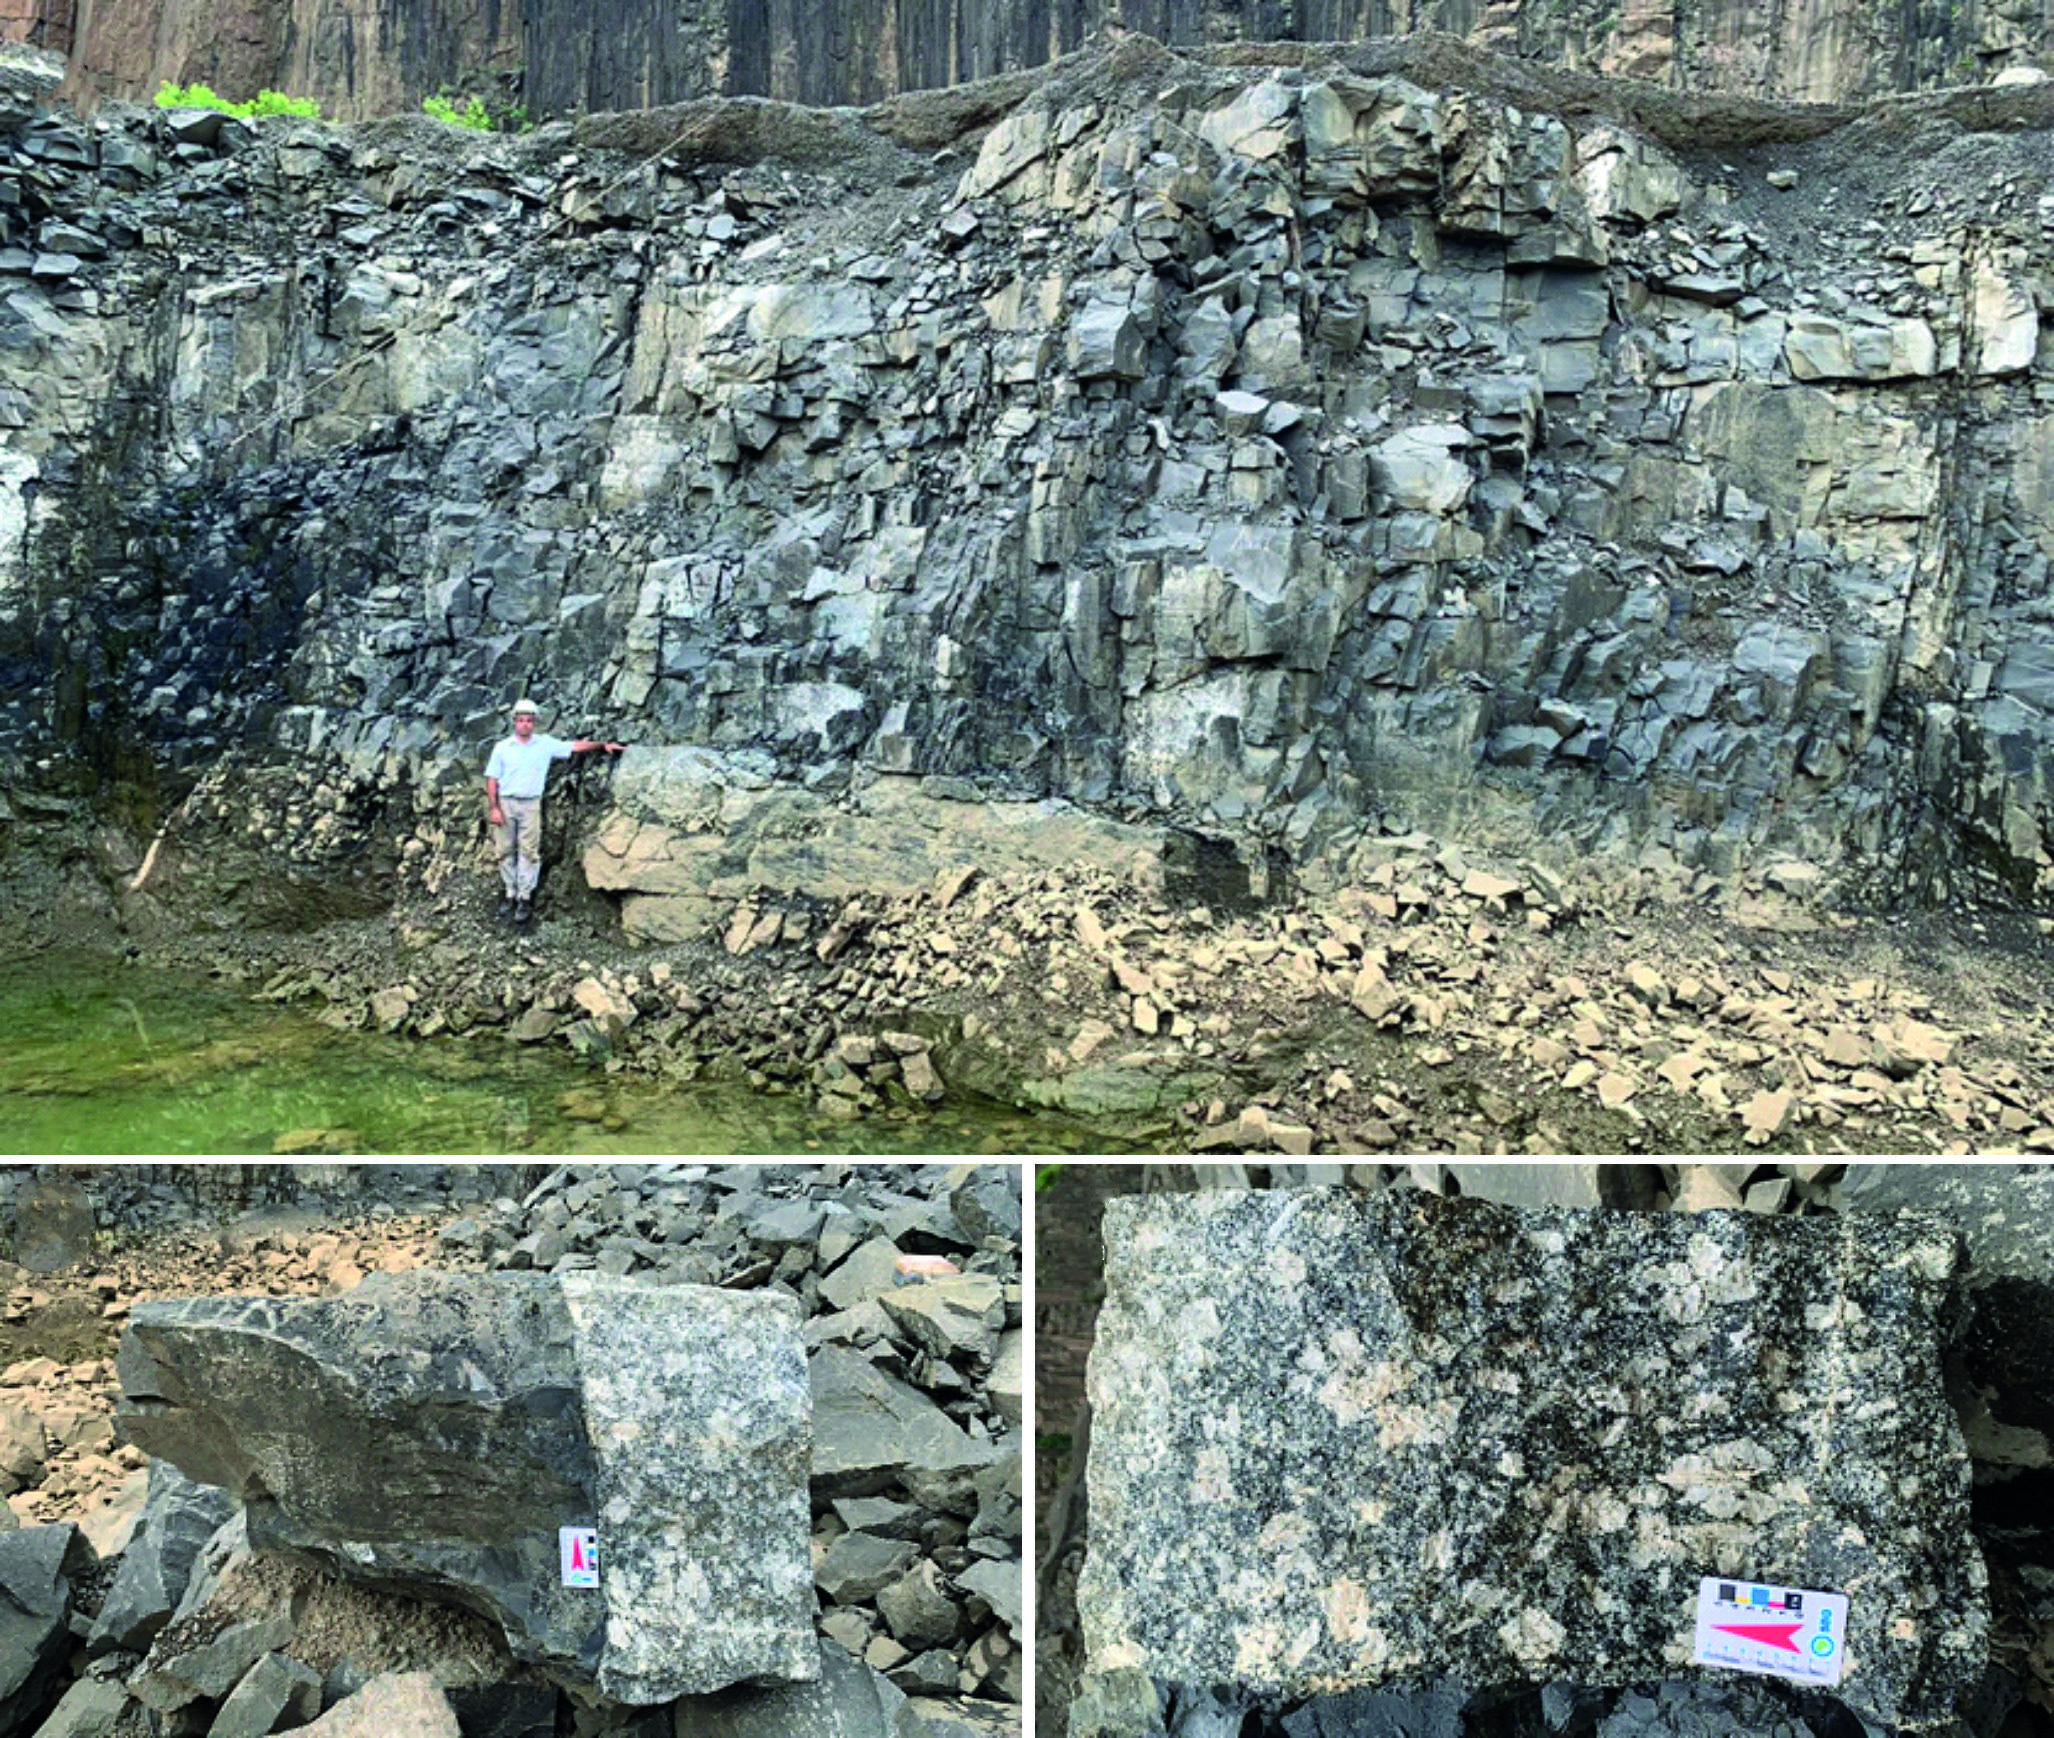
Figure 3. Diabase block in contact with gray porphyritic granite (left), detail of porphyritic granite with dark gray matrix composed of biotite and quartz (right), mining front with contact between strongly fractured columnar diabase (above) and porphyritic granite with not very expressive horizontal fractures (below).
The contact between the rocks is abrupt and the regional geological context allows the granite to be characterized as a diabase xenolith. Granitic exposures occur about 9 km from the study area and their presence within a basic intrusive can be attributed to the incorporation of fragments of the crystalline basement (Amparo Complex - ages between 2.95 G.a. and 2.72 Ga.) during the ascent of basic magmas attributed to the Serra Geral event (ages between 135 M.y. and 130 M.y.). The age estimates of the Amparo Complex have been derived using Sr, Nd, and Pb isotopic systematics, with initial isotopic ratios indicating the timing of magmatic events and the processes involved (Hasui 2010; Rocha--Júnior et al. 2013; Machado et al. 2018; Oliveira et al. 2019). These data suggest that the granite was incorporated during the ascent of basic magmas, with an estimated age range of 135 to 130 million years, consistent with the timing of the Serra Geral event. The Amparo Complex is an essentially metasedimentary unit, of Trans-Amazonian age, made up of biotite and hornblende gneisses, with a predominance of plagioclase feldspar and subordinately garnet, diopside or sillimanite. The gneisses are generally anatexisitic, with a striped, banded, folded structure and various other characteristics of migmatites. The composition of these rocks includes monzon-granitic, granodioritic, tonalitic, and, subordinately, dioritic and monzodioritic terms with more or less quartz (Wernick, 1972; Oliveira et al. 2004). Several other rocks occur intercalated with the gneisses: granitic gneisses, quartzites of varying composition, gondites, amphibolites, calc-silicates, marbles, granulites and charnockites, schists (with graphite, sillimanite/cyanite, garnet) and metaulted rocks transformed into amphibolites (Wernick & Penalva, 1980). The lithology of the Amparo Complex suggests an origin from a thick psammitic to pelitic and chemically impure sedimentary package, with the intercalation of a large number of basic igneous bodies and, more rarely, ultrabasic ones (Wernick et al. 1993).
Materials and Methods
The geophysical method of Electroresistivity is based on contrasting properties such as the electrical resistivity of geological materials like soils and rocks. The electrical resistivity of these materials is mainly affected by four factors: mineralogical composition, porosity, water saturation and dissolved salt content, as well as issues such as texture and internal structuring (Kearey et al. 2002). The degree of water saturation and salinity drastically change how difficult or easy it is for electrical currents to pass through geological materials. The main rock-forming minerals such as feldspars, quartz and micas exhibit the behavior of electrical insulators, based on complex crystalline arrangements of silicon and oxygen (silicates) (Lowrie, 2007). Porosity in sedimentary rocks and fractures in crystalline rocks are the main spaces where fluids such as water can be stored and transmitted. However, the effect of porosity on resistivity varies depending on whether the porosity is primary (e.g., intergranular spaces in sedimentary rocks) or secondary (e.g., fractures or fault zones in crystalline rocks). In primary porosities, the resistivity is primarily influenced by the water content, as the voids are often filled with water, and the material's resistivity decreases as the water saturation increases. In contrast, secondary porosities, such as fractures, can cause more complex effects on resistivity. Fractures can either be filled with water, air, or other fluids, and their resistivity response will depend on the nature of the fluids within them. Fractures filled with conductive fluids (such as salty water) will significantly reduce the resistivity, while fractures filled with non-conductive fluids (such as air) will result in higher resistivity values. Therefore, differentiating between primary and secondary porosities in resistivity measurements requires careful consideration of the fluid content and the extent of fracturing or pore connectivity (Oliveira et al. 2022). Increasing the degree of humidity proportionally reduces the electrical resistivity of this material, up to situations of complete saturation or filling of empty spaces in aquifers, characterized by low resistivity values in relation to dry areas for the same geological material (Lowrie, 2007).
The methodology used in this study is divided into sequential steps to ensure replicability. Initially, the study area was prepared by identifying locations of interest based on geological and operational conditions relevant to the mining context. Eight electrical resistivity tomography (ERT) lines were set up, with lengths varying between 200 m and 300 m and electrode spacings of 5 m, ensuring adequate spatial coverage and varying orientations over a total of 1,700 linear meters (Figure 4). Electrodes were arranged along these lines to allow for the sequential acquisition of resistivity data. The Schlumberger array technique was employed, which involves injecting an electric current into the subsurface through two electrodes (A and B) while measuring the resulting potential difference using two other electrodes (M and N). This array was selected due to its versatility and efficiency in resolving horizontal layers with contrasting electrical resistivity. Compared to other configurations, such as Wenner or dipole-dipole arrays, the Schlumberger array offers key advantages: it provides a higher signal-to-noise ratio, particularly in environments with low resistivity contrasts, and achieves greater depth penetration for the same electrode spacing (Moreira et al. 2016; Oyeyemi et al. 2022). Furthermore, its configuration minimizes the effects of lateral variations in resistivity, making it particularly suitable for studying stratified subsurface structures. The ability to adjust the spacing between current and potential electrodes independently also allows for more detailed profiling of deeper layers without the need for extensive lateral movements of the entire array (Telford et al. 1990). Due to the heterogeneity of the geological environment, the resistivity measurements obtained in a survey are an average of all the resistivities present in the environment, called apparent resistivity (ρa) and can be calculated by knowing the current intensity (I) introduced by electrodes A and B, the potential difference (∆V) measured by receiving electrodes M and N, and the geometric factor (K) (Eq.1) The K factor is unique for each type of array and can be obtained according to Eq.2.
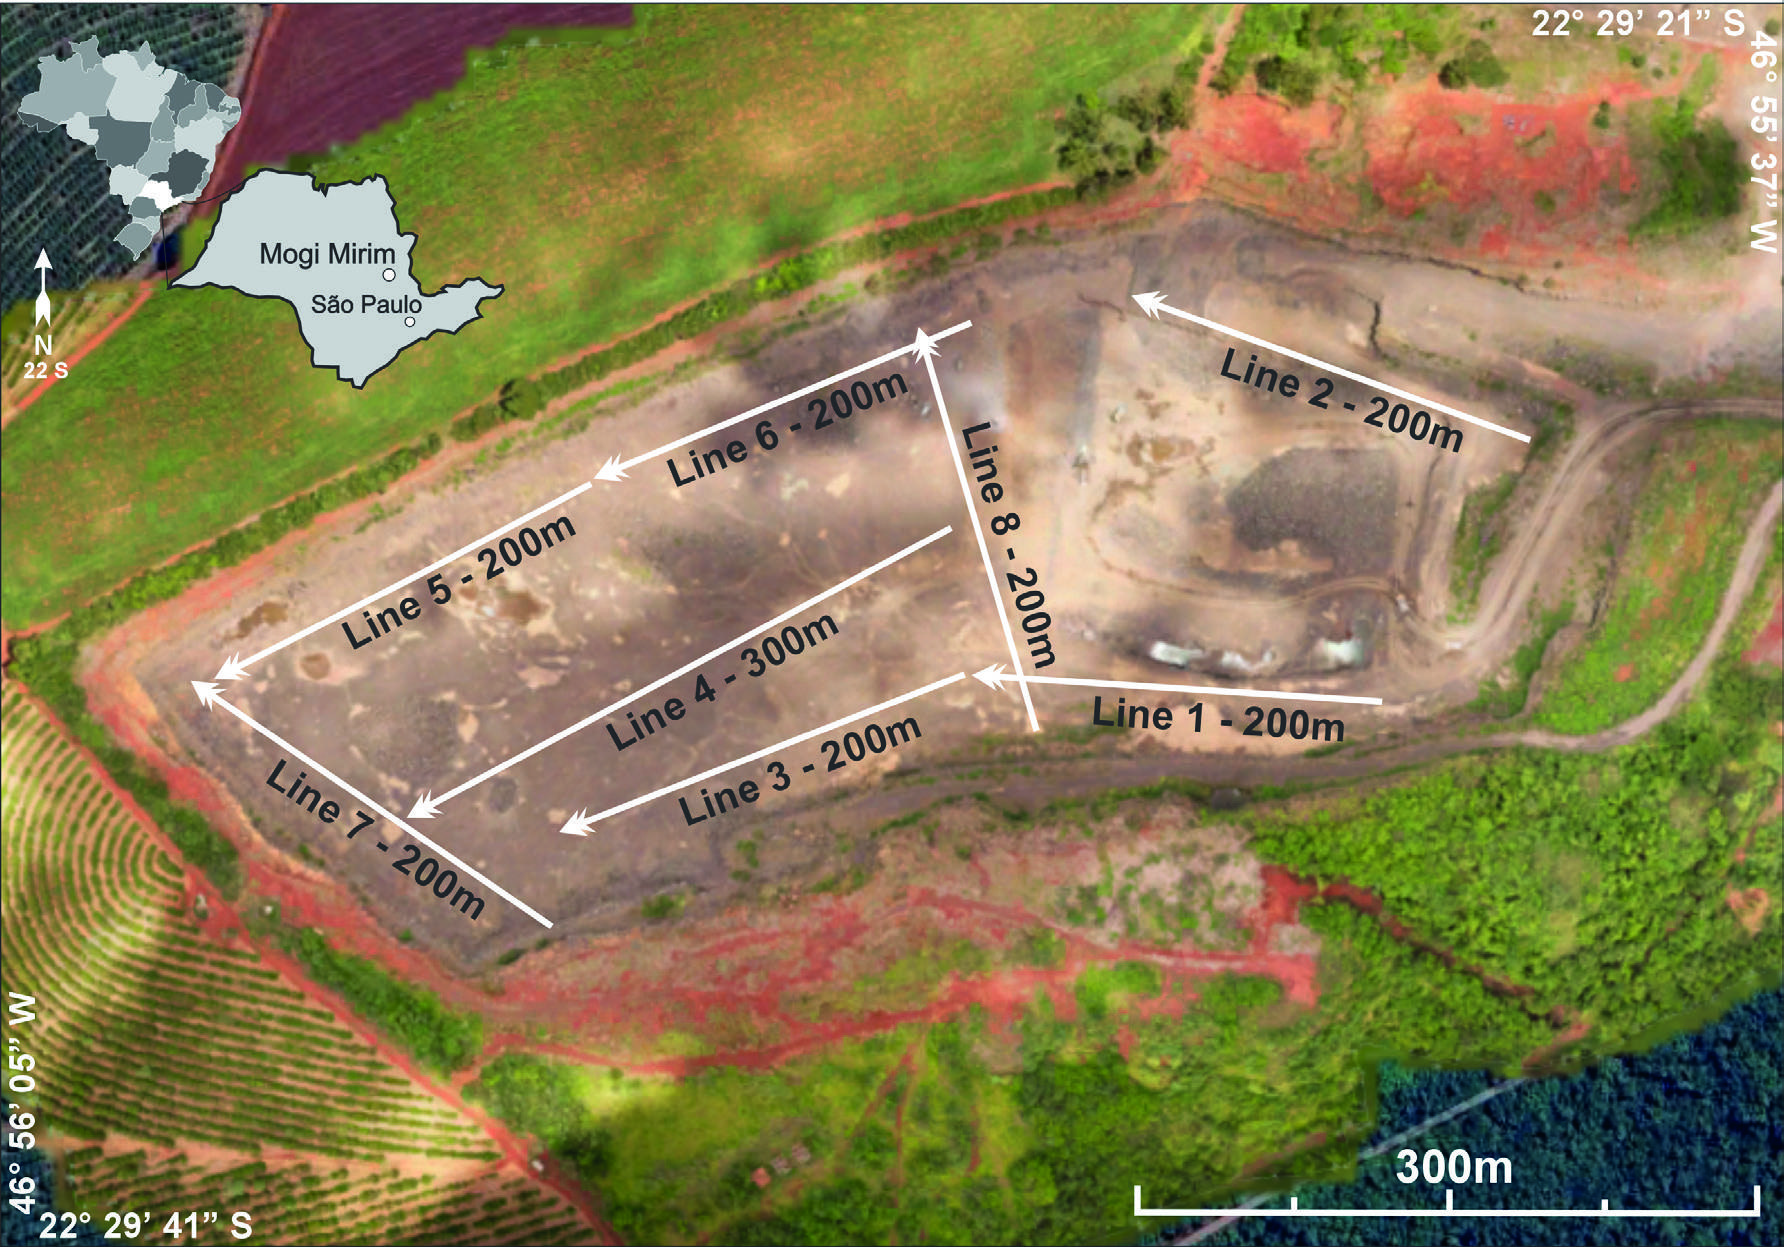
Figure 4. Arrangement of ERT acquisition lines within the quarry. Detailing the good coverage area of the acquisition from the installation of parallel and perpendicular acquisition lines to each other.
Data acquisition was performed using a Terrameter LS tomographic resistivity meter from ABEM, configured with 84 channels, a power output of 250W, a resolution of 1 μV, and a maximum current of 2.5A (ABEM, 2012). Measurements were taken over two consecutive days during the rainy season in January. The acquired resistivity data were tabulated in a spreadsheet, along with the geographical coordinates and elevation of each measurement point. These data were then processed using the RES2DINV software (Geotomo - Malaysia), which employs a non-linear least squares optimization technique to invert the data and generate 2D subsurface models. The inversion of electrical resistivity data is a mathematical process that seeks to transform apparent resistivity data into interpretable geological models (Druskin, 1998). The electroresistivity method is based on the contrasting properties of electrical resistivity in geological materials such as soils and rocks. Electrical resistivity is influenced by factors such as mineralogical composition, porosity, water saturation, dissolved salt content, texture and internal structure (Kearey et al. 2002; Oyeyemi et al. 2022). These factors determine how electrical currents propagate in the subsurface. For example, common minerals in rocks, such as feldspars, quartz and micas, behave as electrical insulators due to their complex crystalline structure of silicon and oxygen (silicates) (Lowrie, 2007). Porosity in sedimentary rocks and fractures in crystalline rocks represent the main spaces for storing fluids such as water, which directly affects the measured resistivity (Oliveira et al. 2022, Moreira et al. 2024).
The inversion method used in this study was implemented in the RES2DINV program, which uses non-linear optimization techniques to determine resistivity models from observed data (Loke & Barker, 1996). The inversion process seeks to adjust the resistivity values of the subsurface model iteratively to minimize the mismatch between the measured and calculated apparent resistivities. This is achieved by minimizing an objective function, which can be defined by Equation 3, where dobs and dcalc are the observed and calculated apparent resistivity data, respectively, Wd is a weighting matrix that accounts for data uncertainties, m is the model vector, representing the resistivity distribution, Wm is a smoothing matrix to impose spatial continuity in the model and λ is the regularization parameter, controlling the trade-off between data misfit and model smoothness. However, the inversion of geophysical data is inherently affected by the problem of non-uniqueness, in which different resistivity distributions can produce similar responses in the measured data (Ellis & Oldenburg, 1994; Binley & Kemna, 2005). This issue was addressed systematically throughout this study, using specific strategies to reduce uncertainty and increase the reliability of the models obtained. Firstly, the Schlumberger array was chosen for acquiring electrical tomography data precisely because it is an array characterized by its high signal-to- noise ratio and good sensitivity for discriminating horizontal layers of contrasting resistivity (Telford et al. 1990; Menke, 2012). This configuration allows for robust data collection in geologically heterogeneous environments, minimizing potential ambiguities associated with non-communicity (Dahlin & Zhou, 2006). The Root Mean Square (RMS) error, which quantifies the difference between the observed and modeled resistivity data, was calculated for each inversion process. All RMS errors obtained were below 10%, which is considered acceptable for this type of study (Loke et al., 2003). This low RMS value indicates that the resistivity models are consistent with the measured data and that the discrepancies are within a range typically attributed to minor numerical errors or natural geological variability. These errors do not significantly compromise the interpretation of the results but rather reflect the inherent complexity of geophysical data inversion in heterogeneous environments.
Processing in the RES2DINV software begins with the generation of a resistivity model, which is represented by a grid of rectangular blocks corresponding to the data points in the pseudosection. The software automatically determines the size and distribution of these blocks based on the input data. The resulting 2D resistivity sections use chromatic representations, where warm tones indicate high resistivity and cool tones indicate low resistivity, making it easier to interpret geological features. To ensure consistent interpretations, the 2D sections generated were analyzed in conjunction with interpolated 3D models, enabling a broader assessment of anomalies and geological structures. This multi-scale approach made it possible to verify spatial coherence and reduce uncertainties associated with interpretations based solely on 2D models. To build a 3D model, the 2D sections were interpolated using the kriging method on the Oasis Montaj platform (Geosoft). Kriging is a geostatistical interpolation technique that predicts spatial values by minimizing the variance of estimation errors based on the spatial correlation of data points. The interpolation process smoothes the central values while minimizing edge effects using the minimum curvature technique. Statistical criteria and a sampling grid were applied to generate blocks representing different depths, allowing for the creation of detailed maps of subsoil resistivity variations. This statistical approach reduces the influence of outliers and strengthens the stability of the final models, helping to mitigate the problem of non-uniqueness. This workflow is in line with similar approaches reported in the literature (Aizebeokhai et al. 2011; Moreira et al. 2016; Moreira et al. 2017; Cortês et al. 2019; Helene et al. 2020).
Results and discussions
The geophysical acquisition was preceded by a local geological survey to identify the main geological elements and their influence on physical properties that can be measured using the ERT technique. The structural context and water percolation are fundamental factors for this type of geophysical technique, which is based on contrasting the electrical properties of the physical environment. Columnar diabase presents highly permeable conditions in terms of groundwater flow, the presence of which in this type of rock drastically reduces its resistance to the transit of electric current, i.e. an electrically conductive rock (low electrical resistivity). The low degree of fracturing in granite makes it relatively impermeable, which contributes to its classification as an electrically insulating rock, characterized by high electrical resistivity. Granite's mineralogical composition, primarily feldspar and quartz, is inherently resistant to electrical conductivity. However, the impermeability is predominantly due to its low fracture density, as fractures are the primary pathways for fluid movement and storage in crystalline rocks. The absence of interconnected fractures significantly limits the presence of water, which is a key factor in reducing resistivity in geological materials. The contact between the diabase and granite is abrupt, as evidenced by the contrasting resistivity values observed in the data. The granite's horizontal fractures are sparse and isolated, further limiting fluid percolation. This abrupt contact can be attributed to differences in lithological properties and the intrusive nature of the diabase, which cooled rapidly, preserving the distinct boundaries with the pre-existing granite. These characteristics highlight the granite's electrical behavior as being dominated by its structural and mineralogical properties, rather than external influences such as fluid saturation or weathering. This context implies an interface of low permeability for the water infiltrating the diabase, something that configures an aquifer level over this interface, the base of which lies precisely at the diabase/granite contact. This fundamental hydrogeological/structural context was adopted as a criterion for acquiring, processing and discussing the results. The results are presented and analyzed in a direct manner, i.e. 2D inversion model in terms of electrical resistivity. The local geological context made it possible to condition the analysis and interpretation of the data into 2 distinct groups: saturated diabase (between 300 Ω.m and 3600 Ω.m) and dry granite (between 3600 Ω.m and 10,000 Ω.m).
ERT line 1 was strategically positioned over the mining front with exposure of saturated fractured diabase laid on dry weakly fractured granite, for correlation or calibration between geological/hydrogeological elements and geophysical results, which were later replicated for the other geophysical results. This line crosses the interval of lowest topography in the pit, with elevations between 640m and 642m, positioned at the southern limit of the bottom of the pit. On this line, a correlation was made between geological elements visible at the mining front and geophysical results. The water- saturated diabase was characterized by a horizontal layer with electrical resistivity between 300 Ω.m and 3600 Ω.m, with a thickness between 9 m and 15 m, supported by dry granite with resistivity between 3600 Ω.m and 10,000 Ω.m (Figure 5). The resistivity values observed for the saturated diabase are consistent with its lithological characteristics and the presence of water in interconnected pores or fractures, which significantly reduces resistivity by enhancing ionic conduction. In contrast, the dry granite's higher resistivity is attributed to its low porosity and minimal water content, as well as its composition dominated by insulating minerals like quartz and feldspar. Line 2 was acquired parallel to ERT line 1, but positioned on the north-eastern edge of the pit bottom, at elevations between 642m and 643m. This section showed an outcropping horizon of saturated diabase from the surface to a depth of 8m, overlying dry granite with horizontal cores and in a large central area, from the surface to a depth of 45m, flanked by two diabase cores below a depth of 17m (Figure 5).
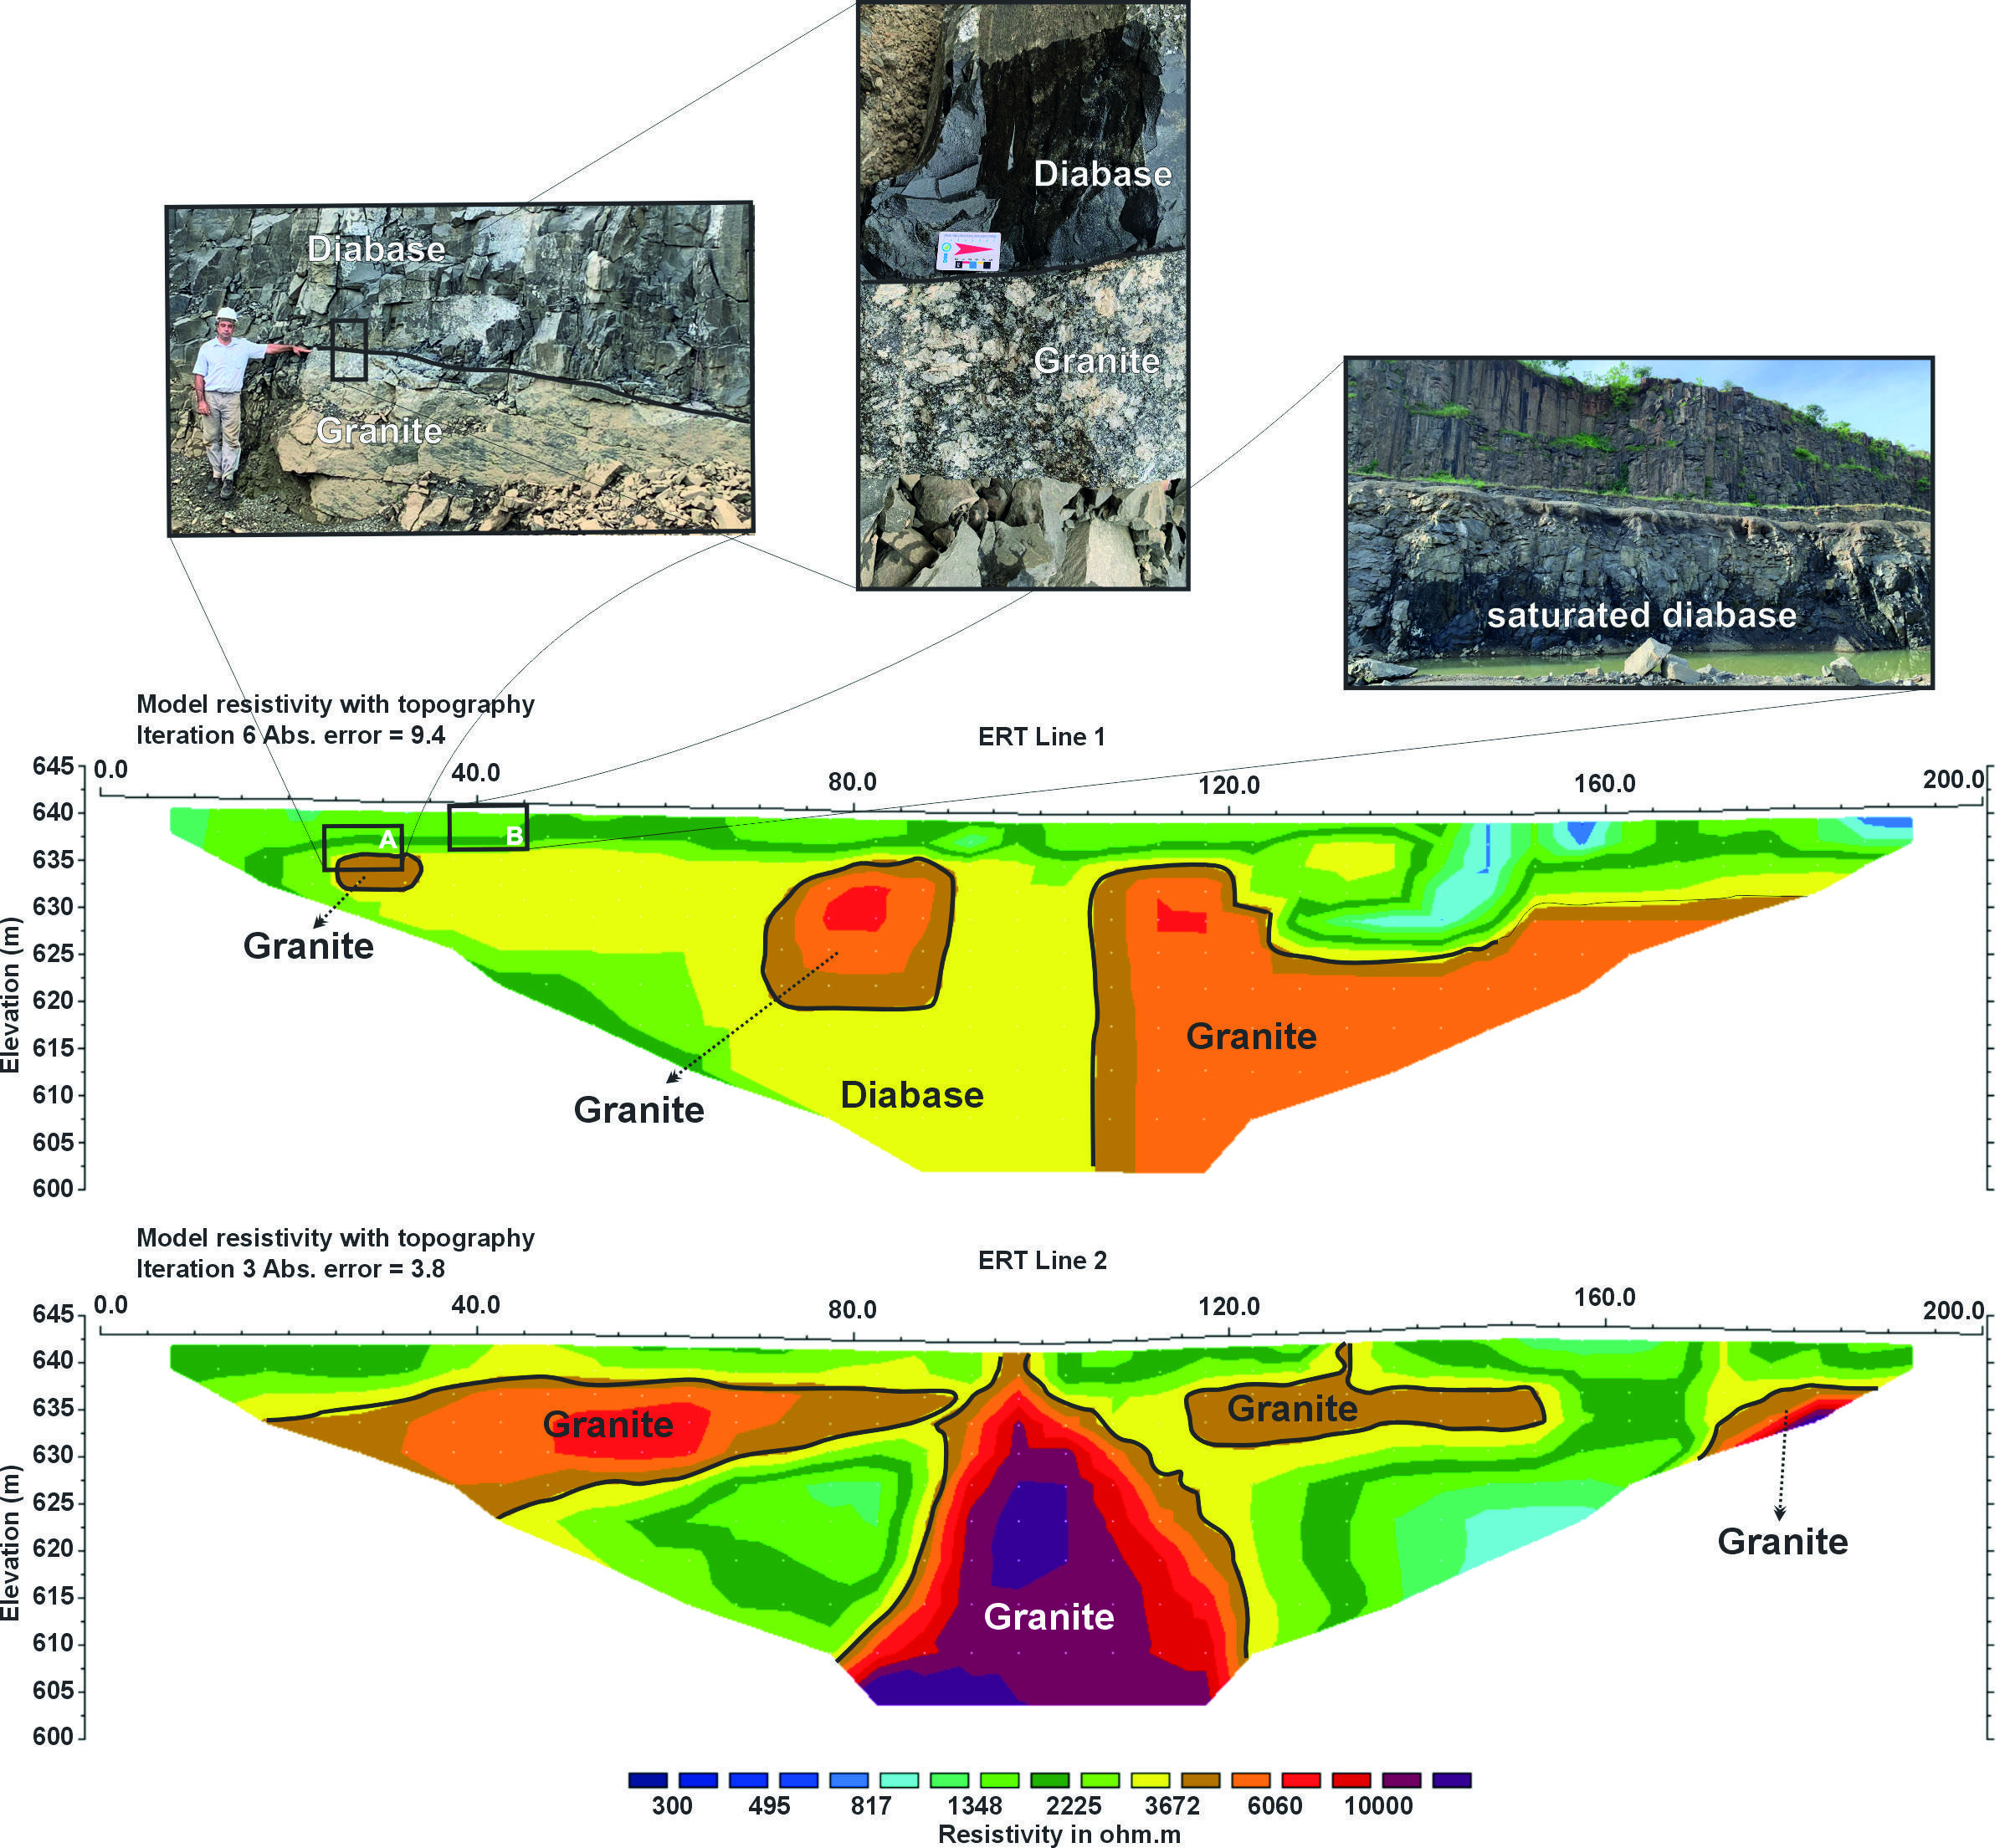
Figure 5. Inversion model for ERT line 1 correlated with geological/hydrogeological elements exposed at the mining front and ERT line 2 acquired in parallel with interpretation of electrical anomalies.
Line 3 goes to the highest part of the pit from the end of line 1, with elevations between 642m and 648m, positioned at the southern limit of the bottom of the pit. In this case, saturated diabase occurs from the surface to a depth of 35m. Dry granite occurs in scattered cores and in a large central area, from the surface to a depth of 45m (Figure 6). Line 4 crosses the bottom of the pit for its longest length, a total of 300 m, positioned in the central part of the bottom of the pit, at elevations between 643 m and 648 m. This section has an outcropping horizon of saturated diabase from the surface to a depth of 10 m, superimposed on a layer of dry granite approximately 20 m thick, with cores halfway down the section. Line 5 was acquired perpendicular to line 7 and parallel to lines 1 and 3, positioned on the northwestern edge of the pit bottom, at elevations between 647m and 649m. This section has similar features to line 3, with saturated diabase present from the surface to a depth of 35m. Dry granite occurs in scattered cores and in a large central area, from the surface to a depth of 45m (Figure 6). Line 6 was acquired following line 5, also positioned on the northwestern edge of the pit bottom, at elevations between 644m and 647m. This section is relatively similar to line 7, with an outcropping horizon of saturated diabase from the surface to a depth of 10m, superimposed on a layer of dry granite between 15m and 20m thick, below which saturated diabase occurs (Figure 6).
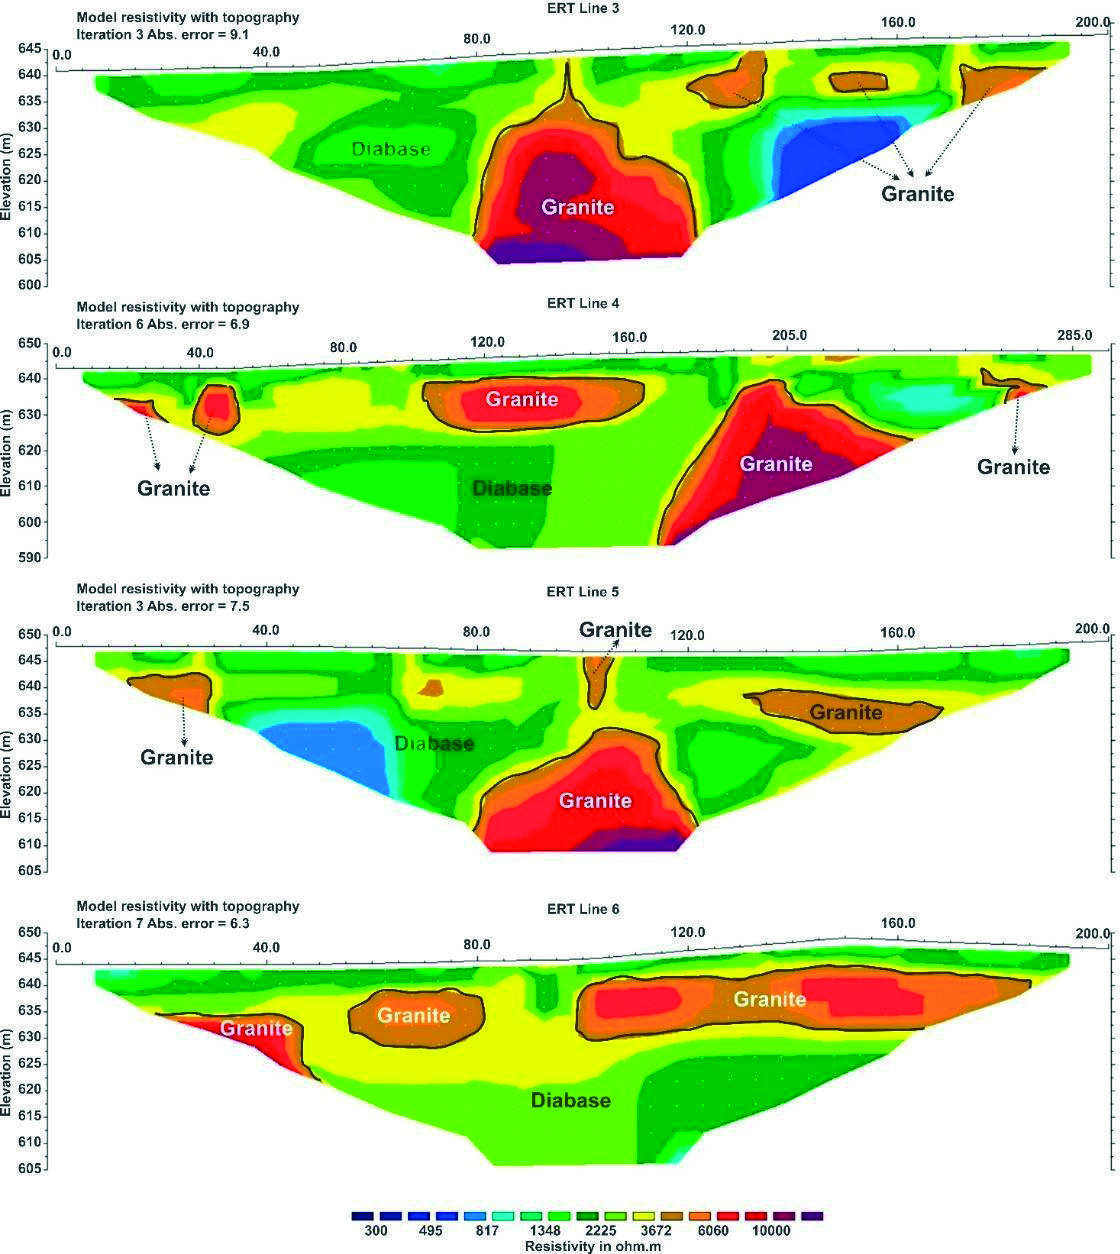
Figure 6. Inversion model for ERT lines 3, 4, 5 and 6, highlighting the interpretations of the electrical anomalies consistent with the ranges of values associated with the presence of diabase and granite in the mine area.
The presence of saturated diabase at shallow depths correlates with significantly lower resistivity values due to the high water content within the fractures or pores, enhancing ionic conductivity in the material. The dry granite, on the other hand, exhibits much higher resistivity because of its low porosity and minimal water content, characteristics typical of this lithology. A broad diabase layer occurs in the initial half of the section, between 20 m and 45 m deep (Figure 6). The deeper diabase layer, exhibiting a more homogeneous resistivity profile, indicates a more consistent water saturation throughout, likely due to the presence of more extensive fracture networks or localized fluid migration within the diabase. This water saturation lowers the resistivity in comparison to the surrounding dry granite, demonstrating the impact of both lithology and water content on geophysical measurements. The contrast in resistivity between the saturated diabase and dry granite in this section is an essential marker for identifying the spatial distribution of these materials in the subsurface. The variations observed are linked to the combined effects of mineral composition, porosity, and fluid saturation, which influence the electrical resistivity response.
ERT lines 7 and 8 were oriented in a NW-SE direction and were positioned at the western and eastern ends of the pit, respectively. Line 7 was positioned on the southwestern edge of the pit bottom, at an elevation of between 648 m and 649 m. In this section, saturated diabase occurs as a horizontal outcropping layer up to a depth of 8 m. The lower resistivity values observed in this layer are consistent with the presence of water saturation within the diabase, as water increases the ionic conductivity of the material. Below this, the dry granite occurs in a wide horizon band between 8 m and 25 m deep. The granite exhibits significantly higher resistivity values due to its low porosity and the absence of interconnected water-filled fractures. Below this layer, the resistivity values decrease again, indicating the return of saturated diabase, suggesting the presence of deeper fracture zones filled with water (Figure 7). Line 8 was acquired parallel to line 7, positioned in the central part of the pit bottom, at elevations between 641 m and 643 m. This section is relatively similar to line 2, with an outcropping horizon of saturated diabase from the surface to a depth of 8 m. The resistivity values here again reflect the influence of water-filled fractures in the diabase. This horizon is underlain by dry granite with horizontal and central vertical cores, extending from 8 m to 45 m deep. The central granite core is characterized by higher resistivity values, indicating minimal water content and greater structural integrity, while the diabase layers adjacent to this core, with thicknesses up to 20 m, show lower resistivity, reflecting water saturation. These variations in electrical resistivity along the sections are mainly controlled by the distribution of water in the subsurface, which depends on the lithological and structural characteristics of the diabase and granite. The electrical resistivity contrasts provide a clear delineation of the water-bearing zones and emphasize the influence of fractures and lithology on geophysical responses.
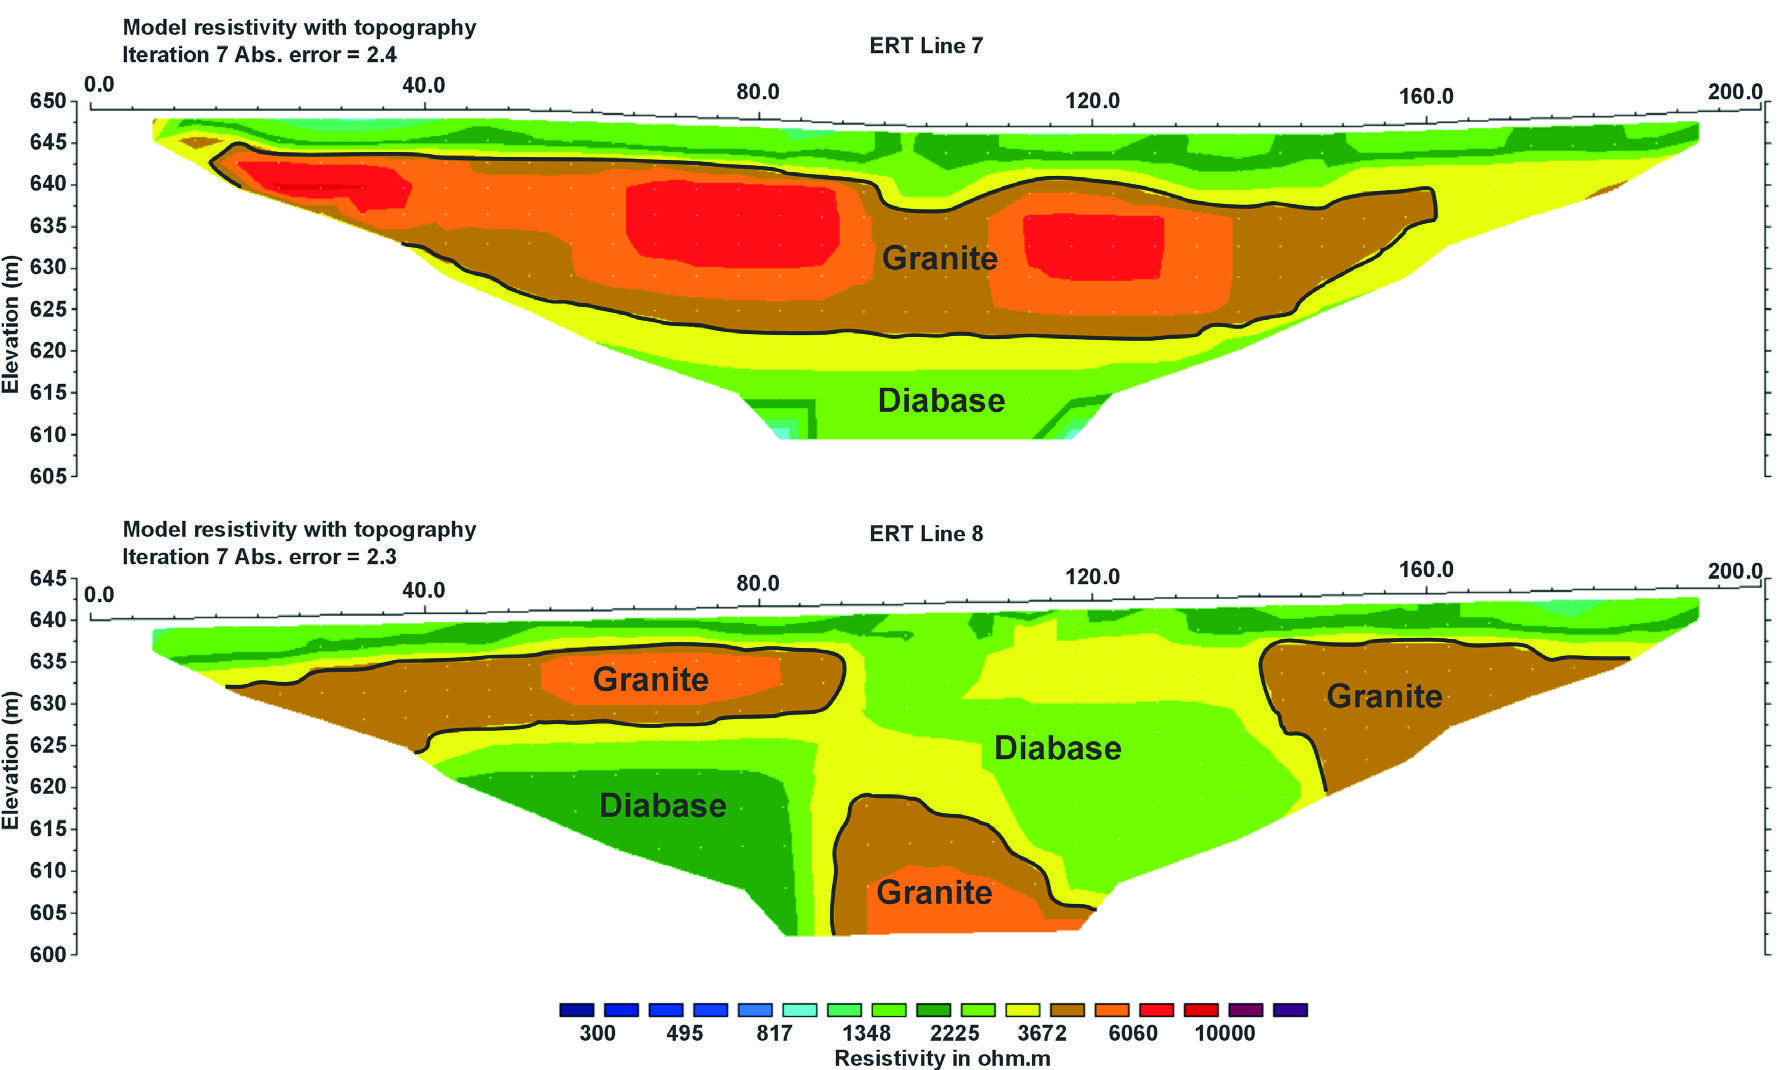
Figure 7. Inversion model for the ERT lines oriented in a NW-SE direction (Lines 7 and 8), highlighting the interpretations of the electrical anomalies consistent with the ranges of values associated with the presence of diabase and granite in the mine area.
In order to assess the complexity of the study area in terms of the distribution of granite sites under the diabase, the geophysical data was further processed into three-dimensional models. The data was interpolated to generate block models and resistivity maps for various depths. The electrical resistivity maps produced for different depths can be used to help plan future mining operations. The electrical resistivity map for the 633m level is close to the current base of the mine pit, also close to the level where the diabase/granite contact occurs. In this map it was possible to correlate the contact interface with a zone of high electrical resistivity. This pattern is recognizable in regions of the pit and can be related to connected or independent granite bodies, interspersed with water-saturated diabase (Figure 8). The electrical resistivity map for elevation 623m is positioned approximately 10m below the base elevation of the pit. The areas of high resistivity or granite are comparatively larger compared to the previous map, but are also interspersed with water-saturated diabase (Figure 8). The electrical resistivity map for elevation 613m is positioned approximately 20m below the pit's base elevation. The areas of high electrical resistivity or granite are comparatively larger compared to the previous maps, but are also interspersed with water-saturated diabase (Figure 8).
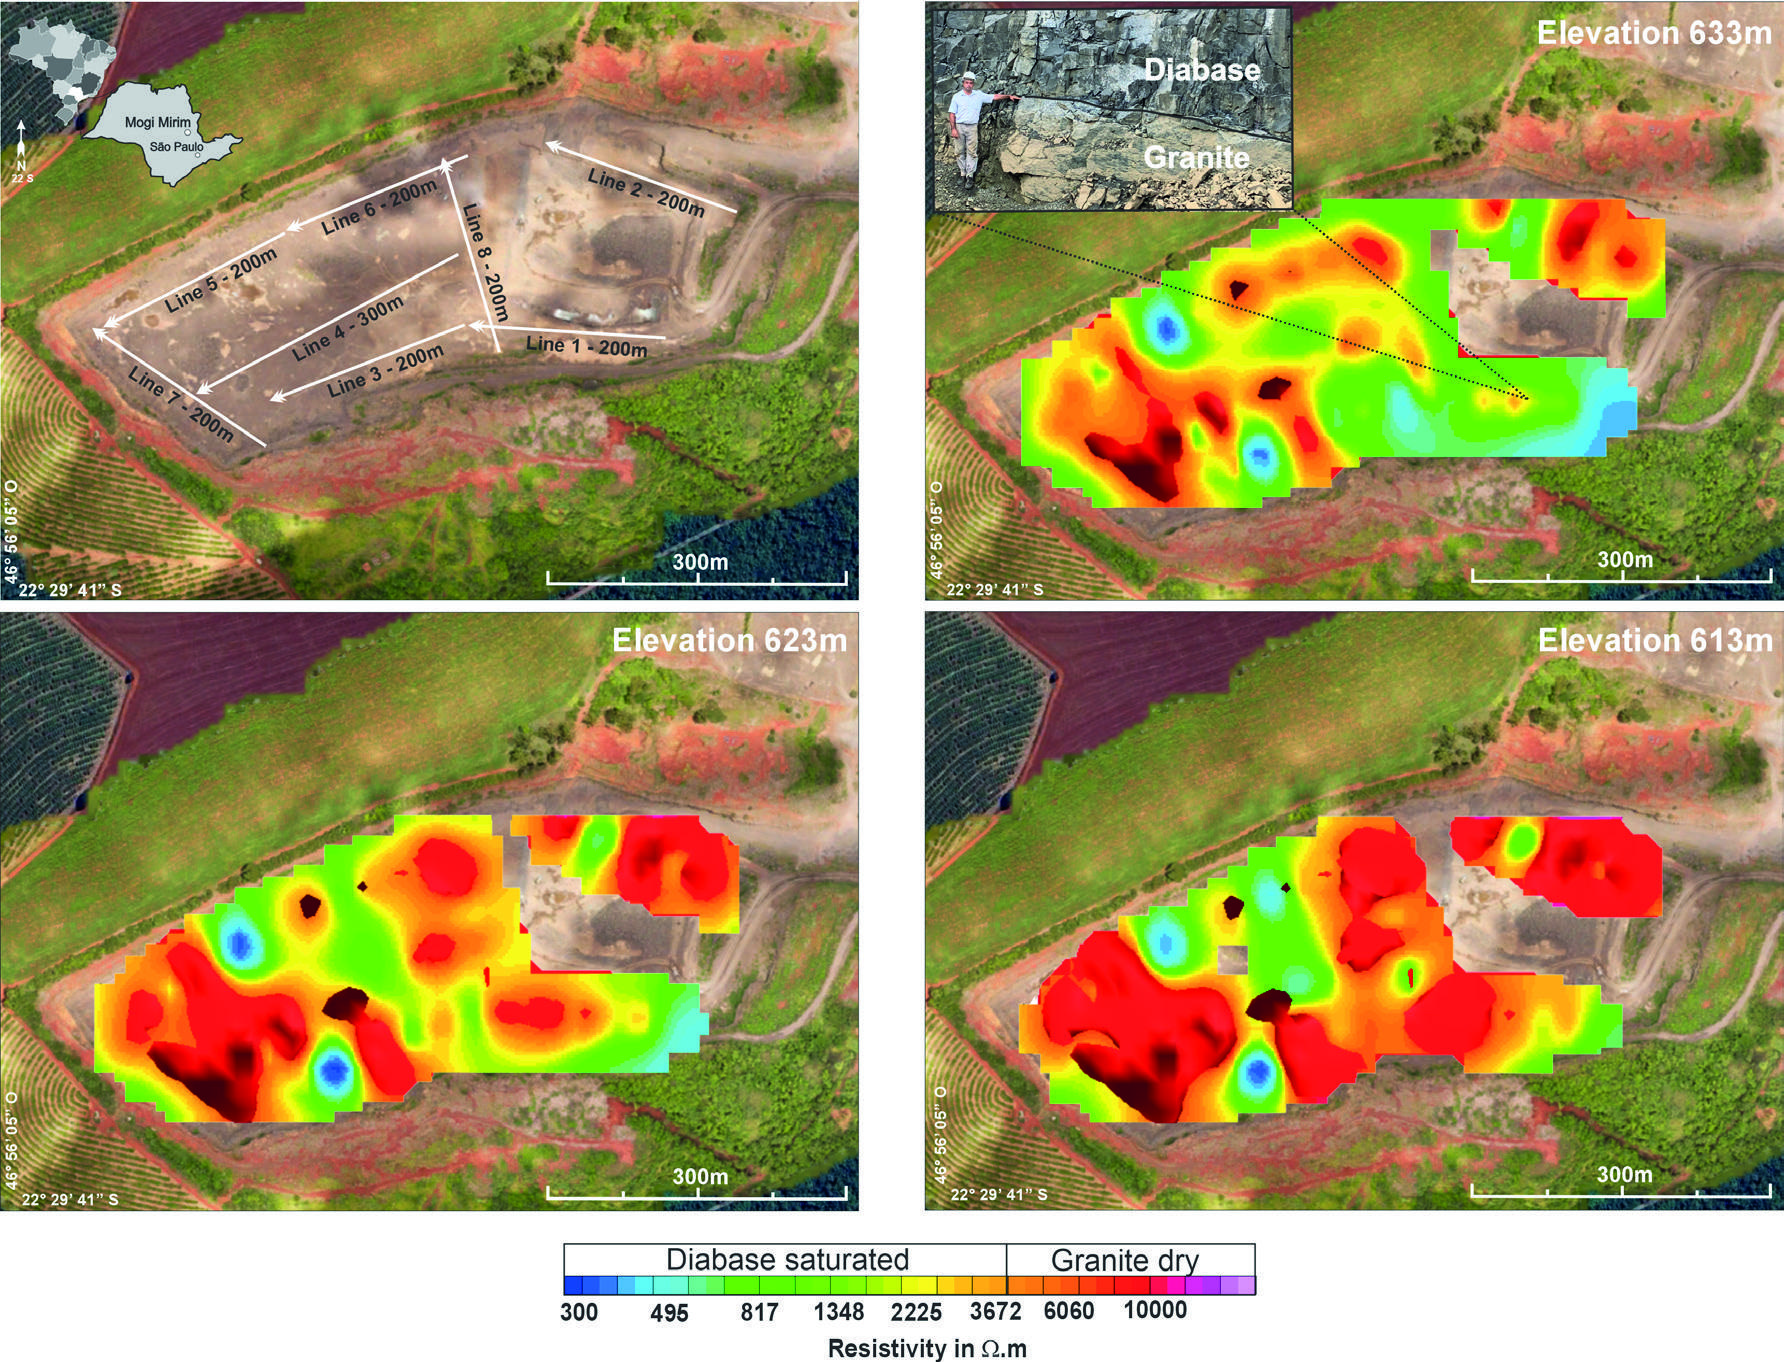
Figure 8. Maps of electrical resistivity values for the 633m, 623m and 613m elevations in the mine pit area.
The relatively random distribution of granite in the basic intrusive indicates that, during the ascent of the basic magma, parts of the granitic basement were broken up, fragmented and incorporated into the magma, a process known as xenolith assimilation. This geological process explains the presence of granite fragments in the diabase matrix, forming a heterogeneous composition in the subsurface. Granite and diabase, although closely associated spatially, are products of different geological histories. The granite crystallized at great depths under conditions of high pressure, leading to the slow formation of large plagioclase crystals up to 5 cm long. In contrast, diabase formed at relatively shallower depths due to faster cooling rates, resulting in an aphanitic texture. The crystallization conditions of these rocks are directly reflected in their fracture patterns and permeability. Granite, due to its deep and stable formation environment, has low fracturing and porosity, making it a relatively impermeable rock. In contrast, diabase, which is subject to rapid cooling and tectonic stresses, is characterized by a greater degree of fracturing, increasing its permeability and ability to store and transmit water. During the geophysical survey, carried out in the rainy season, these lithological and structural differences became particularly evident. Rainwater infiltrated the diabase more effectively due to its permeable nature, saturating the fractures and significantly reducing its electrical resistivity. Meanwhile, the impermeable granite resisted water infiltration, maintaining higher resistivity values. This seasonal effect of water saturation amplified the contrast in electrical properties, providing a clear geophysical distinction between the diabase and granite intervals. Therefore, the electrical resistivity contrasts observed are not only the result of lithological differences, but also reflect the hydrological behavior of these rocks under specific seasonal conditions. This highlights the role of geological characteristics and the time of the survey in revealing the distribution of subsurface resistivity, supporting the interpretation of permeable diabase and impermeable granite intervals.
Part of the zones of high electrical resistivity attributed to granites may be made up of massive diabase, a scenario which makes it impossible to discriminate between rocks based on similar electrical resistivity values. It is likely that the joints and fractures visible in mining fronts are partly attributed to blasting and decompression events due to rock removal. However, the columnar disjunction is a recurring structure in all the exposed faces in the pit and a characteristic of the diabase in this area. In this sense, the possible existence of massive diabase is somewhat unrepresentative. Certainly, the intervals of low electrical resistivity represent areas of water-saturated diabase.
Conclusions
The geophysical results were highly effective in distinguishing and mapping diabase and granite, which are characterized as electrically conductive and highly resistive, respectively, mainly due to the mineralogical dominance of silicates. The unique structural characteristics of the study area, such as the columnar junction in diabase and the horizontal fractures in granite, were incorporated into the planning of the geophysical survey to optimize data acquisition and interpretation. The survey was strategically conducted during a rainy week, a period that facilitated significant water infiltration into the fractured diabase, resulting in high levels of saturation. This condition led to the formation of a perched water table and a temporary aquifer within the contact zone between the diabase and granite. The observed electrical resistivity contrast reflects the hydraulic behavior of these rocks: the fractured and permeable diabase allowed for extensive water infiltration, drastically reducing resistivity values in this interval. In contrast, the granite, exposed at the pit bottom, presented a weakly fractured structure with predominantly horizontal discontinuities, indicating very low permeability. This impermeable granite acted as a structural base for the temporary aquifer, supporting the overlying saturated diabase. Results from the geophysical data reinforce these interpretations. In areas where columnar jointing was prominent in the diabase, resistivity values were significantly lower, correlating with zones of increased water saturation and fracture density. Conversely, the granite intervals showed consistently high resistivity values, corresponding to weakly fractured, dry sections. These findings align with field observations of structural discontinuities in the granite, where horizontal fractures were evident but did not contribute significantly to permeability. This seasonal hydrological scenario amplifies the resistivity contrasts, highlighting the influence of structural features on water distribution and geophysical responses. The data suggest that the degree and orientation of fracturing, particularly in the diabase, play a pivotal role in controlling the infiltration and storage of water, which in turn governs the electrical properties of the subsurface.
The planning of geophysical studies must take into account geological and hydrogeological issues and their local specificities, which sometimes serve to justify the unfeasibility of using geophysics or specific geophysical methods, but which in some scenarios are fundamental allies for the viability of the tool and obtaining satisfactory results. The possibility of carrying out a geophysical line on an exposure of saturated diabase in contact with granite was decisive in recognizing the average values of electrical resistivity and calibrating indirect data based on a real and direct variable. It took 6 days between visits for geological reconnaissance, planning, data collection and processing, in a study that allowed detailed investigations using 1,700 linear meters of electrical resistivity tomography and 2,140 resistivity measurements, distributed to cover 90,000m 2. Direct investigations using roto- percussive drills typical of small-scale mining operations, used to drill holes for placing explosives and blasting rock, would require months of work to achieve an approximate result in terms of coverage area and level of detail, which is clearly counterproductive and unfeasible in economic and logistical terms. In this context, technologies such as geophysics can be an important ally for small-scale mining operations, whether in the mineral research phase, short or medium-term mining planning, or even in the decommissioning phase, with significant gains in terms of scope and detail, as well as savings in time, technical and financial resources.

