


 nueva página del texto (beta)
 Inglés (pdf)
 Artículo en XML
 Referencias del artículo
 Enviar artículo por email
 Citado por SciELO
  Similares en
SciELO
Similares en
SciELO 
 Permalink
1. Introduction
Good quality groundwater resources are fundamental for sustaining basic human needs (Akhtar et al., 2021). Factors such as industrial growth, flooding, earthquakes, low rainfall, glacier volume reduction, and river path diversion for hydropower generation can disrupt aquifer systems (Akhtar et al., 2004; Lee et al., 2016). Earthquakes not only damage infrastructure but also influence groundwater quality (Plapp and Werner, 2006; Nakagawa et al., 2020). Earthquakes can affect the half-filled pores of underground rocks, leading to a deterioration in water quality (Akhtar et al., 2021). Water quality in a region may be affected by seismic activity, which disturbs subsurface sediments and increases turbidity. Proximity to sewerage lines can lead to elevated electrical conductivity and alkalinity in shallow boreholes. Seasonal variations such as monsoon rains introduce surface contaminants and enhance leaching of dissolved solids. Natural geogenic factors including rock formations contribute to the presence of elements like iron, sulfate, and nitrates. Additionally, anthropogenic pollution from agriculture, industrial discharge, and waste disposal poses a risk to groundwater quality (Nisar et al., 2024a; Nisar et al., 2024b). The coseismic liquefaction phenomenon is a significant geohazard in seismically active regions often resulting in surface deformations such as sand blows, lateral spreading, and ground failures.
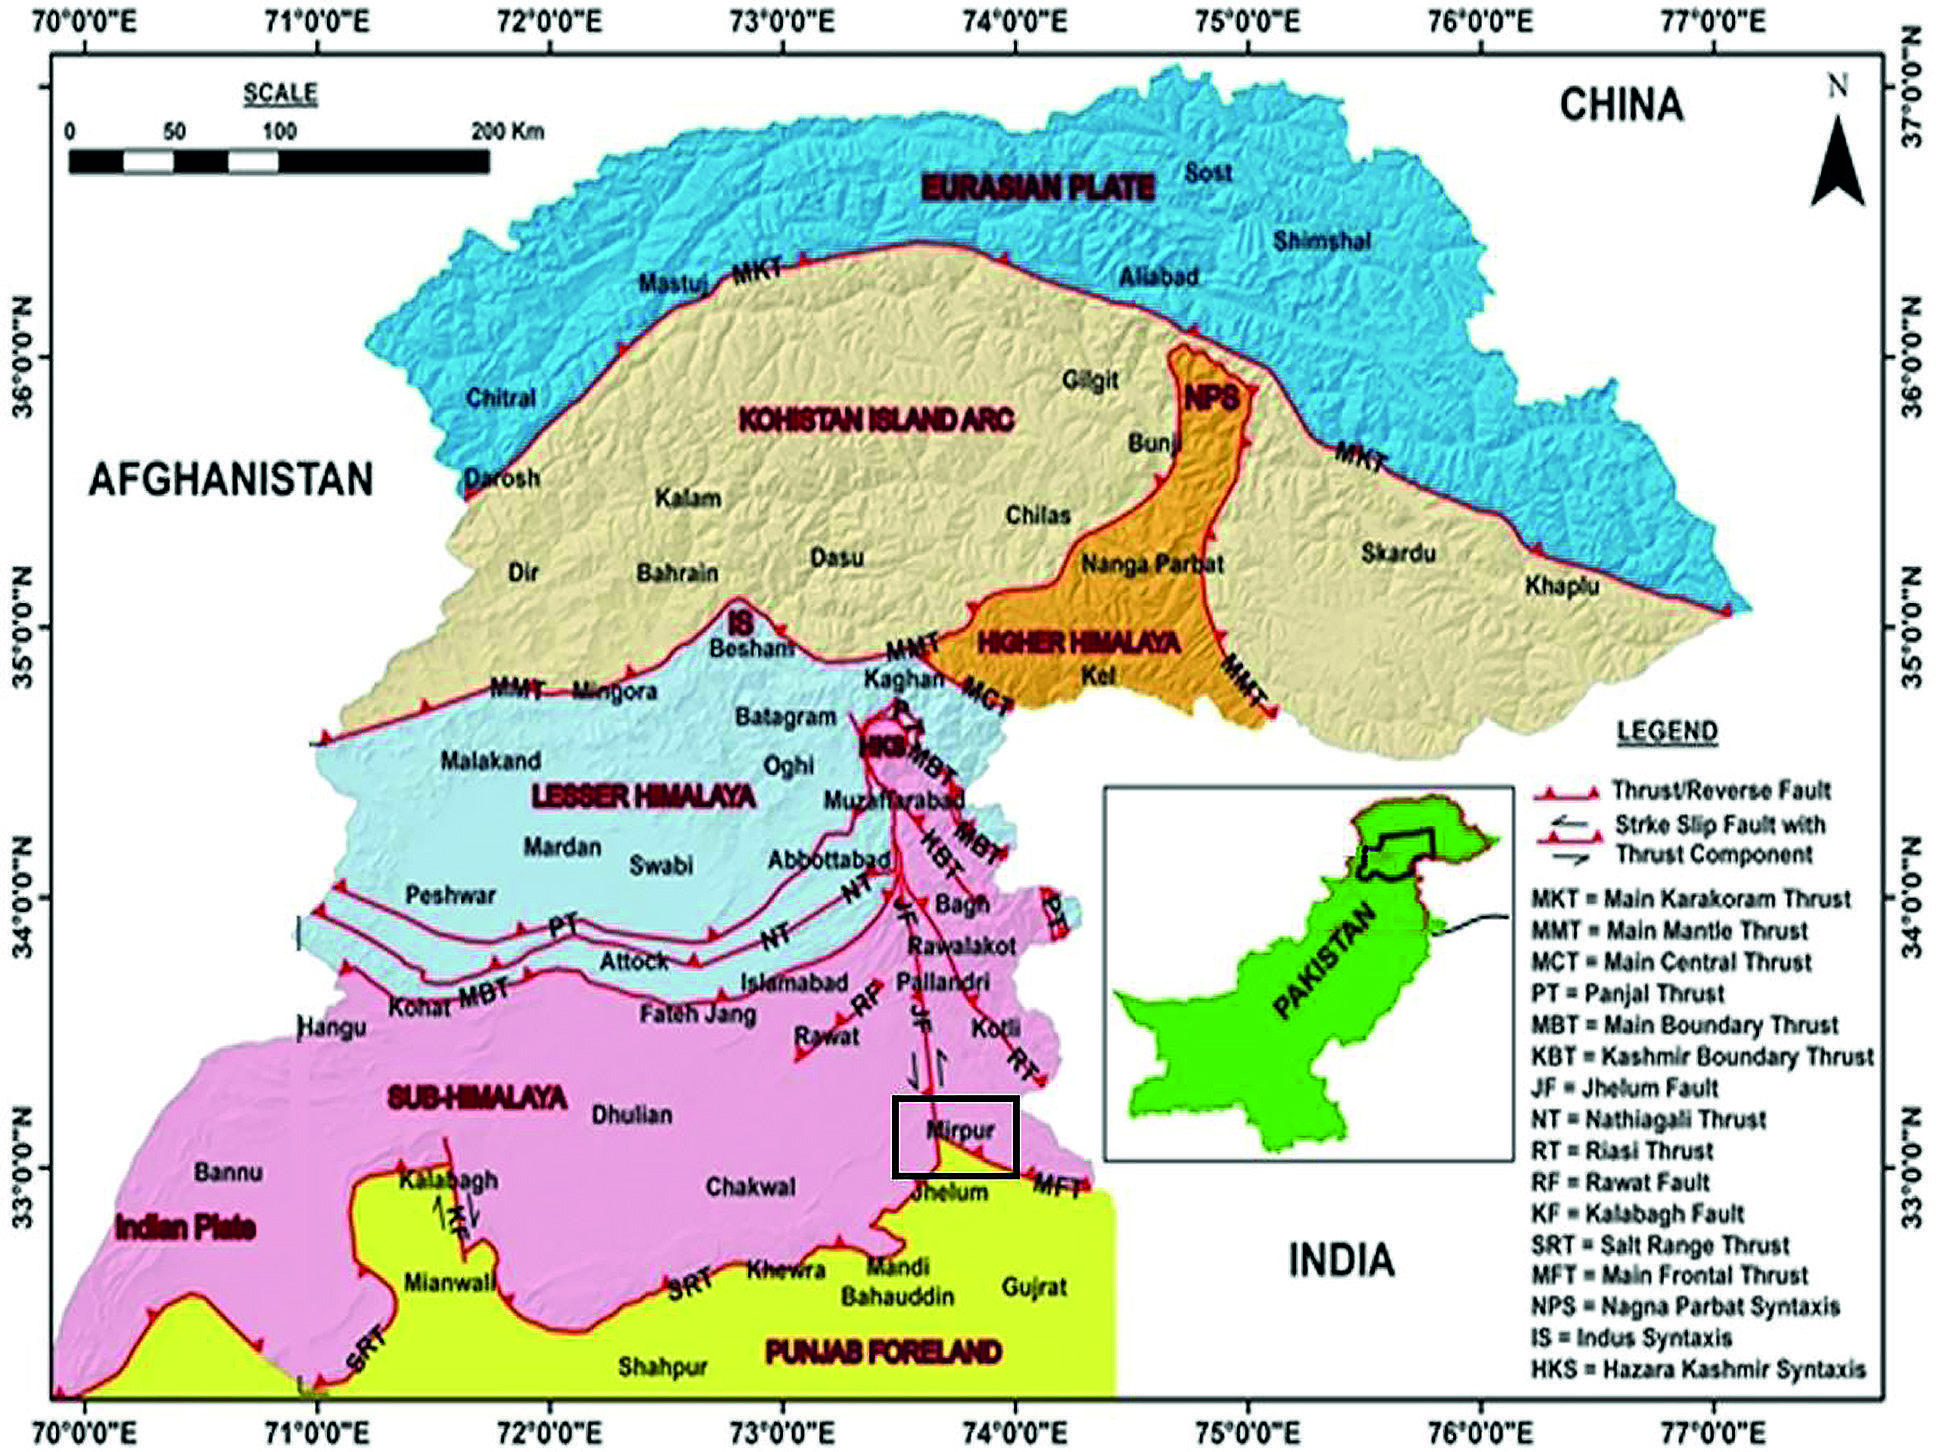
A comprehensive investigation of the aquifers is necessary to assess the impact of earthquakes on water quality in a given region. A series of earthquakes with varying magnitudes occurred along the thrust fault system in the Main Frontal Thrust (MFT) and Jhelum fault (Figure 1). The vicinity of Mirpur city and the surrounding areas experienced a significant earthquake in September 2019, measuring 5.9 on the Richter scale. The aftermath of the Mirpur earthquakes significantly deteriorated groundwater quality in the region resulting in a severe scarcity of potable water for the local population. Residents reported a noticeable decline in water quality, prompting a comprehensive survey to assess the extent of the issue. The ERT has proven to be a valuable tool for assessing subsurface conditions associated with such events (Khan et al., 2022; Park et al., 2022; Nisar et al., 2024b). A study conducted in the epicentral region of the Mw 5.8 Mirpur
earthquake on 24 September 2019 utilized ERT to investigate the geoelectrical characteristics of liquefied zones. Such studies underscore the necessity of integrating geophysical techniques with geological observations to enhance earthquake risk analysis in regions susceptible to liquefaction-induced damage. Coseismic liquefaction poses a significant hazard in earthquake-prone regions as demonstrated by the Mw 5.8 Mirpur earthquake. A study integrating horizontal-to-vertical spectral ratio (HVSR) and ERT revealed rupture-induced variations in site response and liquefaction features including sand plugs and fractures. HVSR patterns near damaged structures indicated site-specific vulnerability highlighting its effectiveness as a cost-effective tool for liquefaction assessment. The findings emphasize the importance of integrating geophysical methods for improved seismic hazard analysis particularly in resource-limited regions (Khan et al., 2021b).
The study area comprises a range of unconsolidated to consolidated rock formations including clay, silt, sand, gravel, and conglomerate that found alongside lithified rocks of the Siwalik group (Shah, 1997). The resistivity values of materials are influenced by factors such as temperature, conductivity, porosity, salinity, saturation, clay quality, and lithology. The clay is greater than 70 percent in surficial deposits. True resistivity values were assigned to various inferred subsurface sedimentary layers (Middleton et al., 1973; Orellana and Mooney, 1966). Among various techniques for acquiring resistivity data ERT is a more recent method with widespread applications in hydrogeology and shallow geophysics. Compared to the VES technique, which provides only one-dimensional resistivity variations at discrete points ERT offers two-dimensional coverage enabling a more continuous and detailed representation of subsurface resistivity. This makes ERT a more effective technique for identifying complex geological and hydrogeological structures (Leopold et al., 2013). Evolving since the 1970s with advancements in multi-electrode arrays, acquisition systems, and algorithms, it used to detect water-bearing channels in Quaternary deposits and provides information on aquifer thickness, depth, and subsurface bed morphology based on ERT profiles and borehole data (Orellana and Mooney, 1966). ERT requires multiple electrodes and numerous measurements, necessitating high-speed, automated systems for detailed subsurface investigation. Measurements are taken at various locations and depths along a profile to create a comprehensive 2D resistivity image of the subsurface. The goal is to obtain enough resistivity data points to construct a reliable subsurface image using the tomographic approach.
Electrical resistivity techniques are widely used for delineating aquifer systems (Nisar et al., 2023; Nisar et al., 2024b). Previous studies employed the electrical resistivity methods to evaluate aquifer potential and delineated shallow subsurface in the Mirpur area. These results were combined with chemical analysis to interpret aquifer contamination (Srinivasa, 2004; Niaz et al., 2013; Khan et al., 2021a). 3D ERT was used to detect leakage in a reservoir during dam operation (Niaz et al., 2017). Other studies applied the ERT to understand groundwater flow and contaminant migration in various geological settings (Niaz et al., 2015). While ERT provides detailed two-dimensional subsurface resistivity distribution VES remains valuable due to its ability to probe deeper layers with fewer electrodes and provide vertical resistivity variations at specific locations. The complementary use of both techniques enhances subsurface characterization by leveraging the depth penetration of VES and the lateral resolution of ERT. This integrated approach is particularly useful for groundwater exploration and structural mapping (Olateju et al., 2014). Sedimentation significantly impacts reservoir capacity with turbidity levels varying seasonally due to siltation. A study on Panchet Dam using the Normalized Difference Turbidity Index (NDTI) found a strong correlation (R² = 0.900) between turbidity and suspended sediment concentration (Bid and Siddique, 2019). The findings highlight the effectiveness of remote sensing techniques in monitoring and assessing water quality in reservoirs. This enables us to gain a detailed understanding of the lithological influence on the aquifers, particularly in response to seismic activities. Many researchers have carried out extensive studies regarding the collection and analysis of groundwater samples influenced by natural earthquakes (Khan et al., 2021a; Khan et al., 2021b). In this paper, we focus on water quality analysis, VES and ERT datasets collected along Mirpur region with the main objectives of (i) investigating the presence and depth of aquifers by interpretive processing VES dataset and ERTs, (ii) assessing the impact of the 2019 earthquake on soil stability and groundwater conditions focusing on possible liquefaction zones, (iii) determining the physicochemical properties of groundwater, particularly turbidity levels, to assess its suitability for drinking and other uses, and (iv) correlating electric resistivity results with groundwater quality data to understand the composition and distribution of subsurface materials.
2. Study Area
The study area is situated in the Kashmir basin near Khari Sharif approximately 8 km south of district Mirpur, Azad Kashmir (Figure 2) and extended from latitude 33.03762 N to 33.09249 N and longitude 73.73972 E to 73.79766 E. Khari Sharif is located between the Mirpur Hills and the sub-Himalayan region. It is known for its agricultural activities and is part of district Mirpur in Azad Jammu and Kashmir (AJK). The study area is characterized by diverse topographic features including
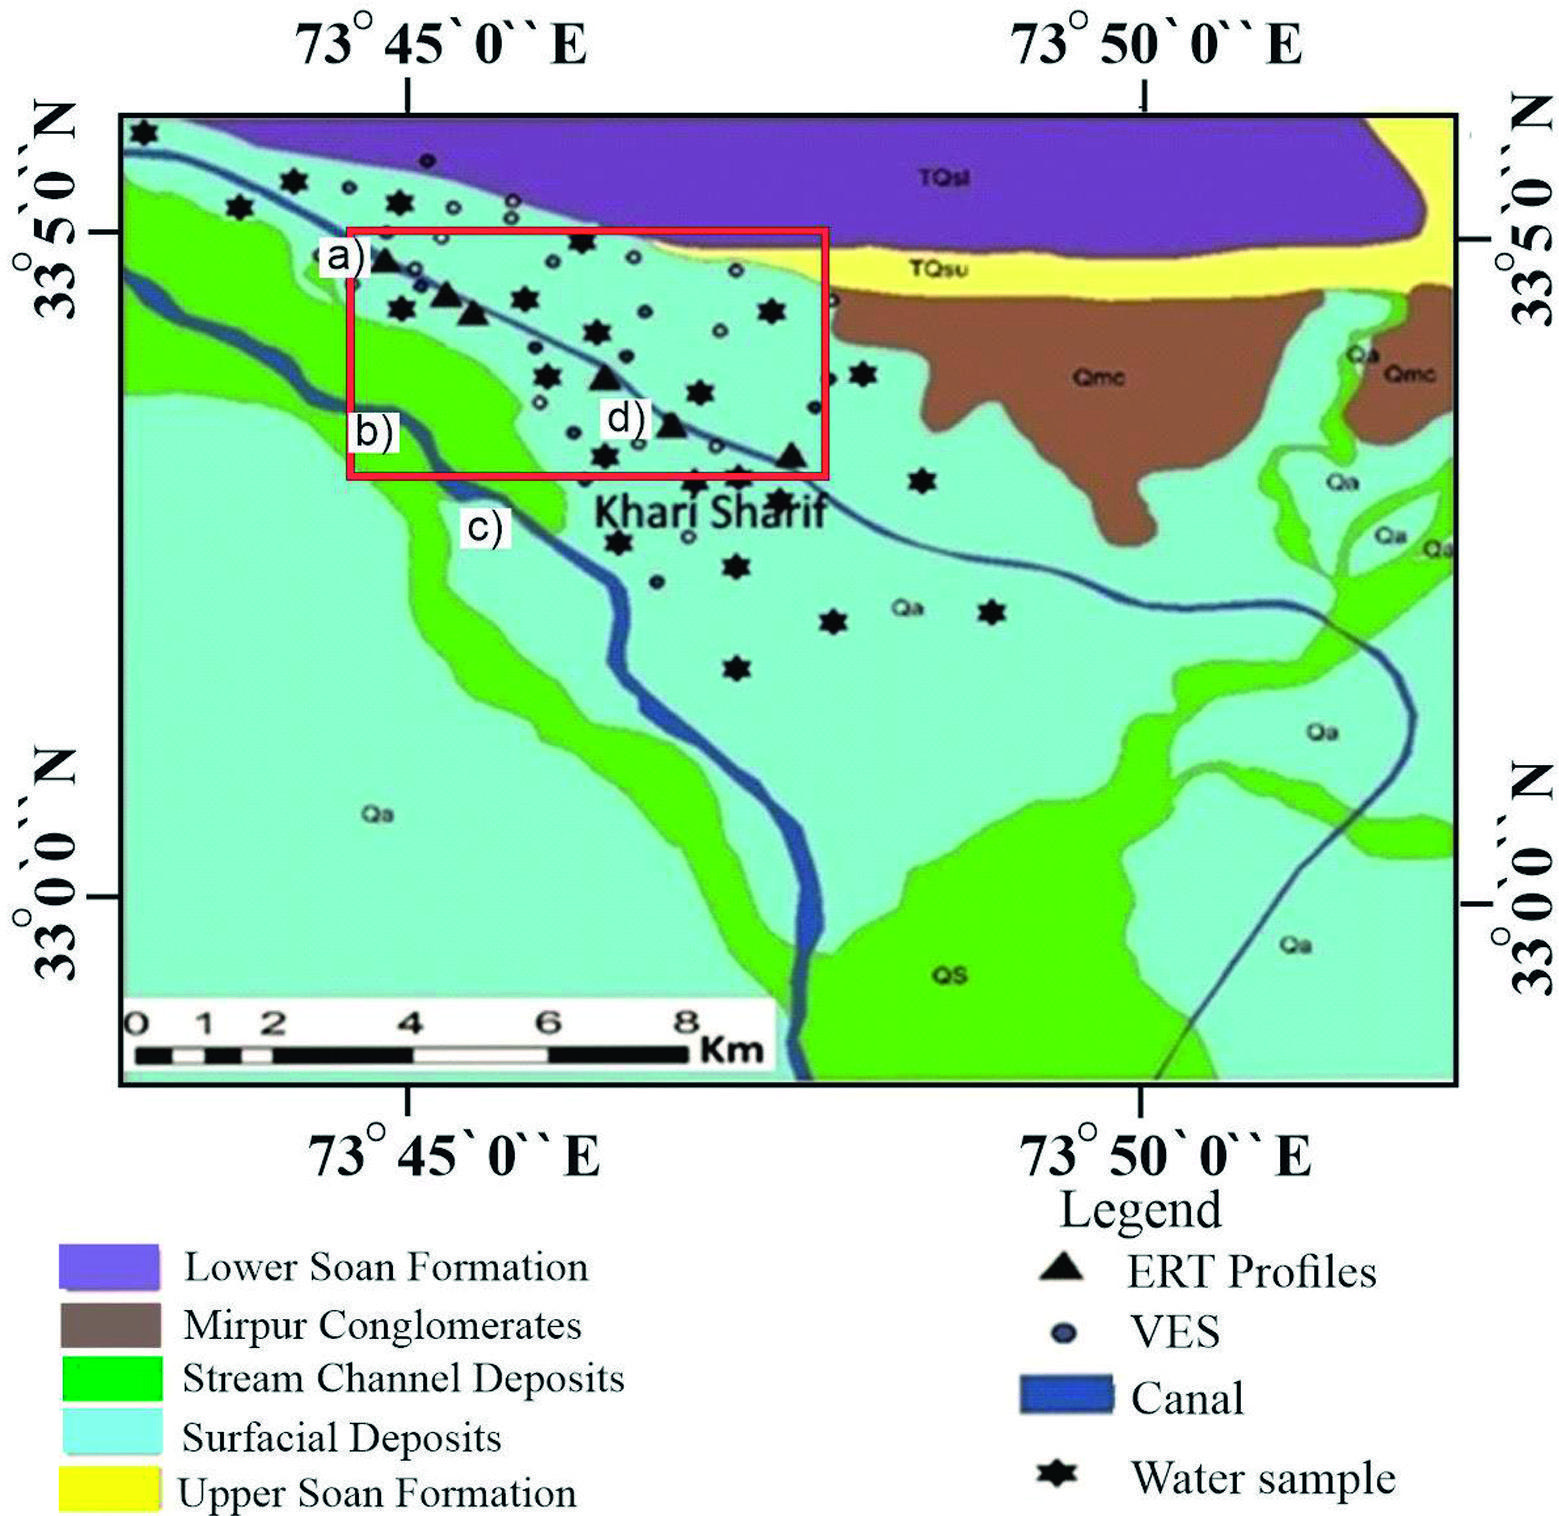
Figure 2 Surface geological map of the study area showing surface observation sites (a-d), VES, ERT and water samples locations.
plain terraces as well as low to high mountains. Geographically, it is in proximity to the western boundary of the Hazara Kashmir Syntaxis (HKS). The HKS region is formed due to compressional folding resulting from the tectonic collision of the Indian shield in the north extending across the entire width of the Himalayas for a considerable distance of over 200 km (Thakur et al., 2010). The region under consideration receives annual precipitation of up to 1300 millimeters (mm), and its hydrological resources are supplemented by the Mangla reservoir strategically designed to facilitate the generation of 1300 megawatts (MW) of hydroelectric power. Moreover, the area features the two prominent canals which primarily serve as conduits for irrigation purposes (Figure 2). The local population has also established a network of shallow water wells along these canals to meet their water needs. This integrated water management system underscores the region's commitment to harnessing both natural and man-made resources to support its energy and agricultural requirements.
The upper part of molasse deposits is known as the Siwalik Group. Medlicott (1882) suggested the name "Siwalik Group" while describing a fossiliferous deposit in the Siwalik Hills in the sub-Himalayas (Kravtchenko, 1964). Based on faunal occurrences, the Siwalik Group was divided into three zones: lower, middle, and upper Siwalik. The Siwalik group was divided into six Formations by the Pakistani Stratigraphic Committee, listed below in Table 1 (Mulder and Alexander, 2001; Kravtchenko, 1964).
Table 1 Stratigraphy of the study area (modified after Kravtchenko, 1964).
| Formation | Geological age | Brief overview |
|---|---|---|
| Quaternary Alluvium | Recent | Deposits of sand, clay, silt, and gravel that are unconsolidated |
| Unconformity | ||
| Mirpur Formation | Pleistocene | Pebbles and cobbles of igneous, sedimentary, and metamorphic rocks in poorly sorted conglomerates |
| Unconformity | ||
| Upper Soan Formation | Pliocene | Reddish, brownish clays with layers of conglomerates and poorly unconsolidated sandstone |
| Lower Soan Formation | Pliocene | Brown, yellowish grey clays and clay stone, grey sandstone |
| Dhok Pathan Formation | Late Miocene | Greyish, fine to medium grained, medium to thick bedded sandstone with clay and siltstone, sandstone accounting for 60% of the total, and clays accounting for 40% |
| Chinji Formation | Late to Middle Miocene | 75% Clays and 25% Sandstone |
3. Material and Methods
Geoelectrical methods are employed to delineate the subsurface resistivity of various formations. These apparent resistivity values provide insights into various subsurface parameters, including lithology, fractures, faults, pore content, cavities, and contamination (Daud et al., 2022; Lenkey et al., 2005). A total of thirty-two geoelectrical sites were acquired using a Terrameter ABEM SAS4000 instrument equipped with a multi-channel adapter. VES data acquisition was performed using the Schlumberger electrode configuration. The collected data consists of AB/2 values and apparent resistivity measurements. The maximum electrode spacing varied between 300 m and 440 m at different locations.
The geometric factor (K), essential for calculating true resistivity values, was automatically determined by the system. It was computed based on the given AB/2 and MN/2 spacing for each reading, and the corresponding apparent resistivity values were recorded in a notebook. ERT data was acquired using the Schlumberger configuration with a profile length of 400m. The electrode spacing was set at 5m, and depth coverage ranged from 60m to 87m. The Schlumberger configuration was used with Schlumberger-Short and Schlumberger-Long setup protocols, employing 64 electrodes. The Schlumberger short setup activated 41-electrodes of the first two cables and recorded near-surface variations in the subsurface. The Schlumberger-Long setup, with a 10-electrode spacing on four cables, recorded deeper variations in resistivity. The VES and ERT datasets are processed to obtain true resistivity values and depths of the subsurface layers, with processing conducted using IPI2WIN and RES2DINV, respectively.
The least squares inversion technique in ERT data inversion is used that has ability to address non-uniqueness, incorporate regularization constraints for stability, and handle uncertainties in the data, ultimately leading to improved accuracy and reliability in subsurface imaging and characterization (Moyano et al., 2012). Chromatography and spectrophotometric methods were utilized to determine the concentrations of certain key ions in the water sample ensuring accurate and precise analysis of the physicochemical properties (Tables 3 and 4). The samples were filtered acidified to a pH of around 2 and stored in 250 mL bottles to prevent the precipitation of certain ions and to allow for proper analysis. A total of twenty-four water samples (S1 to S24) were collected from shallow water wells and tube wells (Figure 2). Five of these water samples were selected near the ERT data points for comparative analysis. The water samples each about 250 ml were stored at 4°C for the laboratory analysis. The physicochemical parameters analyzed include carbonates, bicarbonates, chloride (Cl-), pH, turbidity, total dissolved solids (TDS), electrical conductivity (EC), total hardness (TH), calcium (Ca2+), Potassium (K+), sodium (Na+), sulphate (SO42-) and nitrate (NO3-1) ion concentrations.
4. Results
Table 3 Hydrochemical analysis of the water samples collected from different shallow boreholes.
| Sample No | EC (µS/cm) | PH | Turbidity (NTU) | Alkalinity (mg/L) | Bicarbonate (mg/L) | Calcium (mg/L) | Chloride (mg/L) | Magnesium (mg/L) | Potassium (mg/L) | Sodium (mg/L) | Sulphate (mg/L) | Nitrate (mg/L) | TDS (ppm) |
|---|---|---|---|---|---|---|---|---|---|---|---|---|---|
| 1 | 687 | 7.36 | 30 | 262 | 262 | 57 | 28 | 39 | 3.9 | 24 | 64 | 0.24 | 378 |
| 2 | 1013 | 7.25 | 3.56 | 482 | 482 | 49 | 36 | 19 | 2.8 | 170 | 33 | 0.05 | 608 |
| 3 | 411 | 7.3 | 16 | 202 | 202 | 45 | 10 | 27 | 0.8 | 4 | 22 | 0.09 | 142 |
| 4 | 304 | 7.6 | 7.73 | 122 | 122 | 41 | 12 | 12 | 0.6 | 7 | 25 | 0.67 | 167 |
| 5 | 459 | 7.4 | 3.77 | 202 | 202 | 45 | 14 | 22 | 2.6 | 23 | 25 | 0.09 | 252 |
| 6 | 588 | 7.22 | 10.76 | 272 | 272 | 65 | 10 | 19 | 1.1 | 38 | 32 | 0.03 | 323 |
| 7 | 546 | 7.27 | 2.56 | 232 | 232 | 65 | 12 | 10 | 2.4 | 31 | 25 | 0.36 | 300 |
| 8 | 623 | 7.42 | 13.25 | 262 | 262 | 73 | 24 | 5 | 2.7 | 52 | 16 | 0.51 | 343 |
| 9 | 566 | 7.45 | 7.15 | 222 | 222 | 61 | 14 | 5 | 4.7 | 49 | 35 | 0.25 | 311 |
| 10 | 546 | 7.37 | 18.09 | 182 | 182 | 65 | 20 | 15 | 3.4 | 21 | 37 | 5.33 | 300 |
| 11 | 566 | 7.27 | 9.89 | 242 | 242 | 81 | 12 | 15 | 1.2 | 10 | 20 | 0.98 | 311 |
| 12 | 280 | 7.43 | 3.63 | 102 | 102 | 45 | 12 | 7 | 1.2 | 7 | 20 | 0.98 | 154 |
| 13 | 839 | 7.39 | 19.5 | 352 | 352 | 105 | 26 | 39 | 2.2 | 20 | 59 | 0.44 | 461 |
| 14 | 656 | 7.34 | 19.39 | 232 | 232 | 61 | 12 | 19 | 2.7 | 21 | 31 | 0.22 | 361 |
| 15 | 564 | 7.91 | BDL | 232 | 232 | 89 | 12 | 12 | 1.5 | 7 | 27 | 0.17 | 310 |
| 16 | 413 | 7.42 | BDL | 162 | 162 | 49 | 12 | 12 | 2.8 | 15 | 29 | 0.49 | 227 |
| 17 | 724 | 7.33 | 14.55 | 302 | 302 | 73 | 16 | 29 | 2.7 | 32 | 59 | 1.69 | 398 |
| 18 | 621 | 7.06 | 10.57 | 202 | 202 | 101 | 16 | 5 | 3.3 | 16 | 8 | 0.63 | 342 |
| 19 | 619 | 7.18 | BDL | 252 | 252 | 89 | 12 | 15 | 3.2 | 10 | 26 | 3.09 | 340 |
| 20 | 600 | 7.35 | 3.85 | 222 | 222 | 61 | 12 | 19 | 8.8 | 29 | 68 | 0.18 | 330 |
| 21 | 256 | 7.6 | 2.79 | 82 | 82 | 41 | 12 | 2 | 1.3 | 6 | 27 | 0.35 | 141 |
| 22 | 648 | 7.28 | 17.29 | 282 | 282 | 65 | 16 | 36 | 2.3 | 7 | 24 | 0.12 | 356 |
| 23 | 413 | 7.44 | 24.55 | 172 | 172 | 41 | 12 | 19 | 2.4 | 10 | 24 | 0.11 | 227 |
| 24 | 905 | 7.34 | 2.75 | 222 | 222 | 101 | 60 | 32 | 3.6 | 29 | 128 | 4.42 | 498 |
| WHO Guidelines | 6.5-8.5 | 05 NTU | 100-200 | 100 | 250 | 150 | 200 | 200 | 200 | 50 | 500 |
Table 4 Time elapsed water quality data of Mirpur.
| Sample No | EC (µS/cm) | PH | Turbidity (NTU) | TDS (ppm) |
|---|---|---|---|---|
| 1 | 467 | 7.36 | 10.43 | 365 |
| 6 | 588 | 7.22 | 5.78 | 353 |
| 8 | 481 | 7.11 | 2.5 | 343 |
| 9 | 401 | 7.45 | 3.12 | 310 |
| 10 | 324 | 7.16 | 4.16 | 299 |
| 11 | 237 | 7.27 | 4.34 | 311 |
| 13 | 437 | 7.24 | 5.56 | 326 |
| 14 | 656 | 7.34 | 3.39 | 342 |
| 17 | 421 | 7.33 | 2.12 | 398 |
| 18 | 621 | 7.12 | 3.49 | 342 |
| 22 | 428 | 7.28 | 5.63 | 356 |
| 23 | 413 | 7.42 | 4.29 | 213 |
4.1. VES Measurements
In the study region, water-bearing production areas are categorized as high potential zones primarily found in the northwestern and southern parts. These areas exhibit a single closure and have aquifer thickness values ranging from 80m to 150m, indicating significant groundwater storage potential. Thirty-two VES data sites were utilized to establish the resistivity of different subsurface layers. VES data was employed to infer subsurface lithologies consisting of three to four subsurface layers. In a general sequence from top to bottom, the subsurface alluvium deposits are divided into a dominant clay layer, boulder clay, dry sandstone, gravel and sandstone, lateritic soil, and more (Appendix A).
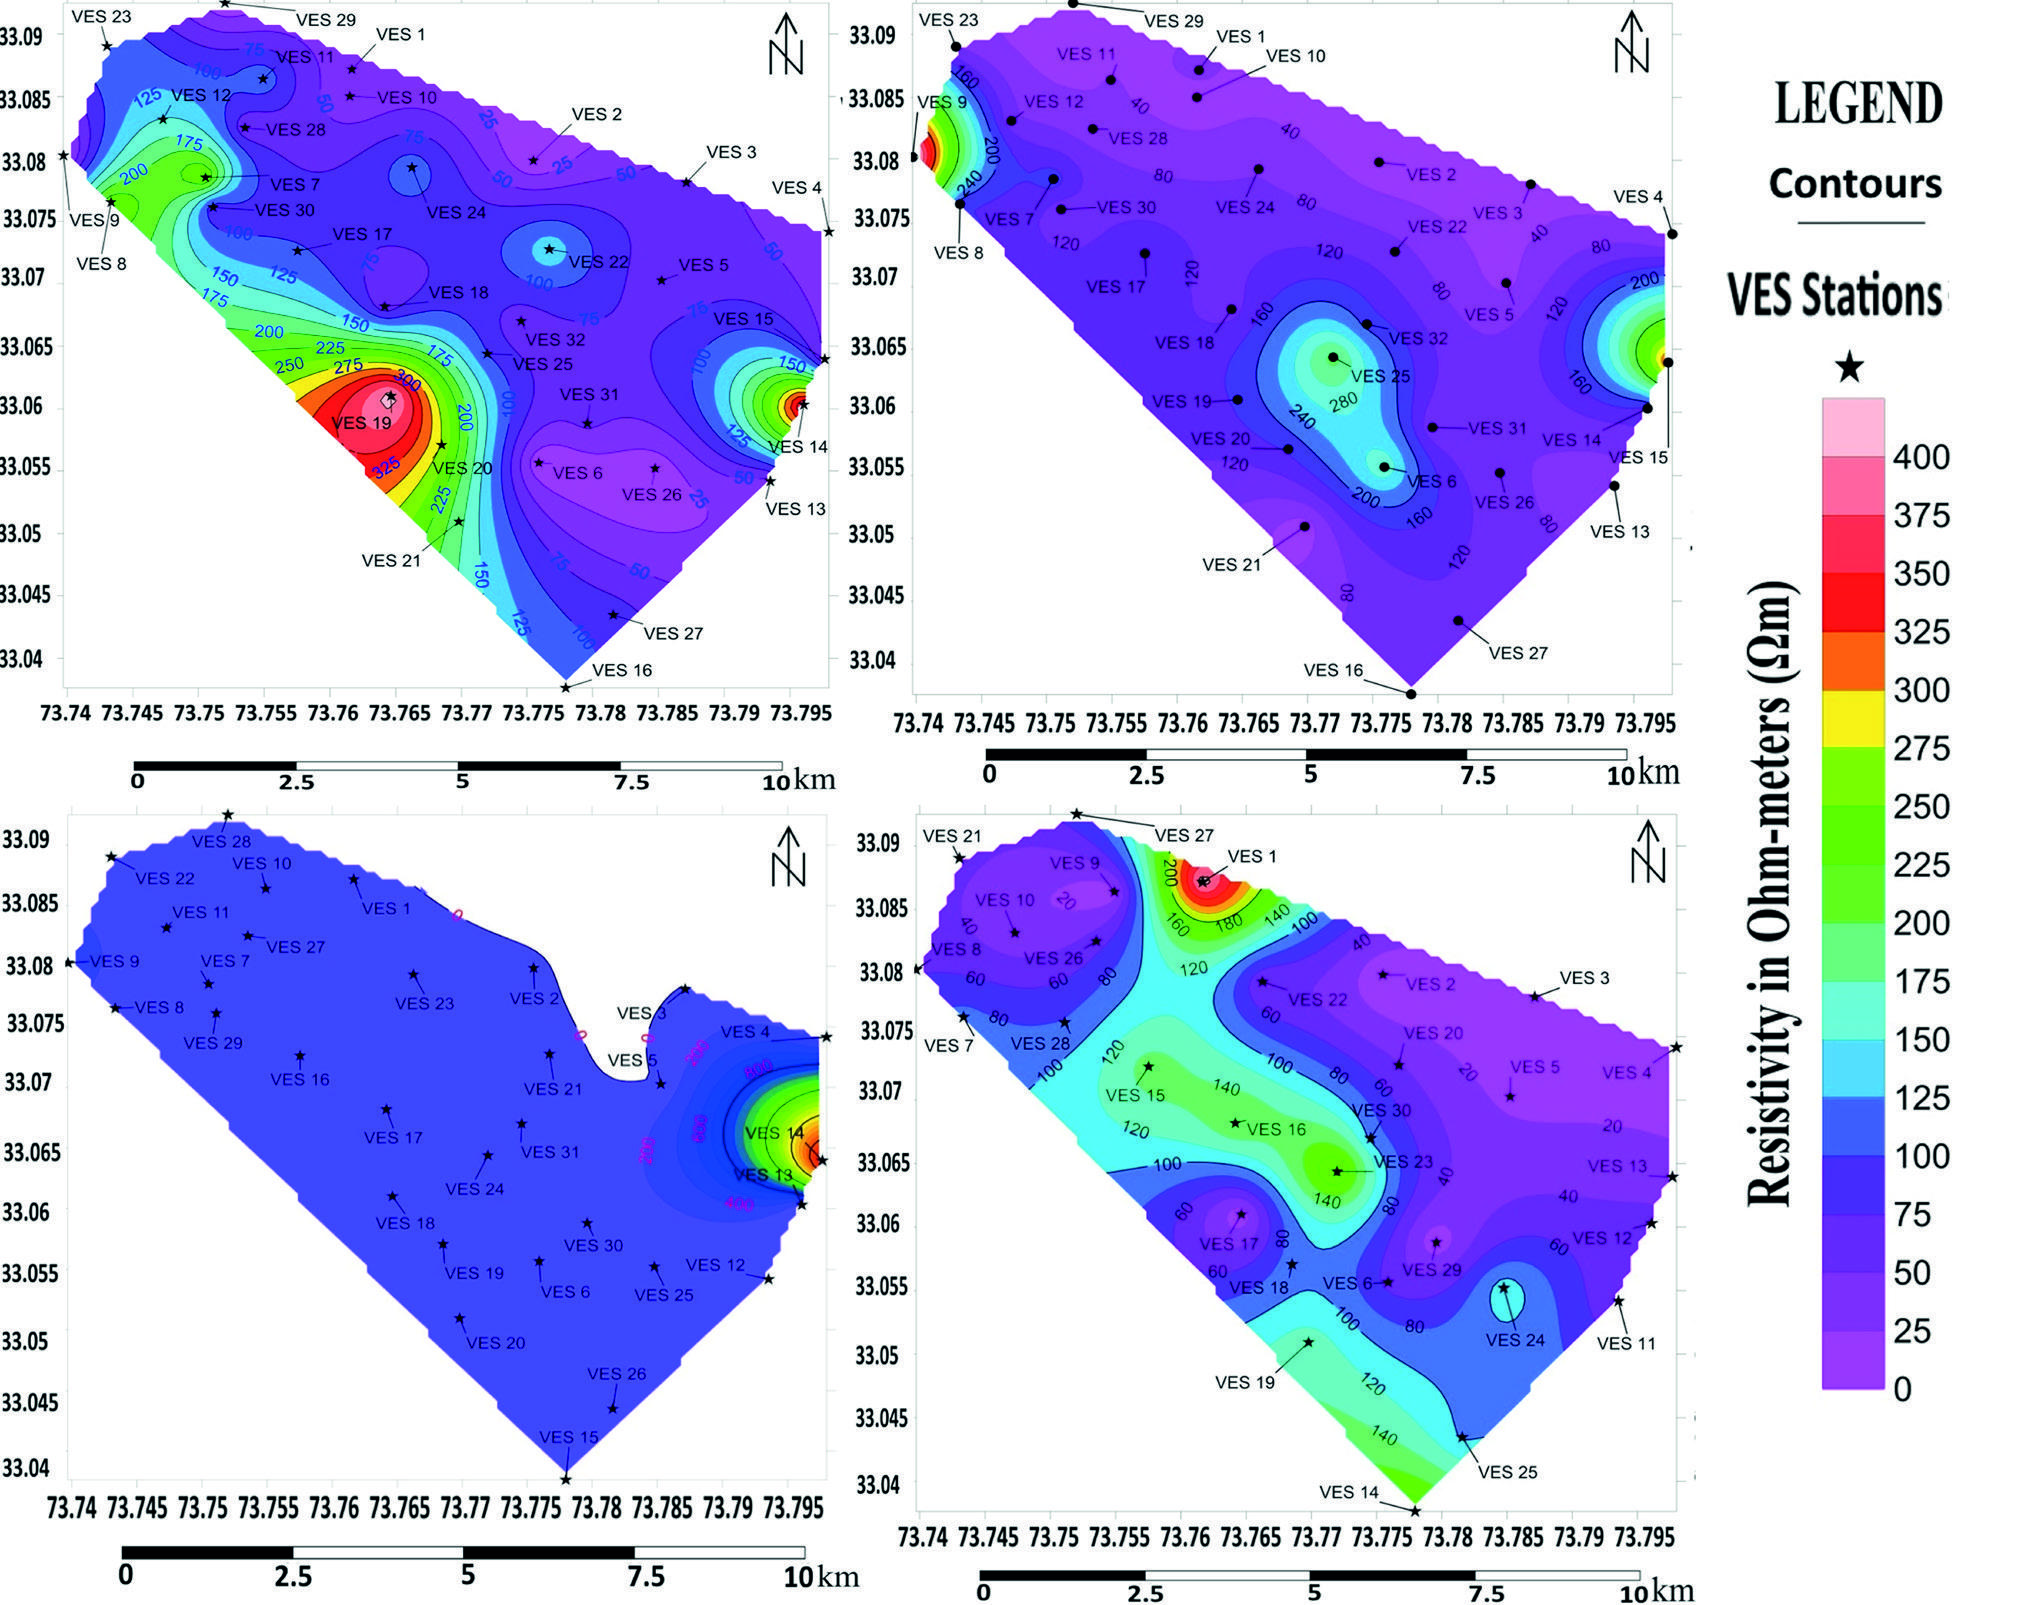
The water-bearing subsurface strata consist of sandy clay, sand, gravel, and boulders, characterized by high porosity and permeability (Lenkey et al., 2005; Oseji et al., 2005). However, clay is highly saturated in the close vicinity of the Jhelum Canal suggesting a local unconfined aquifer unit. VES were also utilized to generate iso-resistivity maps at 50m, 100m, 150m, and 200m depths (Figure 3a-3d). This horizontal slice of iso-resistivity suggested the distribution of subsurface lithology at a specific depth and water saturation level. A subsurface layer inferred from the resistivity values at this depth is an aquifer unit. An aquifer thickness map is generated for the sand with boulder layer present at about 100m depth based on the VES dataset (Figure 3b). Based on this iso-resistivity map the low resistivity values show the higher groundwater potential at a depth of 100m (Figure 3b). The resistivity values increase at a depth of 150m (Figure 3c) compared to Figure 3b, suggesting less potential for groundwater. In the map of 200 m the good potential of groundwater is also observed in north-east and north-west direction (Figure 3d). The iso-resistivity maps have indicated good potential for groundwater in the region.
4.2. ERT Profiles
Most tube wells and boreholes are situated along the UJC serving as a crucial water source for the local population. Understanding the subsurface characteristics is essential for assessing the potential impact of seismic events on water quality and supply in the area. ERT Profiles-1 to 6 were acquired in a north-south orientation near the upper Jhelum canal (Figure 4). Profiles-1 to 5 were collected on the western side of the canal in a significantly disrupted area, while Profile-6 was conducted along the eastern side. (Figure 2). These profiles are about 400 m in length and
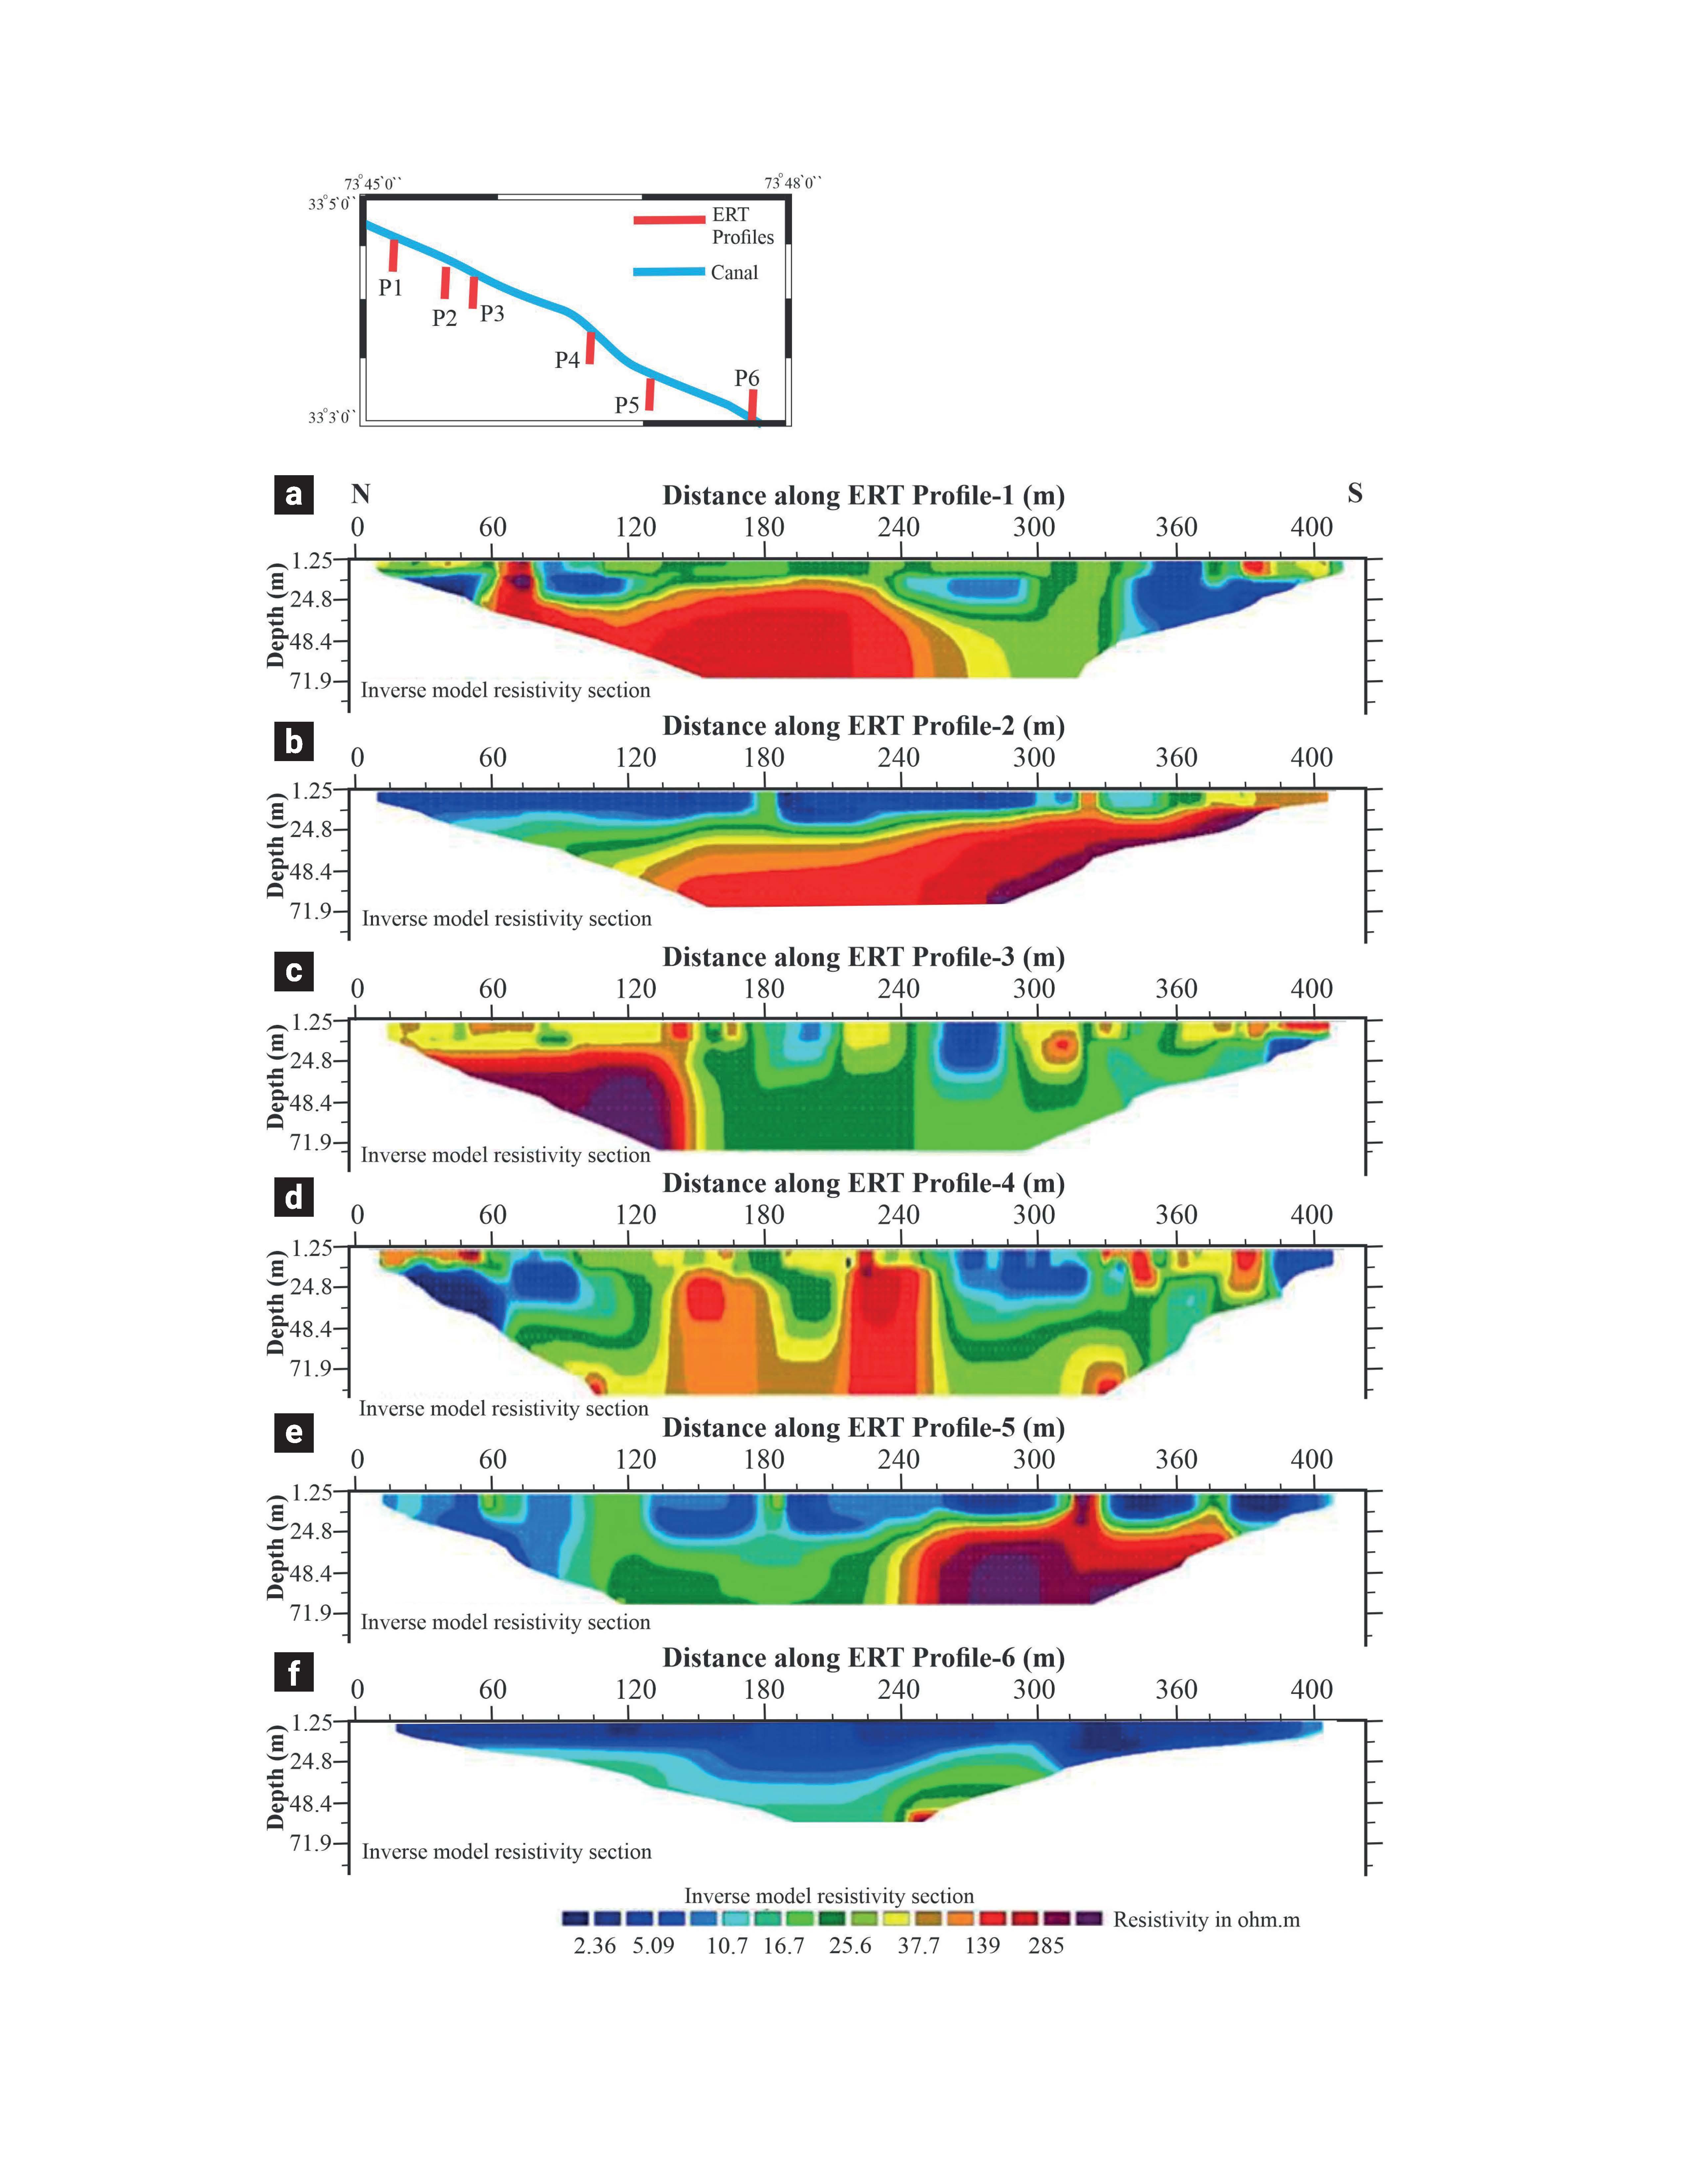
provide imaging to a depth of about 70 m. The ERT profiles were acquired at different distances from the canal to observe the liquefaction-induced subsurface disturbances, such as intrusions, sand blows, and fractures, and to delineate the liquefaction zone. We inferred the lithologies from resistivity of subsurface based on the work of previous studies (Khan et al., 2021a). Based on the resistivity values, three subsurface layers have been identified across the upper Jhelum Canal: (i) resistivity values below 10 Ωm is inferred as saturated clay; (ii) resistivity values ranging from 10 to 40 Ωm are interpreted as saturated sand with gravel and clay; and (iii) resistivity values above 50 Ωm are attributed as gravel with sand.
The ERT Profile-1 and 2 about 1 km apart were acquired across relatively less deformed region (Figures 4a and 4b). The ERT profile 1 is the northern most and provided subsurface image down to 65 m depth (Figure 4a). Surface observations along this profile indicate effects of liquefaction (Figures 4a and 5a). Along Profile-1 the low-resistivity zones (<10 Ωm) represent saturated clay, while saturated sand with gravel is inferred to be intermediate resistivity (<40 Ωm) layer. The most striking feature in the inverted section is a high-resistivity zone (>50 Ωm) located between distances 60 m to 280 m at about 20 m depths (Figure 4a). This layer interpreted to be gravel with sand, forming a dike, intruded into the upper layers between 60 m and 80 m along the profile. Another sand dike is evident at a distance between 300 to 345 m across the profile associated with the liquefaction process (Figure 4a). The low-resistivity anomalies (<10 Ωm) linked to the saturated zone appear discontinuous attributed to the presence of high resistivity zones. The inverted ERT Profile-2 reveals three distinct less disrupted layers (Figure 4b). The uppermost low resistivity (<10 Ωm) layer ranges in thickness from 10 to 20 m from south to north across the profile. The intermediate resistivity (<40 Ωm) layer ranges in thickness from 10 to 25 m represents saturated sand, while a high-resistivity zone (>50 Ωm) varies in thickness from 2 to 10 m from south to north. This zone is identified on the surface interrupting the layers above between distances 300 to 330 m along the profile (Figure 4b). Additionally, two intrusions attributed as sand dikes are identified between distances 170 and 190 m and 315 and 330 m along the profile.
The ERT Profiles-3 and 4 acquired in close proximity to one another traverse a heavily disturbed ground surface (Figures 2, 4c, and 4d). These profiles provide crucial insights into the distribution of water-bearing rock layers after tremors and highlight the relationship between subsurface deformation and surface disturbances. The previously identified geoelectric layers on Profiles-1 and 2 (Figures 4a and 4b) can also be observed in the inverted Profile-3 (Figure 4c); however, the continuity is highly disrupted, appearing in segments due to liquefaction induced process. The low resistivity (<10 Ωm) zone attributed as saturated clay is identified in three discrete segments between distances 190 to 210 m, 255 to 285 m and 380 and 400 m along the Pro file-3 (Figure 4c). Distinct ground fractures at 150 m and 255 m locations exhibit near-vertical continuity to a depth of about 70 m. From surface down to 20 m depth, the intermediate-resistivity layer (<40 Ωm) shows fracture-induced discontinuities but maintains continuity between 20 to 130 m distance along the profile. The high resistive (>50 Ωm) zone extends from 20 m depths down to 70 m (Figure 4c). The inverted ERT Profile 4 reveals significant subsurface deformation characterized by the upward intrusion of high resistivity (>50 Ωm) basal layer into overlying low resistivity (<10 Ωm) and intermediate-resistivity (<40 Ωm) strata (Figure 4d). The dikes occurring between 130-180 m and 210-250 m along the profile at about 20 m depth are confined to subsurface depths.
Inverted ERT Profile-5 reveals a low-resistivity layer (<10 Ωm) disrupted by: (i) primary ground fractures at about 90 m and 130 m, and (ii) sand dikes between 170-190 m and 310-330 m along the profile (Figure 4e). The intermediate resistivity (<40 Ωm) layer attributed to be saturated sand is evident on surface between m distance along the profile. This geoelectric layer is only present between 90 to 240 m distances. The high resistive (>50 Ωm) subsurface layer interpreted to be gravel with sand outcrops as dike between 310 to 330 m distances (Figure 4e). The ERT Profile-6 exhibits only two distinct geoelectric layers attributed to its location adjacent to the eastern canal bank where surface deformation is minimal (Figures 2 and 4f). The uppermost low resistivity (<10 Ωm) layer interpreted to be highly saturated clay ranges in thickness from 20 to 30 m from north to south across the profile while the intermediate resistivity (<40 Ωm) layer about 35 m thick represents saturated sand (Figure 4f). The profile shows no evidence of surface or subsurface deformation features.
4.3. Physico-Chemical Characterization of Water Samples
The Physico-chemical analysis of water samples was conducted to assess the impact of sediment redistribution following seismic events and to evaluate overall water quality. Standard laboratory procedures were followed to ensure data reliability. Turbidity, pH, electrical conductivity (EC), alkalinity, major cations (Ca2+, Mg2+, Na+, K+), anions (Cl-, SO42-, NO3-1, HCO3-), and total dissolved solids (TDS) were analyzed using well-established analytical techniques. A calibrated multiparameter probe was used for in situ measurements of pH, EC, and turbidity, while ion chromatography and spectrophotometric methods were employed for ion concentration analysis (Table 3 and 4). Quality control measures included duplicate sampling, calibration with certified
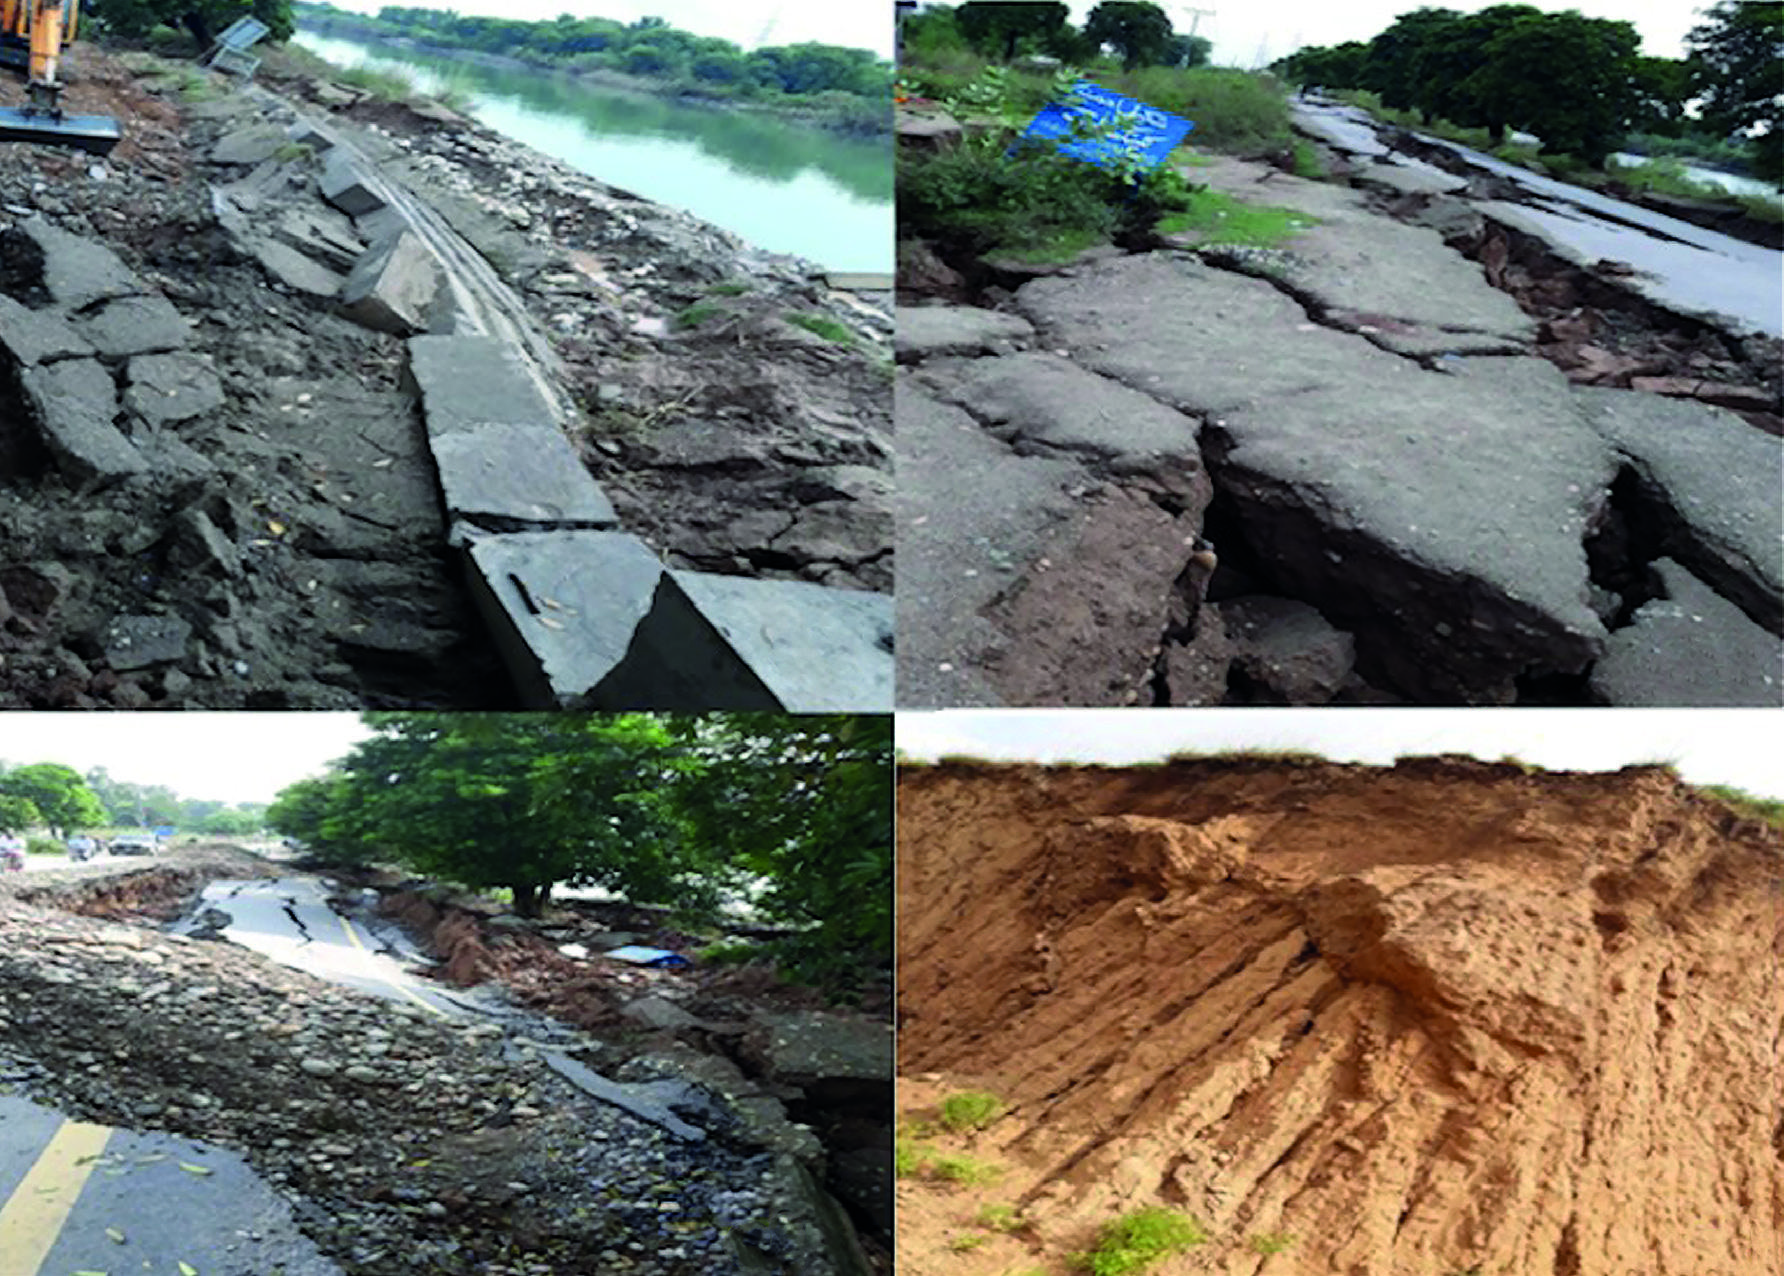
Figure 5 a, b, c showing liquefaction effect and subsidence in saturated clay along the UJC due to earthquake shaking at different locations, and d) an exposed clay deposit in the area.
standards, and cross-validation with previous hydrochemical studies in the region.
5. Discussion
Integration of VES dataset and ERTs with hydrochemical analysis provided an effective approach for understanding the subsurface conditions and evaluating the impact of the series of earthquakes in 2019, on groundwater resources in Mirpur. The study utilized VES to map the vertical distribution of subsurface materials and identified multiple aquifers beginning at a depth of 50m (Figure 3). These findings were further supported by the ERT that provided a detailed lateral and vertical imaging of the shallow subsurface layers confirming the presence of a saturated clay layer (Figure 4). This suggests that the aquifer system is influenced by low-permeability materials that can affect groundwater recharge and flow dynamics. Clayey aquifers tend to have lower transmissivity that can potentially lead to confined or semi-confined conditions in deeper aquifers. The water quality analysis (Table 3) revealed high turbidity levels indicating the presence of suspended particles within the groundwater. Such high turbidity can be attributed to post-seismic disturbances that caused sediment resuspension in the shallow aquifer system. High turbidity in groundwater raises concerns regarding its suitability for drinking purposes and highlights the need for proper filtration and treatment before consumption.
5.1. Resistivity Data
The ERT profiles suggest that the shallow aquifers in this area are composed of sandy clay which has led to liquefaction and subsidence during past seismic events such as earthquakes (Figure 4). Delineating the three resistivity zones provides valuable insights into subsurface composition and potential geohazard in the surveyed region. The geoelectrical datasets reveal that gaining a deep understanding of the dominant clay layer as the top cover, the recharging and seepage mechanisms of the Jhelum Canal, and the susceptibility of saturated clay to liquefaction effects during earthquakes, is crucial for assessing potential geohazards and water quality concerns in the study area (Figures 4 and 5). The thickness of clay sediments increases from the north to the south (Figure 4). The prevailing clay layer acts as a top cover over the aquifer units present below characterized by low permeability. The Jhelum Canal plays a significant role in recharging the subsurface aquifer layers in the region. The clay deposits are highly water-saturated and susceptible to liquefaction effects during earthquake tremors. This liquefaction process leads to an increased presence of suspended sediment and elevated turbidity in the groundwater. The water table in the region is shallow indicating susceptibility to disturbances caused by earthquake tremors (Figures 5a, 5b, 5c and 5d). In the ERT survey subsurface bodies extending beyond the profile boundaries were measured to ensure a comprehensive understanding of the geological framework and potential groundwater pathways. The resistivity contrasts observed at the profile edges indicate the presence of larger geological structures that may influence hydrogeological conditions. While some anomalies are at the profile limits their partial imaging still provides valuable insights into subsurface heterogeneity.
The water quality in the area is being affected by seismic activities. In the study region, water-bearing production areas are categorized as high-potential zones, primarily located in the northwestern and southern portions (Figure 3). These areas display a single closure and have aquifer thickness values ranging from 80m to 150m indicating significant groundwater storage potential. The Vertical Electrical Sounding (VES) data reveal the presence of a deep aquifer at about 100m depth. The liquefaction process associated with seismic activity has led to increased turbidity in potable water sources. To reduce turbidity, we recommend drilling deep boreholes a suggestion supported by our interpretation of the iso-resistivity map (Figure 3). Specifically, the iso-resistivity map at 100m depth reveals low resistivity values that suggest higher groundwater potential (Figure 3b). This indicates that drilling at this depth would likely yield water with lower turbidity. At a depth of 150m, the iso-resistivity contours show low resistivity values indicating high conductivity related to groundwater presence (Figure 3c). However, at 200m, the resistivity values increase (Figure 3d), suggesting a reduced potential for groundwater extraction. Thus, our recommendation to drill deep boreholes is based on the iso-resistivity map at 100m, where we observe the most favorable conditions for accessing groundwater with lower turbidity. The iso-resistivity maps overall indicate a good potential for groundwater in the region.
The water sampling was carried out well after the monsoon season, where the rain/monsoon influence on turbidity is negligible. The results are also justified by a month later water sample acquisition where the turbidity values are significantly reduced (Tables 3 and 4). The ERT profiles especially Profiles-3, 4, 5 that depicted greater influence of subsurface deformation also induced uncertainty in measurements as the lateral continuity between the subsurface lithology was disturbed. The demarcation of disrupted lithologies was confined by local borehole measurements and previous literature (Khan et al., 2021a). The increase in profile length ensured the maximum depth of penetration.
5.2. Hydrochemical Analysis
The study area has experienced earthquakes in recent years and sediment redistribution is a major contributing factor to the high turbulence observed in most samples (Table 3). The prevalence of clay-dominated conditions has led to elevated turbidity values especially after seismic tremors. Although the sulfate levels are relatively close to the permissible limits in the study area (Table 3). Sodium, potassium, nitrate, and calcium concentrations fall within permissible limits. This suggests that the source of recharge flows through non-carbonate rock formations, which are deficient in these elements indicating the absence of limestone in the area. The levels of carbonate and bicarbonate in the groundwater samples are low signifying good water quality for drinking and irrigation purposes. Hardness and magnesium values exhibit a similar trend with magnesium influencing water hardness. The low levels of hardness and magnesium in the samples are attributed to the absence of magnesium-rich sources in the study area. However, in S2 and S17 due to the proximity of a sewerage line and the shallowness of the tube well the values of the electric conductivity and alkalinity are high (Table 3). In the remaining study areas the concentrations are within permissible limits. Adequate levels of calcium and magnesium contribute positively to health, while the chloride concentrations below the World Health Organization (WHO) limit of 250 mg/L ensure a palatable taste. The sodium content within the recommended maximum of 200 mg/L is particularly reassuring for individuals with specific health concerns. Furthermore, iron concentrations below the WHO limit of 0.3 mg/L prevent aesthetic issues such as discoloration. The pH, falling within the WHO range of 6.5 to 8.5, indicates a neutral to slightly alkaline water, ensuring not only safety but also a pleasant drinking experience. These results underscore the quality and safety of the water source, meeting international standards for potable water. The chemical and physical parameters of the water samples indicate that the water quality in the region is generally good. However, earthquake tremors and sediment redistribution lead to increase turbulence in most samples (Table 3).
S1 was acquired in the vicinity of the UJC (Figure 2). This sample was collected from a shallow aquifer system that comprises of mixture of clay and sand. The physicochemical results depict high EC (687 µS/cm) and turbidity (30 NTU) indicating increased dissolved ions and suspended particles, likely due to soil leaching post-earthquake. Higher turbidity values indicate high suspended particles resulting from earthquake tremors in the shallow saturated clay unit. Furthermore, high EC values attribute to the ion dissolution that is linked to liquefied layer in the vicinity of the UJC. S2 was acquired at a distance from the UJC (Figure 2). The sample shows an abnormally high electrical conductivity (1013 µS/cm) and alkalinity (482 mg/L). The proximity of the sewerage system to S2 is likely the reason for the observed increase in the alkalinity and electric conductivity. Contaminants from the sewerage system, such as bicarbonates and other alkaline substances, can seep into the groundwater, leading to a rise in alkalinity levels. This connection underscores the influence of nearby infrastructure on the water chemistry in the aquifer. S3 exhibits elevated EC (411 µS/cm) and turbidity (16 NTU) suggesting the mobilization of fine sediments and increased mineral dissolution preferably in the upper part of deeper aquifer layer as higher EC indicates mineral dissolution that is specifically associated with compacted layer which lies below the shallow aquifer (intermixed clays). The high turbidity values often give an indication about the hydraulic connection between overlying sand clay layer and deep aquifer.
S6, acquired at some distance from the UJC has very high EC (588 µS/cm) and turbidity (10.76 NTU), further reinforcing the possibility of increased mineral content and sediment disturbance in the upper part of deeper aquifer. The comparatively high values of EC and low values of turbidity as compared to S3 indicate less disturbance and more compaction. A notable rise in turbidity is observed in S8 (13.25 NTU), S10 (18.09 NTU), and S11 (9.89 NTU) suggesting significant mobilization of particulate matter possibly due to soil layers. The thick intermixed soil layers (shallow aquifer) after shaking produced higher suspended sediments due to its uncompact nature. The distribution of these samples also supports turbidity variations as these samples are spread at variable distances from the UJC. This distance has resulted in less intense shaking and mineral dissolution from the UJC than samples that were acquired in the proximity of canal. S13 exhibits exceptionally high EC (839 µS/cm) and turbidity (19.5 NTU), implying extensive leaching of dissolved solids and suspended particles into the water column possibly due to development of hydraulic connection between base of upper layer and top of aquifer layer in the upper part of the deeper aquifer. The higher EC values are associated with ions introduced by compacted lithology in deeper aquifer system and higher turbidity is related to introduction of finer sediments possibly by the overlying mixture of sand and clay into the system. Similarly, Sample 14 presents high EC (656 µS/cm) and turbidity (19.39 NTU), likely a result of ion rich groundwater mixing with disturbed sediments.
S17 has elevated turbidity (14.55 NTU) indicating the presence of fine suspended solids potentially from increased shaking in shallow aquifer. S18 shows both high EC (621 µS/cm) and turbidity (10.57 NTU) suggesting further evidence of earthquake-induced mineral leaching and sediment disruption associated with boundary between two aquifer systems. S23 that was acquired on the left bank of UJC indicated high turbidity values (24.55 NTU) attributed to liquefaction in intermixed clays and sands of shallow aquifer.
The temporal data pertaining to elapsed time was procured during the month of November 2023 with the primary objective of corroborating the elevated levels of turbidity and electrical conductivity (EC) associated with specific sample identifiers (S1, S6, S8, S9, S10, S11, S13, S14, S17, S18, S22, and S23). A meticulous examination revealed a noteworthy reduction in both turbidity and EC values within the seismic timeframe of the geographical region under scrutiny (Table 4). Notably, it was discerned that the escalated turbidity levels along with heightened electrical conductivity exhibited a discernible decrease during the aforementioned seismic period. This discernment leads to the inference that the antecedent higher turbidity values in the area can be attributed to historical seismic activities. The results detailed in Tables 3 and 4 confirm that high turbidity and EC levels in certain samples are linked to seismic activity and sediment disturbance. The decrease in turbidity and electrical conductivity (Table 4) post-seismic period suggests that seismic events may have initially disturbed the sediment leading to higher turbidity and EC levels (Table 3). Once the disturbance subsided the levels returned to more typical values confirming the connection between seismic activity, sediment disturbance, and changes in water quality as shown in Tables 3 and 4. This temporal pattern strengthens the validity of the interpretations regarding the influence of seismic events on turbidity and EC.
5.3. Integration between geophysical and hydrochemical analysis under tectonic conditions
The resistivity data sets coupled with hydrochemical analysis indicated strong influence of the UJC in nearby aquifer system especially during/after the earthquake. The resistivity datasets revealed two prominent aquifer systems (Figures 3 and 4). The shallow aquifer system with the influence of intermixed clays was severely affected due to earthquake tremors as clays tend to get mixed with water in pores (Figure 4). This mixture has resulted in a low resistivity value often indicated by ERT Profiles-1, 2, and 6. The hydrochemical datasets (S8, S10, S14, and S23) acquired in proximity of the ERT Profiles-3, 4 and 5 revealed high conductivity and turbidity values in the vicinity of the UJC. The ERT Profiles-3 and 4 indicate severe disturbance in lithological column due to earthquake (Figure 4c, d, and e). This disturbance has resulted in water sample values that indicated both high EC and high turbidity.
The identified deep aquifer system that mostly resided in the sandstone beds indicated relatively low resistivity values (Figure 3b) referred to as undisturbed fresh water that remained confined during the tremors. This suggest the cemented nature of sandstone beds at depths. The hydrochemical samples (S1, S2, S3, S4, S5, S6, S7, S12, S20, S21, and S24) collected from the deep aquifer indicated relatively low turbidity and overall water quality within the permissible limit. The correlation of the acquired data sets was found in close coordination with each other which also enhanced the reliability of the analysis. The findings from this study emphasize the need for continuous monitoring of groundwater quality particularly in earthquake-affected areas, where changes in hydrogeological conditions can occur. Furthermore, appropriate remediation measures, such as sediment filtration, well rehabilitation, or alternative deep water sources should be considered to ensure a sustainable and safe water supply for the region.
6. Conclusions
In summary, the study area experienced seismic events in 2019 and sediment redistribution that has led to substantial subsurface alterations and affected local water quality. The combined results from the ERT and VES surveys revealed the presence of layered aquifer systems composed of sandy clay, sand, and gravel, with a fresh groundwater reservoir at a depth of around 100m. A 20m thick clay layer with low resistivity was identified that played a key role in liquefaction and ground subsidence during the earthquake. The hydrochemical analysis from samples collected from shallow water wells showed increased turbidity and EC immediately after the tremors, indicating contamination likely due to disturbed sediments. However, follow-up observations revealed a reduction in both turbidity and EC levels suggestion that the water quality improved as the sediment settled and the aquifer system returned to stability. The deeper sandy aquifers unaffected by immediate surface disturbances remain a viable and clean source of water for drinking and domestic purposes.
7. Author’s Contribution
Formal analysis, validation, original draft preparation Conceptualization, M.R. and supervision A.N.; methodology, validation, S.A.E.; software, U.B.N.; validation, R.F.;

