


 nueva página del texto (beta)
 Inglés (pdf)
 Artículo en XML
 Referencias del artículo
 Enviar artículo por email
 Citado por SciELO
  Similares en
SciELO
Similares en
SciELO 
 Permalink
Introduction
Land use and land cover (LULC) changes are factors that alter the hydrological processes in river basins, with adverse effects on flow regime and water balance. Studies carried out in different regions of the world have shown that forested areas to pastures or urban areas conversion decreases evapotranspiration, increases runoff, reduces infiltration and groundwater recharge (Anand et al., 2018; Gabiri et al., 2019; Jodar-Abellan et al., 2019; Natkhin et al., 2015; Zhang et al., 2020). These changes can result in biodiversity losses, in addition to threatening socioeconomic development (Andrade et al., 2019; FAO, 2011; Joly et al., 2019; Marques et al., 2019). Since half-billion people around the world face severe water scarcity throughout the whole year (Hoekstra, 2016), predicted flow rate has been a key driver to appropriate management measures. In this context, it is essential to project future scenarios to identify possible LULC and their consequences in flow regimes.
This is not a trivial task and requires sophisticated techniques application that take into account the LULC dynamic and the hydrological processes complexity. The integration of LULC prospection and hydrological simulation models closely related to Geographic Information Systems (GIS) are indicated for this function. This integration allows the definition of LULC scenarios considering a pattern of changes and the simulation of current and future interferences in the water resources flow in response to these changes (Anand et al., 2018; Van Cauwenbergh et al., 2018).
The Land Change Modeler (LCM) is a tool for land planning (Eastman and Toledano, 2018). In LCM, the LULC is modelled empirically as a function of a set of explanatory spatial variables (whether constraints or incentives) and an observed rate of change between two distinct periods (Kafy et al., 2020; Mas et al., 2014). To assess LULC hydrological impacts, process-based hydrological models, such as the Soil and Water Assessment Tool (SWAT) are being applied in different scales hydrographic basins, in countries with varied climatic and topographic conditions and with limited data quantity and quality (Bieger et al., 2013; Jodar-Abellan et al., 2019; Joorabian Shooshtari et al., 2017; Krysanova and White, 2015; Marhaento et al., 2018; Natkhin et al., 2015; Piniewski et al., 2019; Saha et al., 2019; Zhang et al., 2020, 2018).
By considering the hydrographic basin characteristics (such as soil type, topographic data, climate information and land use maps), the model is able to adequately represent water availability (Krysanova and White, 2015). This capacity together with the possibility of inserting land use maps allows SWAT to be used to project the impact of changes in LULC on the flow of a water body. However, this multi-model approach through the joint use of LCM and SWAT is developing and there are few studies reporting this interaction.
On the other hand, the results obtained so far reveal the great potential of this application. Joorabian Shooshtari et al. (2017) elaborated a prospective LULC map for 2050 using LCM and identified the changes in interferences observed in runoff using SWAT. Authors found that the projected change for land use is relatively small, so the impact on discharges is also modest (annual increase of 3%), but not negligible. Abbasi et al. (2021) in a similar study, applied the LCM to the 2032 LULC projection and determined the impacts on green water safety using SWAT. The results obtained by the authors showed an increase in pastures and urban area while forests and agricultural area reduced. These changes, associated with the most critical climate change scenario, resulted in a reduction of about 9% in green water flow and 44% in green water storage for the study region.
In tropical regions, such as Brazil, hydrological processes differ from other regions due to higher energy inputs and rates of change (Wohl et al., 2012). The consequences of these changes and the knowledge of the main hydrological interactions is limited (Wohl et al., 2012), which makes it difficult to adopt effective measures to guarantee water availability in the future. Brazil’s economy is heavily dependent on water resources. The country stands out in agricultural production and has almost 7 million hectares of irrigated area with an expected increase of 3 million hectares by 2030 (ANA, 2017). Additionally, about 90% of Brazilian energy is supplied by hydroelectric plants (Pinheiro et al., 2019).
Thus, the main motivation of this work is to advance in research regarding the joint use of the LCM and SWAT models to project water availability, contributing, together with society and the scientific community, in increasing the database related to the application of these two models. For this assessment, the ARG sub-basin located in South-eastern Brazil was chosen, a region that has an intense water resources use and that recently faced one of the biggest water crises in its history. In addition, mass movements providing significant changes in the landscape affected the region.
Materials and methods
1. Study area
The study area comprises the ARG sub-basin (Figure 1), located in the western portion of Nova Friburgo county, in the mountain region of Rio de Janeiro state, Brazil. ARG sub-basin has an area of 236 km², which corresponds to 25% of Nova Friburgo county total area, with Rio Grande as its main watercourse. It is composed of forest remnants (62%), pastures and agricultural areas, which represents 36% of the total area. There are no urban areas in the basin and the Nova Friburgo municipality is about 12 km away (MapBiomas, 2018). ARG sub-basin has mainly Cambisol soils, which is usually associated with undulating mountain relief areas (Zaroni and Santos, 2018).
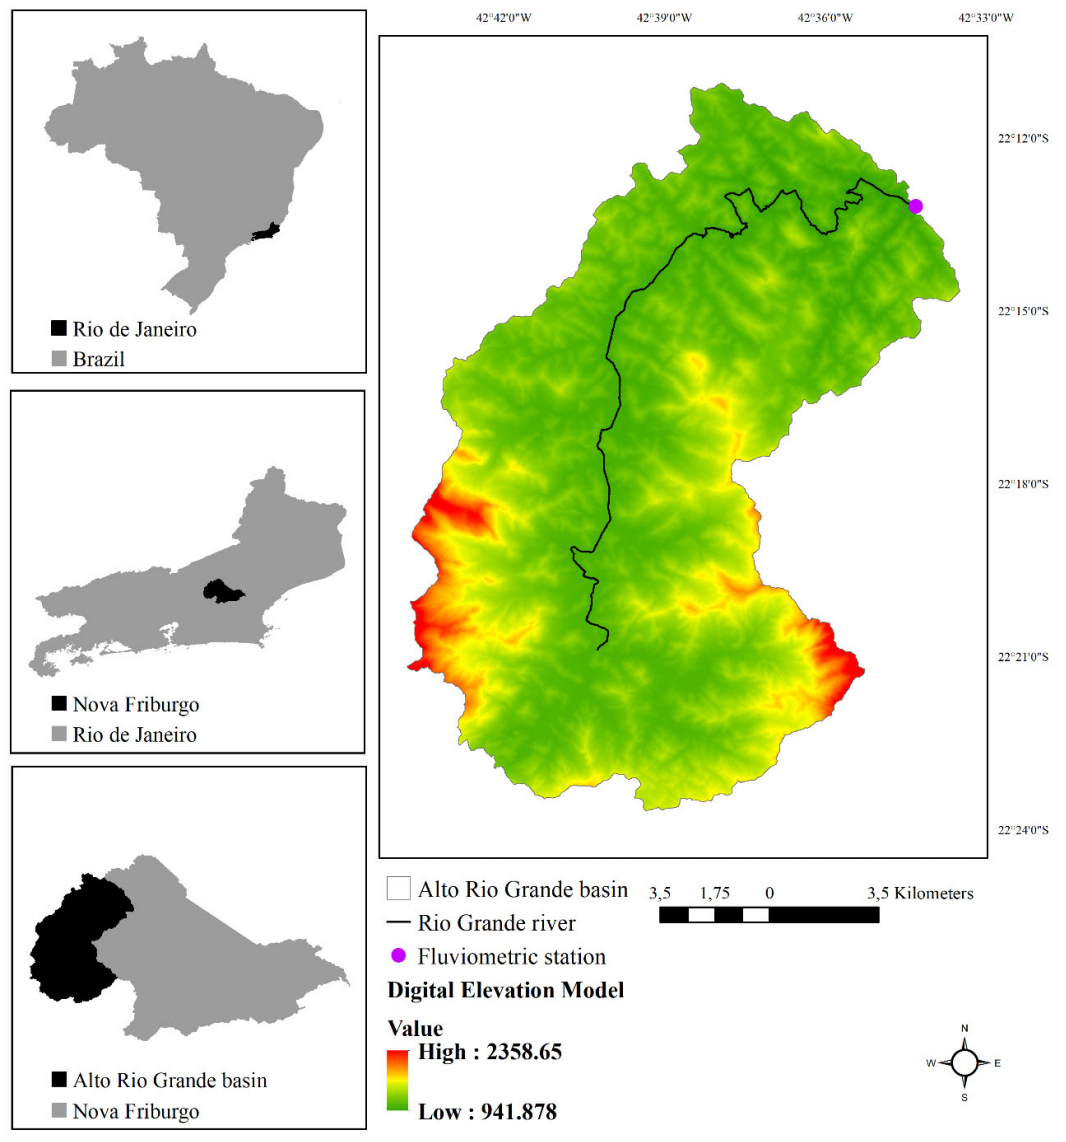
The municipality, inserted in the Atlantic Forest biome, rated as Montane Ombrophilous Dense Forest. This region presents rugged topography and high slopes, reaching 2,300 m. According to the Köppen classification, the climate is tropical altitude (Cwb). The average annual minimum and maximum temperatures are respectively 14.5°C and 25.10°C and annual rainfall average is around 2,000 mm, with November to March being the rainiest period and April to October the driest months (Baptista, 2009; INMET, 2021). This study site was chosen because the region has been affected by critical water scarcity events resulting from prolonged droughts and inadequate water resource management (Britto et al., 2018).
ARG sub-basin is responsible for meeting the demand in the metropolitan region of Rio de Janeiro, with agricultural crops such as vegetables. Those cultures demand frequent irrigation (through abstractions in Rio Grande River), which places the municipality in a prominent position in relation to the total irrigated area, being the fourth largest in the State. Rio Grande River’s source is still used for animal consumption, sand extraction, distilled beverages manufacture and aquaculture (AGEVAP, 2014, 2013; IBGE, 2017; INEA, 2020). Since the Rio Grande River is also used for public water supply estimated at 185 thousands of inhabitants (IBGE, 2017), population growth expectations and agricultural and industrial expansion call attention to water availability, with the risk of a considerable reduction, not only due to the increase in water demand, but also due to LULC.
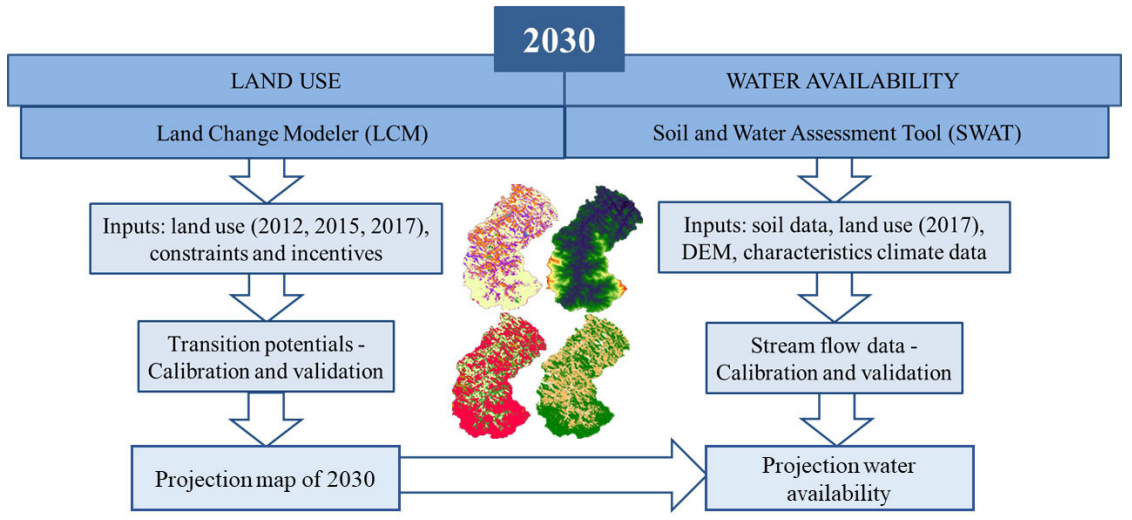
This work aimed to determine water availability in the ARG sub-basin for the year 2030 in response to LULC. To achieve these objectives, the LCM tool was applied to identify possible LULC in 2030. The image for 2030 obtained was inserted in the SWAT model to obtain flow regime in Rio Grande (Figure 2). At this stage, it was considered that the lowest rainfall observed in the ARG sub-basin will occur again, simulating a critical scenario in terms of water availability. For this analysis, LULC in 2030 used for all years in the future. Year 2030 was adopted because the national and regional agencies, responsible for water resources management, use this range for some demand projections (ANA, 2017; INEA, 2014), therefore, determining water availability for 2030 consists, among others, in an opportunity to assist decision makers.
2. Land Change Modeler (LCM)
LCM is an Idrisi Selva software (currently TerrSet) tool developed by Clark Labs of Clark University and consists of a spatially explicit dynamic model, based on an inductive pattern. The LCM is a LULC projection tool that uses historical land cover change to model the relationship between land cover transitions and explanatory variables to map future scenarios (Eastman and Toledano, 2018). This process of LULC modelling is organized into major stages that include: change analysis; transition predictions; validate and future projection.
Change analysis: LCM models LULC considering a rate of change observed between two different periods and a set of explanatory variables. In this study, the rate of change was defined using land cover maps for the years 2012 and 2015. These years were selected because on January 11 and 12, 2011, an anomalous precipitation (253 mm in 37 h) triggered mass movements in the region where Nova Friburgo is located. These mass movements caused significant changes in the landscape, great social and economic damage that gave a new dynamic of LULC in the region which must be known and projected for proper management.
The ARG sub-basin LULC map used as input data into the LCM were obtained from the Annual Land Cover and Land Use Mapping Project of Brazil (MapBiomas). Produced by a pixel-by-pixel classification of Landsat satellite images. The LULC classes were adapted to “Forest” which includes planted and native forests, being the second most present land cover; “Pasture”; “Waterproofed areas” which include rural dwellings and rocky outcrops; and the “Mosaic of agriculture and pasture”. The last category results from the difficulty in differentiating between certain agricultural crops and the grasses that compose the pastures, allowing possible spatial inconsistencies in the classifications (MapBiomas, 2018).
After inserting the LULC images in the LCM, on the Change Analysis tab it is possible to identify the changes that occurred between the evaluated years (2012 and 2015), such as the gains and losses for each LULC class.
Transition potential: at this stage, the model is structured and the areas with the greatest potential for transition are identified. For this, the variables that can act as LULC drivers are selected and tested according to their explanatory power and include incentives and constraints. In this study, roads and highways digital maps were used, since the distances from them are factors that may favour or limit the expansion of a given land use category. Federal and state conservation units’ maps were included in the modelling as constraints, especially the agriculture and pasture expansion. Table 1 presents the data used in the models and their source, which were pre-processed using the ArcGis™ 10.5 software from ESRI®.
Table 1 Digital maps used in LCM
| Variables | Data source | Scale |
|---|---|---|
| Land use | MapBiomas Project, 3rd collection (http://mapbiomas.org) | spatial resolution: 30m |
| Topography | Brazilian Institute of Geography and Statistics - IBGE (https://downloads.ibge.gov.br/downloads_geociencias.htm) | 1:25000 |
| Hydrography | National Water Agency - ANA (http://metadados.ana.gov.br/geonetwork/srv/pt/main.home) | 1:25000 |
| Roads and highways | Department of Roads and Roadways of the State of Rio de Janeiro (http://www.der.rj.gov.br/mapas_n/index.htm) | 1:450000 |
| Conservation units | State Institute of Environment (http://www.inea.rj.gov.br/cs/groups/public/@inter_dibap/documents/document/zwew/mtiz/~edisp/inea0123058.pdf) | 1:1100000 |
Other variables used in LCM were predictors and consisted of elevation, slope and distance to Rio Grande River, distance to conservation areas, distance to mosaic of agriculture and pasture and distance to roads. These variables were adopted because, in a previous analysis (Cramer V), they were the most relevant and reached a minimum accuracy of 75% when tested in the multilayer perceptron (MLP), an artificial neural network model as can be seen in section 3.2. Cramer V determines the association between two variables with a value of 0 representing no association (complete independence) and a value of 1 representing complete association (dependence) (Boylan et al., 2018).
Validation and future projection: the 2012 and 2015 maps were used for model calibration. After calibration, the 2017 forecast was made and the map obtained was compared with the real 2017 map to validate the model. Markov Chain analysis is used to generate prediction maps for the year specified. The Markovian process is a method in which a predicted system can be estimated by finding its previous state and the probability of conversion from one state to another (Nelson et al., 2010).
The test accuracy or overall performance was assessed through the Area Under the Curve (AUC) index. The AUC value ranges between 0 to 1 and was calculated by the Receiver Operator Characteristic (ROC) which is used to compare the probability of an occurrence against a boolean map which shows the actual occurrences (Eastman, 2012). In the ROC curve, the horizontal axis represents the false positive rate and the vertical axis the true positive rate. AUC connects the points obtained by the various thresholds. If the true events coincide perfectly with the higher ranked probabilities, then the AUC is equal to 1 (ideal model) (Eastman, 2012; Mas et al. 2013). Once the model was validated, the next step was to generate the LULC map for 2030. The Change Prediction tab concludes the analysis, by defining a prediction year (Magalhães et al. 2020).
This work used a MLP methodology. MLP extracts samples from areas that underwent change or not from the two land cover maps provided. This method runs on automatic, making decisions on how to best use data provided to model transitions (Eastman, 2012). Decisions on the number of training samples size, number of iterations, and learning rates can be made by the user. All values used here were IDRISI’s default.
3. Soil and Water Assessment Tool (SWAT)
The Soil and Water Assessment Tool (SWAT) was developed by the US Department of Agriculture and A&M University of Texas. The steps to obtain the streamflow regime using SWAT included the insertion of the data used in the modelling (Table 2), followed by the discretization of 32 parameterized sub-basins in 271 hydrological response units (HRUs). A HRU is the basic unit where the hydrological components were simulated, aggregated for each sub-basin and routed to the basin outlet throughout the channel network (Arnold et al., 2012). For data standardization, this work used downscaling (Zhou et al., 2015).
Table 2 Input data entered in SWAT
| Variables | Data source | Scale |
|---|---|---|
| DEM | Obtained from topography and hydrography from the tool Topo to Raster application on ArcGis 10.5 software. | 1:25000 |
| Precipitation | National Water Agency - ANA (http://metadados.ana.gov.br/geonetwork/srv/pt/main.home) (stations 02242009 e 02242022) | - |
| Air temperature, solar radiation and relative humidity | Global Weather Database (https://swat.tamu.edu/media/99082/cfsr_world.zip) | - |
| Soil map | Brazilian Institute of Geography and Statistics - IBGE (ftp://geoftp.ibge.gov.br/informacoes_ambientais/pedologia/vetores/brasil_5000_mil) | 1:5000000 |
| Land use | MapBiomas (http://mapbiomas.org/) | spatial resolution: 30m |
The subsequent steps were warm-up, sensitivity analysis, model parameters calibration, validation and future scenarios simulation. In this phase was applied the software SWAT-Calibration and Uncertainty Programs (SWAT-Cup) and the algorithm Sequential Uncertainty Adjustment (SUFI2). SUFI2 function performs the sensitivity analysis that minimizes the uncertainties imposed by the model parameters variations (Abbaspour et al., 2007; Narsimlu et al., 2015). The algorithm was adopted because it needs a minimum number of model simulations to obtain high quality calibration and uncertainty results (Narsimlu et al., 2015).
In order to obtain data with high percentages for calibration, as Andrade et al. (2012) and Narsimlu et al. (2015) did, were used in this stage the data related to 70% of the historical series (1966-2003), the remaining (30%) was applied in validation (2004-2018). The first 5 years of the model were set aside for the warm-up period required by the system stabilization to reduce systematic error. The time scale used in all stages was monthly because the daily-simulated data may be less accurate and in an analysis with a longer period, the hydrological processes tend to be more stable (Pontes et al., 2016).
In the calibration and validation results evaluation, the Nash and Sutcliffe (NS) model efficiency coefficient, the coefficient of determination (R²) and the percent bias (PBIAS) were used. NS values vary from infinity to 1, PBIAS evaluates the tendency of the simulations as being higher or lower than the observed data, positive PBIAS indicates an overestimation while a negative value indicates an underestimation (Zhang et al., 2020). PBIAS is defined as satisfactory when obtaining values lower than ±10 (Moriasi et al., 2007). R² and NS values greater than 0.5 classify as satisfactory and equal of 1 corresponds to a perfect match (Moriasi et al., 2007; Sao et al, 2020). NS, PBIAS, and R2 were calculated as follows (Equation 1, 2 and 3):
Where Qobs and Qsim are the observed and SWAT simulated streamflow (m³/s), and Q-obs and Q-sim are the mean observed and SWAT simulated streamflow (m³/s), respectively; N is the number of samples, and i is the ith sample (Zhang et al., 2020).
After model calibration and validation, a new simulation to identify streamflow data, for the period of 2019 to 2030, were carried out. An increase in precipitation is expected for the region where the ARG sub-basin is inserted as a consequence of climate change (Magrin et al., 2014), with an increase of 6% until 2039 (Barata et al. 2020). So, this study does not consider climate projections to inform future precipitation as the expected increase is low for the near future (2030). Instead, the historical precipitation data used was the same of 2007 to 2018 (measured by rain gauge), because this period recorded some of the lowest annual accumulated precipitation values, thus representing the most critical scenario in water availability terms.
To obtain LULC maps applied in the new simulation, authors used the LCM tool for 2030. The other parameters such as the DEM and the soil type map were the same as those entered in the first modelling because there are not significant changes on surface relief and soil typology occurred within the analysed time series. In other words, in order to achieve the objectives of this study, simplification was necessary by fixing some parameters (soil type, relief, precipitation) and only LULC was varied.
Results
1. Current LULC and water availability
In 2017, forest category predominates in the ARG sub-basin occupying 62% of the total area, mainly in higher altitude sites where the conservation units are located predominantly. Unlike the mosaic of agriculture and pasture (19% of the total area) and pasture (16% of the total area) were located in the flattest sites such as the Rio Grande River and its tributaries.
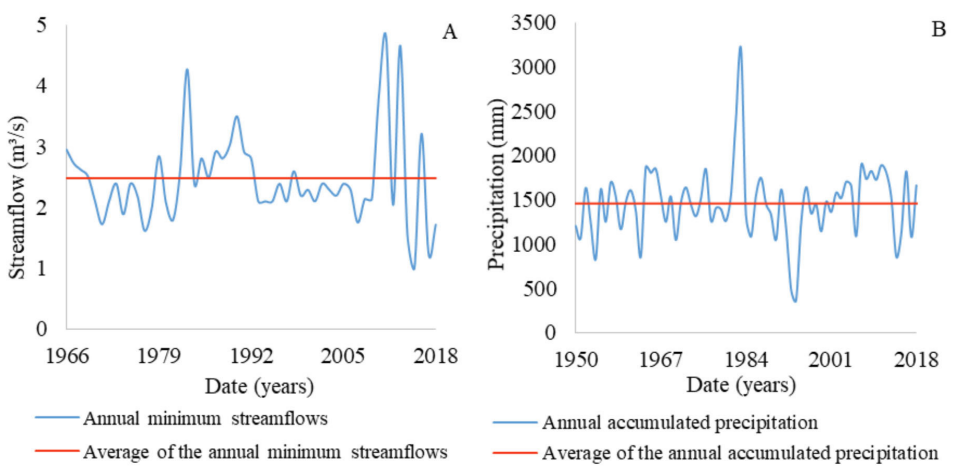
Regarding water availability, Figure 3A illustrates the annual minimum flows registered at least once in Rio Grande between 1966 and 2018. From this time series, it is possible to observe that smaller flows occurred in the 70s and in the recent years of 2014, 2015, 2017 and 2018, where values lower than average (2.5 m³/s) were found. The lowest flow recorded in the entire historical series was in 2015 (1.00 m³/s, occurring only once), followed by 2017 (1.24 m³/s, flow recorded during three consecutive days). In these years, one of the lowest annual accumulated precipitation since 1995 was recorded, reaching 856.5 mm in 2014 (Figure 3B).
3.2 Projection of LULC and water availability for the year 2030
All the variables were tested, using Cramer V’s analysis (Table 3) and selected for the transition sub-model, that is, the transition probability between LULC categories. To determine the transition potential, a neural network was used, as this is the method that presented the best performance (Lin et al., 2011; Sangermano et al., 2012). According to Akoglu (2018), Cramer V is used to measure association strength between two or more variables. It varies between 0 and 1, a value close to 0 means no association between variables and values close to one indicates a strong association between the variables.
Table 3 Predictor variables used in LCM and Cramer’s V values
| Variables predictors | Cramer V |
|---|---|
| Elevation | 0.1692 |
| Slope | 0.1961 |
| Distance to Rio Grande river | 0.1386 |
| Distance to conservation areas | 0.2037 |
| Distance to mosaic of agriculture and pasture | 0.2793 |
| Distance to roads | 0.1948 |
Cramer V’s analysis does not limit the use of a given variable. The values obtained in this analysis only indicate the association degree between the variables, however, even having a value considered low, since the variable is determined to be important for the studied transition, it can be used regardless of the Cramer V value obtained (Akoglu, 2018). Thus, in addition to considering the Cramer’s V values, the selection of variables considered the minimum accuracy of 75% (Magalhães et al. 2020) using MLP.
The methods applied for LCM validation presented high values, with AUC equal to 0.85. AUC values between 0.7 and 0.8 are considered acceptable, 0.8 to 0.9 is considered excellent, and more than 0.9 is considered outstanding (Mandrekar 2010). The excellent performance of the LCM can be observed in Table 4, where the greatest difference between the projected and observed LULC for 2017 was 1.1 km² and occurred for the forest category. From the digital maps and the LCM application, it was possible to obtain the LULC map for 2030 (Figure 4) and losses and gains for each category (Figure 5). There was a decrease of only 0.3 km² in area for the waterproofed areas category between 2017 and 2030. In contrast, there was an increase in area for the forest category (7.6 km²) followed by the pasture (3.9 km²). Mosaic of agriculture and pasture was the category that most contributed to the expansion of forests and pastures, with a reduction from 45.4 km² in 2017 to 34.2 km² in 2030.
Table 4 Areas in km² for the LULC observed in the Alto Rio Grande sub-basin
| Land use categories | 2012 | 2015 | 2017 observed |
2017 projected |
2030 |
|---|---|---|---|---|---|
| Forest | 145.1 | 143.3 | 147.3 | 146.2 | 154.9 |
| Pasture | 44.2 | 38.5 | 38.6 | 39.6 | 42.5 |
| Agriculture and pasture | 41.4 | 49.8 | 45.4 | 45.8 | 34.2 |
| Waterproofed areas | 5.3 | 4.4 | 4.7 | 4.4 | 4.4 |
| Total | 236.0 | 236.0 | 236.0 | 236.0 | 236.0 |
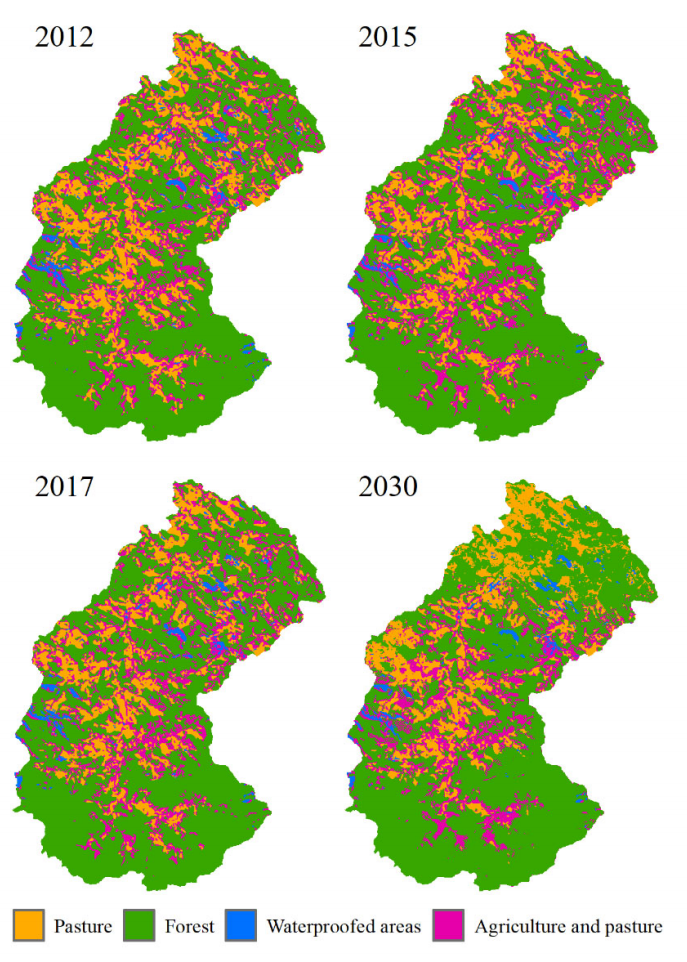
Figure 4 Land use and land cover for Alto Rio Grande sub-basin considering the years 2012, 2015, 2017 and the projection for 2030
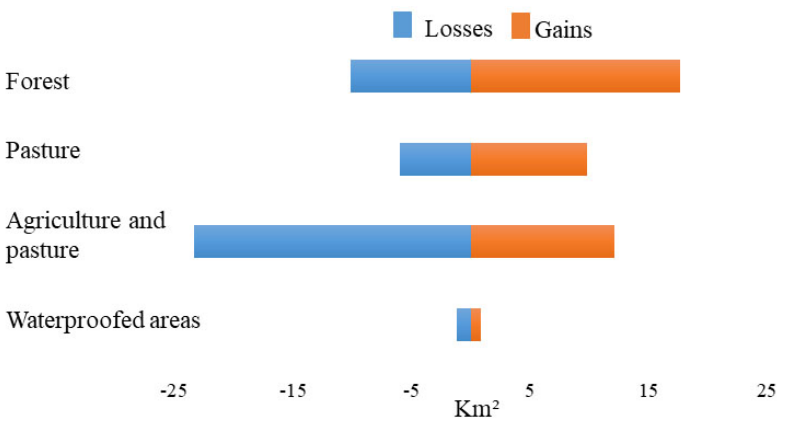
Figure 6 shows the expected changes between 2017 and 2030 for each LULC category. The south of the ARG sub-basin is the region where some conservation units are located and therefore no changes are expected since this location was included in the modeling as a restriction of anthropogenic use. For the other categories, it is possible to observe that the most significant changes actually occurred with the conversion of agricultural areas to pasture and forests. It is also possible to observe a displacement of agricultural areas that moved from the north of the sub-basin to the central region.
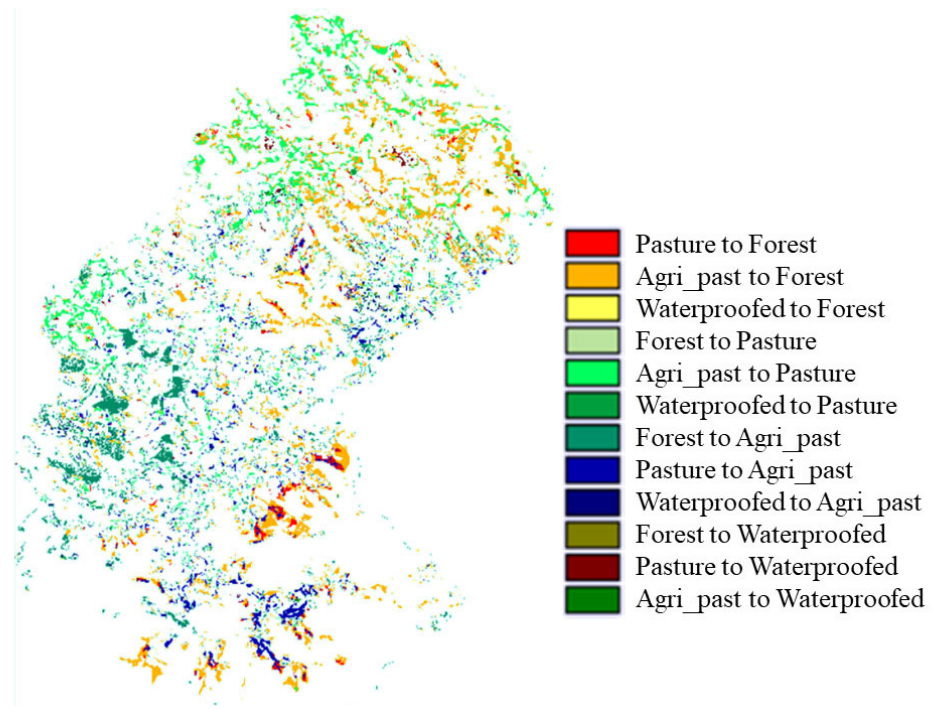
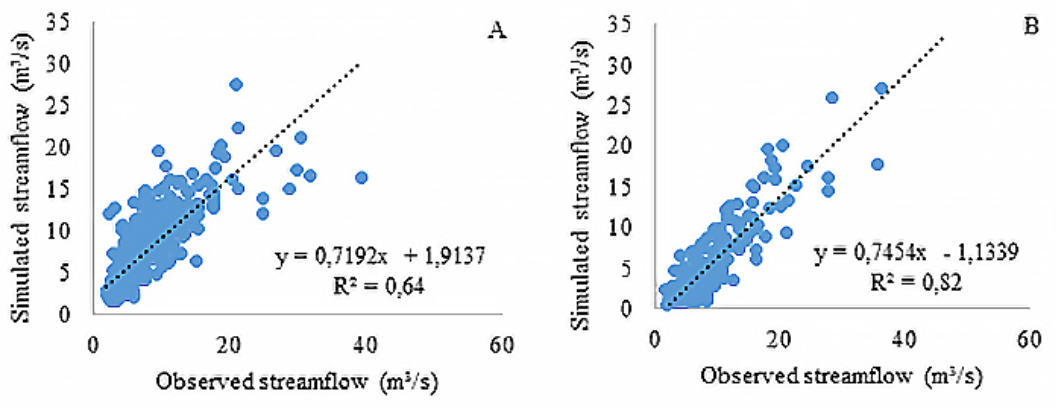
Table 5 presents the hydrological modelling performance executed in SWAT and Figure 7 shows the observed versus simulated streamflow for the validation and simulation steps and R² values. The rates of NS and R² values were greater than 0.5, being considered satisfactory in both the calibration and validation steps (Moriasi et al., 2007; Sao et al, 2020). PBIAS value is considered very good for calibration step (< ± 10) and unsatisfactory for validation step (≥ ± 25) (Moriasi et al., 2007) which indicates that 37.6% of the monthly values flow rates were underestimated.
Table 5 Monthly performance assessment indices of the SWAT model
| Parameters | Calibration (1966-2003) | Validation (2004-2018) |
|---|---|---|
| R2 | 0.64 | 0.82 |
| NS | 0.63 | 0.54 |
| PBIAS (%) | 2.1 | 37.6 |
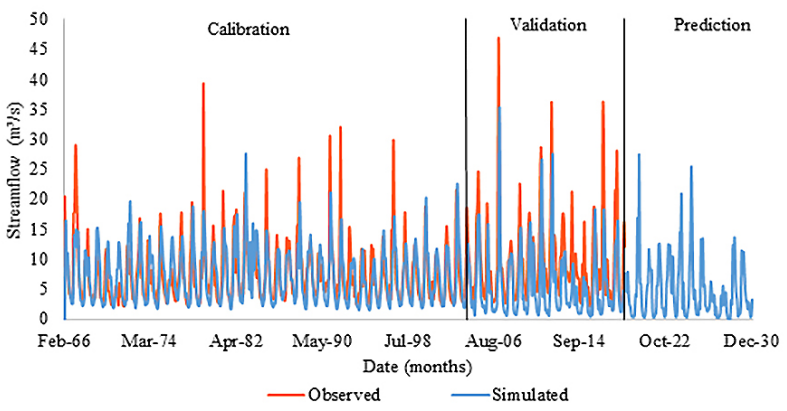
In Figure 8 it is possible to observe this behaviour in the validation step (2004 - 2018). The periods where the flow rates in Rio Grande were lower; there was a greater discrepancy between the observed and simulated values. It is also possible to observe the difficulty of the model in simulating flow peaks, presenting underestimated values. It is possible to observe also that the biggest discrepancies between the observed and simulated values occurred in the years 2011 to 2013.
In this study, only LULC was varied in the SWAT model while the other variables were fixed. Thus, it is possible to counteract, for example, the same rainfall conditions and the flow in Rio Grande considering the land use observed in 2017 and projected for 2030. By making this comparison, it was possible to observe a reduction in peak stream-flows of up to 59% in 2030. Moreover, it was found that for the land use projected for 2030 there would be a reduction in the average monthly flow of up to 63% in relation to the observed flow considering the land use of 2017. Another characteristic was the lower variation in flow over the year when comparing the estimated flows for land use projected for 2030 with the land use observed in 2017. For the same annual accumulated precipitation of 1661.6 mm, the monthly flows observed considering the land use of 2017 and 2030 varied between 2.4 and 27.7 m³/s (amplitude of 25.3 m³/s) and between 0.4 and 11.3 m³/s (amplitude of 10.9 m³/s) respectively.
These results are accompanied by a reduction in flow in Rio Grande for the next 10 years, both in the dry and rainy season. The most critical condition will occur if the precipitations observed in 2014 are repeated (lowest annual accumulated precipitation, 856.5 mm). In this scenario, minimum flows have reached values close to zero while maximum flow will be below 6.0 m³/s. It is important to note that an underestimation may have occurred because the model underestimated the flows in the validation step.
Discussion
The ARG sub-basin is inserted in the Atlantic Forest biome, which suggests that, before colonization, the region’s main land cover was forests. After colonization, there were changes to other uses, such as pastures and agriculture, which occurred in the smallest slopes observed in the ARG sub-basin. The steeper areas present limitations on agricultural mechanization because they affect the machines stability and the movement speed. It also does not indicate high declivities for raising animals, and may adversely affect growth and production. This characteristic restricts the anthropogenic use of conservation areas, which are predominantly located in higher altitude regions, and favour the maintenance of forests.
The LULC contributed to reducing water availability in recent years in the ARG sub-basin. The increase in potentially agricultural areas in 2015 probably resulted in an increase in the water consumption applied to irrigation activities which, added to the reduction in precipitation in the previous year, caused the decrease of groundwater stocks (decrease in the amount of groundwater) and a significant reduction in flow levels in the ARG sub-basin (Figure 3). In this way, the LULC associated changes in precipitation contributed to reducing water availability this year. This scenario highlights the need to identify future water availability considering the changes that will occur in LULC.
The LCM was applied in the elaboration of a prospective LULC map for the year 2030 (Figure 4). The statistical indice obtained in the validation stage indicated that the model showed excellent projection capability. For example, there was little variation in area for the waterproofed areas category between 2017 and 2030 (Table 4), which is consistent, as this category includes rocky outcrops that are less sensitive to anthropogenic actions compared to other uses.
On the other hand, an increase in the forests category was observed. It is possible to list three main factors that explain this behaviour. First (i), there were significant changes in the region’s landscape after the 2011 disaster. Some affected sites have been converted from forests to exposed soil. In the following years, a gradual forest restoration was observed. Precisely the land use maps for that period were used as inputs in the LCM. LCM calculates rates of change in the change analysis step as well as transition potential maps to establish the LULC projection (Shade and Kremer 2019). In other words, one of the features of the LCM is to extrapolate the rate of change in LULC observed in previous years to a future scenario, for this reason an increase in forest areas was observed for the year 2030 once this increase occurred over the years used in the modelling (2012-2015).
This aspect consists of a LCM limitation, where all the events of change, extreme or not, that occur before and after the time interval adopted for calibration and validation, are not counted in the image produced (Amaral e Silva et al., 2020; Marques et al., 2021). In addition, LULC involves complex and dynamic processes of human nature, such as social, institutional and economic processes, which can be difficult to detect for the variables and algorithms available in the models (Olmedo et al., 2015).
Second explanatory factor (ii) is the inclusion of protected areas in the LCM. A study developed by the environmental agency of Rio de Janeiro showed that ARG sub-basin region has high potential for natural regeneration due to forest remnants and connectivity between them (INEA, 2018). This hypothesis is reinforced by observing one of the most significant changes projected to occur between 2017 and 2030, which will happen close to the conservation area, with the conversion of agricultural areas into forest (Figure 6). In addition, the predictor variable “distance to conservation areas” presented the second highest of Cramer’s V value (0.2037), which indicates that this predictor has a higher correlation with LULC compared to others such as ‘slope’ and ‘distance to roads’. Furthermore, a recent survey conducted in South-eastern Brazil found an increase in forest areas between 2001 and 2015 that was attributed to two main factors: change in Brazilian legislation, with New Forest Code (Law 12.651/2012) implementation and silviculture expansion (Moraes et al., 2018).
A third justification (iii) refers to changes in the region’s economic activities. Agriculture developed in the ARG sub-basin is practiced by family farmers, the landslides that occurred in 2011 resulted in soil fertility loss, agricultural equipment and other inputs losses and product flow pathways obstruction. The high cost associated with soil recovery and the structure existing before the disaster (Freitas et al., 2012) are factors that can motivate the development of other economic activities and induce changes in the economic structure of the region. The distance from agricultural areas presented the highest Cramer’s V value (0.2793) among all the variables evaluated (Table 2), in addition it was possible to observe that the reduction of agricultural areas occurred in several places in the basin, that is, not were concentrated in a single region (Figure 6). All these characteristics are indications that reinforce the hypothesis of a change in the economic activity developed in the region (agriculture) to other practices (such as silviculture and cattle breeding). When projecting LULC for 2050 in a watershed located in China, Wu et al. (2018) also observed an increase in forest and pasture areas to the detriment of agricultural regions. The authors attributed these results to environmental protection policies and changes in the local economy.
Considering the main LULC changes expected for the ARG sub-basin in 2030 (reduction in the mosaic of agriculture and pasture category, which was accompanied by an increase in forests and pasture areas) (Table 4 and Figure 4), it is possible to make some inferences in hydrological components. For example, the decrease in the potentially quantified agricultural areas does not necessarily represent a reduction in the water demand in this activity because there is expected an increase in irrigation in Brazil (Cunha et al., 2014).
The conversion of agricultural areas into pasture can provide greater surface runoff as there is less infiltration due to soil compaction by cattle, which can result in flow peaks. Conversely, the conversion of agricultural areas to forest can reduce runoff due to interception, presence of litter and infiltration. Therefore, an increase in base flow and a decrease in flow peaks can be observed, this behaviour is accompanied by an intensification of evapotranspiration, which may also reflect a lower flow in rivers. It is important to note that although pastures or agricultural crops increase the supply of readily available water in a basin, this is not an environmental benefit, as forests act in the maintenance of the minimum flow, in protecting the soil against erosion and transport of sediments. The effects of LULC on hydrological components is a complex issue as the variables that control hydrological behaviour are many and interdependent, for this reason the SWAT model was applied.
As for the hydrological model, it is common for the statistical validation period indexes to be less satisfactory compared to the values obtained in calibration. This is because parameters are optimized specifically for calibration period and the period used in validation may present different conditions (Fukunaga et al., 2015). This is the case in this study (Table 5), the lower performance in the validation stage can be attributed to the precipitation data used. When calibration and validation periods are similar, better results can be obtained. In this study, this did not occur because the period of less precipitation was accumulated in the final years of the historical series (2007 a 2018). Other ARG sub-basin particularities, such as changes in relief resulting from landslides, might also have interfered with validation performance. As shown in Figure 8, the biggest discrepancies between the observed and simulated values corresponds to the year of the disaster and the following two years.
Furthermore, ARG sub-basin has only one fluviometric station, so any inconsistency in recorded data may compromise the comparison between observed and simulated flows. Anaba et al (2017) obtained PBIAS of 23% at the validation stage of the SWAT model for a basin in Uganda. These results occurred since the use of poor observed data quality and to the possible occasional effluents discharge that could not be accounted for during the simulation. Lotz et al. (2018) also mention that the divergences between calibrated and validated values may be the result of localized precipitation not recorded in monitoring stations. However, this does not seem to be the case for the ARG sub-basin as the precipitation values available in the two pluviometric stations are similar, being that 65% of the data showed a coefficient of variation of less than 30% when compared. Another factor that can change the flow regime in a water body and compromise the performance of the SWAT model is the presence of reservoirs (Anaba et al., 2017), which was not observed in the ARG sub-basin.
ARG sub-basin is located in a region characterized by the monsoon system, where a rainy and a dry period are well defined. However, it is expected that for the coming years (considering that the rainfall observed between 2007 and 2018 will be repeated), a reduction in the amplitude of the flows observed between the months of drought and rain will be reduced if compared with the land use observed in 2017. This behaviour was accompanied by a decrease in both the maximum and minimum flow observed with the identified LULC for 2030 compared to 2017 (Figure 8).
The increase in forest areas projected for 2030 plays an important role in these changes in the hydrological regime. In forested areas, an initial portion of precipitation is intercepted by vegetation; another portion reaches the ground and infiltrates what reduces surface runoff and flow peaks. On the other hand, forest vegetation also consumes water by evapotranspiration. In tropical forests, 67.6% of the precipitation was lost to the atmosphere through evapotranspiration (Leopoldo et al., 1995). This water loss affects water availability. Saddique et al. (2020) observed a reduction in water yield of 48.32% and an increase in evapotranspiration of 51.93% in Upper Jhelum sub-basin between 2001 and 2018. The authors attributed these results to forest cover gain.
It is important to highlight that forests play an important role in promoting water infiltration into the soil and recharge of aquifers. However, this capacity can be affected by the relief and the stage of vegetation development. For the ARG sub-basin, which has more accentuated slopes, a higher flow velocity is expected which can reduce water infiltration and evapotranspiration possibly prevailed. In addition, Mendonça et al. (2009) mentions that for deforested regions there can be an increase in flows in the first three years, followed by a decrease that can last from 15 to 20 years with the regeneration of the vegetation. Only after 40 to 50 years, when the plants are already mature, does the flow recover. These flow variations were attributed to greater evapotranspiration in the growth phase and to a subsequent drop with the ripening of the vegetation.
The comparative analysis of previously published work on future water projection shows that the magnitudes of LULC and their impacts on the hydrological regime are different because each region has its own characteristics. However, the behaviour trend is similar. For example, Marhaento et al. (2018) evaluated the future hydrological response to changes in land use in the Samin basin (Indonesia) using Markov chain, multi-criteria evaluation and SWAT. According to the authors, in 2000, 42.3% of the total area was forest. In a more conservative scenario, it is expected that by 2050 forested areas will occupy 30% and agricultural areas 52.1%. The future hydrologic response indicates a reduction in evapotranspiration which was accompanied by an increase in streamflow of up to 20%.
Another example, a study made by Abe et al. (2018) identified the potential future LULC impacts on the hydrological regime of the Upper Crepori River basin (Brazil) using the SWAT model. The authors considered two land use scenarios for 2050, one less conservative (50.67% of the area will be forest while 46.39% will be pasture) and another more conservative (76.22% forest and 20.84% pasture). They found that the changes expected for 2050 in the flow regime showed that the less and more conservative scenario presented increases of up to 11% and 22%, respectively, during the rainy season, and reductions of up to 19% and 32%, respectively, during the dry season. Percentages were calculated in relation to land use before the anthropic changes where the forests corresponded to 99.63% of the area.
Regional studies of LULC and water availability should be conducted in order to consider local particularities. In this context, the present research presents a worrying result, because in the case of a rainfall of less than 856.5 mm, the streamflow in Rio Grande will be close to zero. With the possibility of reducing water availability in the ARS sub-basin, adopting preventive measures is extremely necessary in order to promote water security in the region.
It is important to highlight that additional studies are needed because the aim of this study was to determine the projection of LULC for 2030 and the consequences of the projected changes on water availability considering a low rainfall scenario, as this is the most critical condition. The impacts of LULC alone on the stream flow of Rio Grande for the year 2030 was determined. Climate changes were not considered and this should be the focus of future research.
Conclusions
The changes in landscape that occurred in the ARG sub-basin in 2011 probably affected the results obtained in this study. Limitations such as LCM extrapolating the rate of forested areas recovery to the year 2030 and the changes in flow that occurred between 2011 and 2013 compromised the SWAT validation stage. Despite the limitations, results obtained in this study indicate an increase in forested areas and pastures to the detriment of agricultural areas. Due to these changes, a decrease in water availability was projected, reaching values close to zero during drought periods and a smaller amplitude between the peaks of maximum and minimum flow rates.
These results, despite presenting possible inconsistencies, will help to formulate strategies for water resources management and the adoption of measures to promote water security in the region. In addition, the combination of the LCM and the SWAT proved to be a highly valuable tool in terms of the management and monitoring of the water availability of the regions, as it makes possible the modelling of extreme events, allowing for greater adequacy and precision to the characteristic conditions of the studied area.

