


 text new page (beta)
 English (pdf)
 Article in xml format
 Article references
 Send this article by e-mail
 Cited by SciELO
  Similars in
SciELO
Similars in
SciELO 
 Permalink
Introduction
Cell lysis occurs when external stress ruptures the membrane of a cell, releasing its cytosol to the extracellular medium (Fig. 1). The nature of the mentioned stress could be mechanical, chemical, viral, osmotic, etc. Hence, measuring cells' vulnerability to a particular stress could be useful to get information about the cells' state and integrity1-3. For instance, a low resistance of red blood cells (RBCs) or erythrocytes to osmotic stress is commonly related with some kinds of anemia.
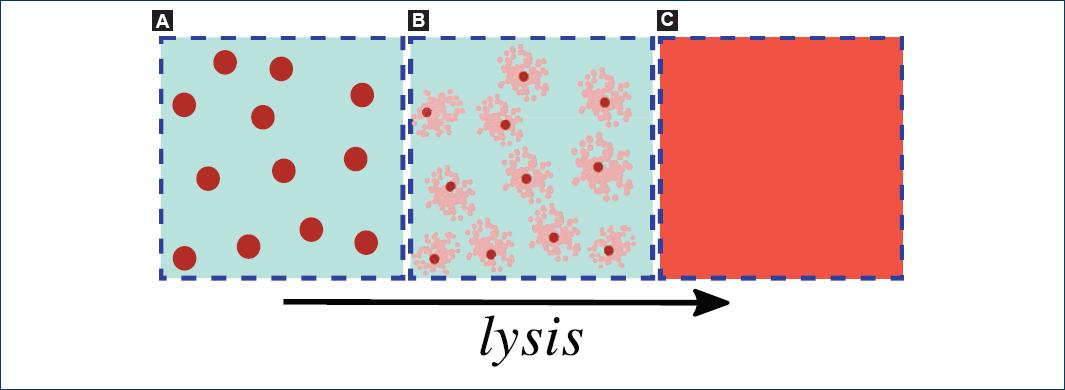
Figure 1 A: a suspension of biological cells. B: the process of lysis, in which the cell's membrane ruptures and the cytosol is released into the surrounding medium. C: the cytosol diffuses uniformly in the external medium. The arrow indicates the temporal evolution of a cell lysis.
The primary function of RBCs is to enable respiration in tissues by providing oxygen and removing carbon dioxide through gas exchange in the lungs. During the lifespan of an RBC, it circulates through arteries, veins, and small capillaries traveling a distance that represent 500 km4. The characteristic shape of a biconcave disc is fundamental for conferring to the cell its peculiar deformability; this ability of the RBC to change shape is essential for successful passage through these capillaries and splenic sinuses5. Normal human RBCs circulate for approximately 120 days and they are then cleared in a strictly time-dependent fashion by macrophages6. However, premature destruction of RBCs, also known as hemolytic anemia, is a life-threatening condition7. Hemolysis may result from diverse pathologies that are intrinsic or extrinsic to the erythrocytes but whatever the underlying cause or trigger, although hemolytic anemia is a relatively rare condition (1:10,000/100,000), the potential complications can be many and severe, mostly triggered by hemoglobin-nitric oxide scavenging reactions and reactive oxygen species generation. These include jaundice, hepatosplenomegaly, tachycardia, myocardial ischemia, respiratory and renal failure, and, ultimately, multiorgan dysfunction and death; the mortality rate can be as high as 10%8-10.
The current diagnostic approach to patients with suspected intravascular hemolysis is time consuming and requires trained personnel. For example, hemolytic disorders can be well diagnosed exposing the red cells to different concentrations of NaCl solutions using a spectrophotometer and several test tubes to determine cells' osmotic fragility. In fact, there is a vast array of other types of laboratory tests available used as screening tests or first-line tests for hemolytic illnesses (complete blood cell count, reticulocyte counts, peripheral blood smear revision, total and unconjugated bilirubin, lactate dehydrogenase, haptoglobin, ferritin, and urinalysis), while others, conventionally called second-line tests, are most frequently used to reach a presumptive or definitive etiopathogenetic diagnosis (e.g., Coombs test, serological testing, enzymatic testing, osmotic fragility test, hemoglobin analysis, genetic testing, etc.)11,12. The major drawback in the conventional diagnostic workup of patients with suspected intravascular hemolysis, besides being time consuming and requiring specialized technicians, is that no single first-line test has such a high diagnostic efficiency to safely rule out the condition in all patients13. In other words, there are no tests with a 1.00 negative predictive value (which is the probability that subjects with a negative screening test truly do not have the disease).
Thus, there is a clear need for first-line tests for diagnosing hemolytic disorders rapidly and without requiring specialized staff. We need first to identify possible measurements of RBC properties that could be linked to hemolytic disorders and that may provide alternative and reliable techniques of diagnostics. A simple physical method to monitor the kinetics of the lysis of RBCs in real time, i.e., while the stress is being applied, could be a convenient way to search for new tests for fast and in situ diagnosis. For this purpose, we are interested in investigating the use of blood electrical properties.
Our objective in this work is simply to establish, as a first step, the viability of monitoring lysis of erythrocytes in suspension due to an osmotic stress with unsophisticated electrical measurements and estimate the resolution using standard commercial instrumentation.
In fact, electrical measurements are commonly used for the characterization of biological cell suspensions and tissues. There are many review papers about dielectric spectroscopy of biological material14-20, where the electrical polarization mechanisms that are present in this kind of systems and their frequency dependence typically result in the so-called α, β, and γ dispersion bands. The frequency range where each dispersion band occurs will, in general, depend on the type of cells and the medium in which they are suspended. The first option to investigate is a simple electrical capacitor formed by the cell suspension within parallel-plane electrodes. Such a capacitor is easy to fabricate and clean.
In this work, we show results from measurements of the capacitance and resistance of a homemade encapsulated parallel-plane electrode capacitor filled with diluted hypotonic solutions of blood while hemolysis was in progress.
This paper is organized as follows. In Sect. 2, we briefly state the physical assumptions for modeling the electrical measurements of a capacitor filled with a cell suspension. In Sect. 3, we describe our experimental device and methodology. In Sect. 4 and 5, we present our results and a discussion, respectively. Finally, in Sect. 6, we give our conclusions.
Theoretical methods: effective medium modeling and equivalent circuit
When an oscillating electric field is applied to a biological cell in suspension,
ionic currents are induced inside and outside the cell, oscillating at the same
frequency of the applied electric field, and charge accumulation may occur at the
interfaces with the cell's membrane (the so-called Maxwell-Wagner effect). The
induced electric field around the cell is equal to that of a net electric dipole
within the cell. Thus, from an electrical point of view, a cell suspension is a
random collection of electrically polarizable entities. If there are a large number
of cells in a specified volume, we may regard the cell suspension within this volume
as an effective medium with an effective electric permittivity15,20,21, ϵeff, as
illustrated in figure 2.
ϵeff is, in general, a complex quantity and a
function of frequency F. There are well-established theories to
find expressions to different degrees of approximation for the effective electric
permittivity. These expressions are in terms of the electric permittivity of the
cells' interior, the cells' membranes, and the suspending medium, weighted by the
volume fraction, f occupied by the cells. Some of them consider the
influence of the membranes' thickness and cells' shape16,22,23. The effective dielectric function, is given
by the effective electric permittivity ϵeff divided by
the permittivity of vacuum,  .
.
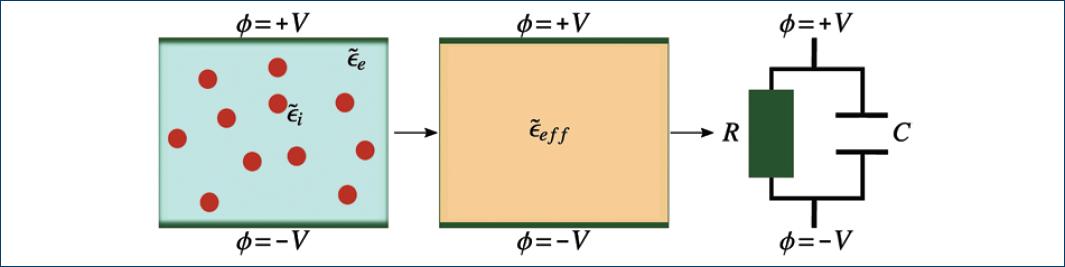
Figure 2 Scheme of a parallel-plate capacitor hosting a biological cell suspension, its interpretation as an effective medium, and the equivalent circuit.
In general, the effective electric permittivity cannot be directly measured; thus, to infer the effective electric permittivity from measurable parameters (e.g. electrical resistance R and capacitance C), it is convenient to use the equivalent circuit approach. An equivalent circuit of a system electrically describes the impedance of the system. An electrical capacitor holding a cell suspension is, in general, a lossy capacitor. It can be modeled with an equivalent circuit as depicted by the rightmost diagram in figure 2.
The frequency-dependent capacitance, C, and parallel resistance, R, of the equivalent circuit are related to the real and imaginary parts of the effective dielectric function by,
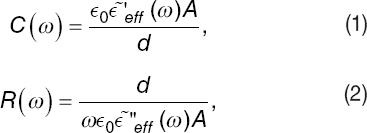
where ε~′eff(ω) and ε~′′eff(ω) are, respectively, the real and imaginary part of the effective dielectric function, ε0 is the vacuum's electrical permittivity, and ω = 2πF is the radial frequency. These formulas depend on geometrical parameters of the parallel-plate capacitor, such as electrodes' effective surface area A, and the distance d between them.
The effective resistivity, ρeff, of the suspension can be inferred from the value of R. In fact, we have that R = dρeff/A, thus from Equation (2), we have,
The inverse of the effective resistivity is the effective conductivity, σeff = 1/ρeff.
Electrodes' polarization influence
Biological systems exhibit relatively high conductivity values due to the high concentration of free ions in solution. In the presence of an external applied electric field, ions are drifted toward the counter-charged electrode and adsorbed on its surface. Then, counterions are attracted to the adsorbed layer of ions and the so-called electric double layer is formed (Fig. 3)24,25.
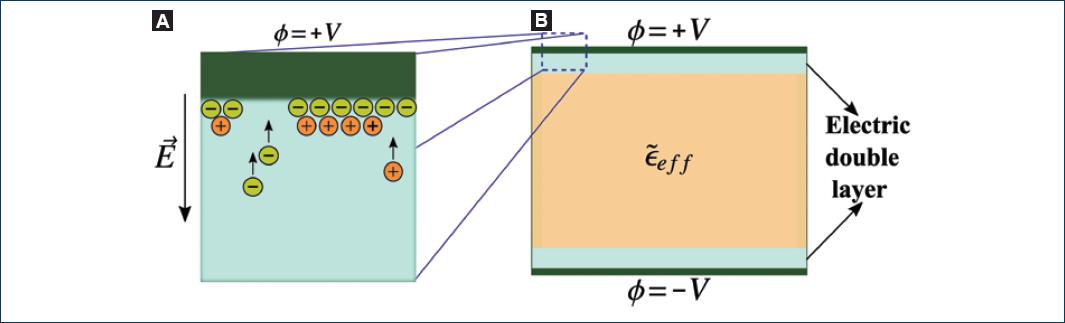
Figure 3 Electrode polarization in a parallel-plate capacitor. A: process of electric double layer's formation. B: representation of the electric double layer as a thin film of material with another dielectric function that affects the polarization response of the sample of interest.
There are several papers that describe and model the occurrence of this phenomenon24,26,27. In most cases, it is an inconvenience because the resultant capacitance from these double layers masks the dielectric response of the bulk of the sample to be analyzed. Some reviews give common techniques to deal with electrode polarization24-26. In this work, we use the method referred to as fitting impedance. It consists of fitting the behavior of the measured capacitance and resistance and extracts from the fitting procedure the values of the desired parameters.
Thus, our goal is to assess the viability of monitoring a cell lysis process from variations of the effective dielectric function and in the presence of the phenomenon of electrode polarization. The electrical double layer can be incorporated to the equivalent circuit as another capacitor in series with the equivalent circuit in figure 2. We denote this capacitor as C1, as depicted in figure 4. We assumed that C1 is a lossless capacitor (R1 = ∞). Since ions are absorbed on the electrode's surface and immobilized, so they cannot contribute to conduction26,28.
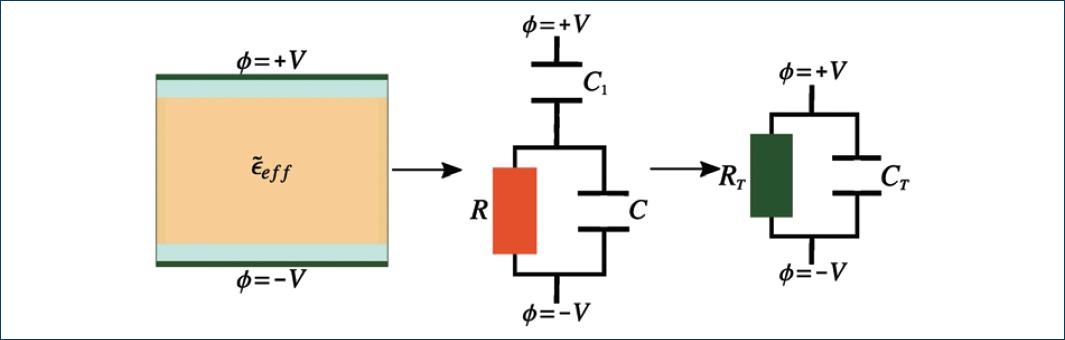
Figure 4 Equivalent circuit of a conductive effective medium that induces the electrode polarization in a parallel plate capacitor. C1 is the capacitance of the electric double layer, C and R are the capacitance and resistance of the capacitor filled with the cell suspension without electrode polarization.
Under typical conditions,  the total capacitance CT and resistance
RT can be approximated as,
the total capacitance CT and resistance
RT can be approximated as,
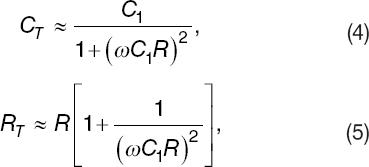
where ω = 2πF and F are the excitation frequency. Note the resultant expressions indicate that under the influence of electrodes' polarization such that C1 ≫ C, it will not be possible to infer the value of C from measurements of neither CT nor RT. However, one may measure R form either CT and RT.
Experimental methods
To test experimentally the viability and resolution of simple electrical measurements for monitoring a cell lysis process, we chose to monitor the suspensions of human erythrocytes in saline water. As already said, determining erythrocytes membrane fragility has important medical diagnostic applications. Whole blood samples were obtained from two volunteers and diluted by mixing one part of whole blood and three parts of isotonic NaCl (Sigma-Aldrich Co., St. Louis, MO, USA) water solutions (0.9 w%).
First, we prepared a set of hypotonic dilutions of the whole blood with salt concentrations between 0.2 w% and 0.8 w% to build an osmotic fragility curve as described in reference29. Five hundred microliters of isotonic blood dilutions were further diluted in 5 ml of the hypotonic NaCl water solutions to determine an adequate concentration at which hemolysis is induced, but its progress in time is slow. We determined the concentration value of 0.4 w% as convenient to monitor the hemolysis process in real time. At this salt concentration and with normal erythrocytes, complete hemolysis is basically expected to occur after 30 min2,3. The final volume content of erythrocytes was close to 0.01. This was estimated considering that the measured hematocrit was about for both samples of blood (40% volume fraction).
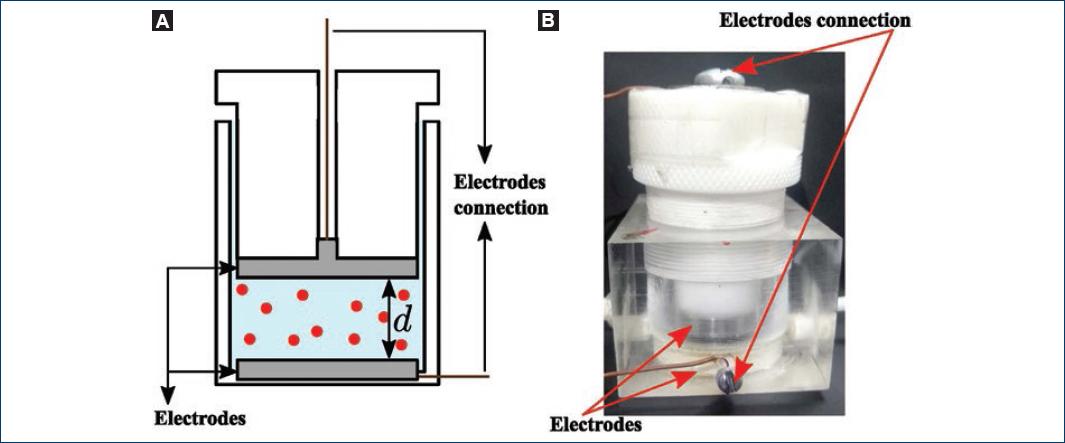
Immediately, after a hypotonic blood dilution was prepared, it was inserted in a homemade capacitive sensor, and the capacitance and resistance were measured as a function of time. The capacitive sensor consists of an acrylic cell with a cylindrical cavity and a plunger that slides inside the cavity forming a closed cavity to hold the cell suspension. A parallel-plate capacitor of circular cross section is formed with stainless steel electrodes at the base of the plunger and cavity (Fig. 5). The surface area of the electrodes is A ≈ 7.9 cm2 and the separation distance between them is variable from d = 0 to d ≈ 1.3 mm. The capacitance and resistance of the device were measured with a commercial LCR meter from Stanford Research (model SR715). The instrument directly gives us the capacitance CT and resistance RT of the system.
Results
Graphs below show representative results obtained after monitoring the capacitance and resistance of two samples of hypotonic blood dilution from two different healthy volunteers (Figs. 6B-C). The sensor was excited with a voltage of 1 V at a frequency of 10 kHz. For comparison purposes, we also show graphs of the same experiment with the capacitive sensor filled with the same hypotonic solution used, but now without erythrocytes, i.e., a simple solution of 0.4 w% of NaCl in tridistilled water (Fig. 6A). In figure 7A-C, we show the corresponding graphs of the resistance as a function of time.
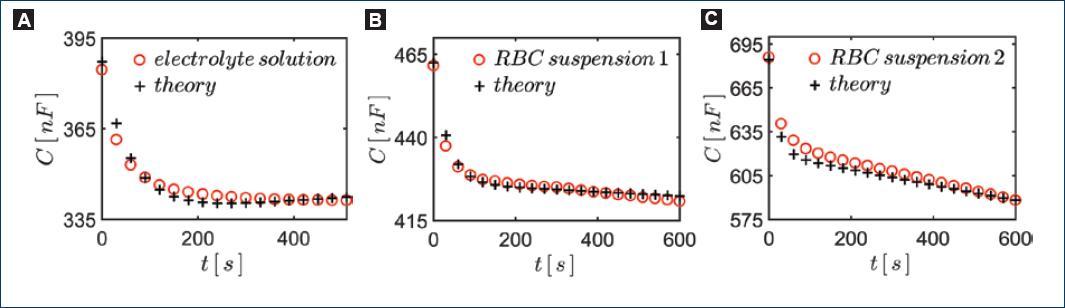
Figure 6 Monitoring hemolysis through the resultant capacitance C of the system. We show curves obtained. A: 0.4 w% NaCl hypotonic solution without RBCs. B-C: blood from two different individuals in each case.
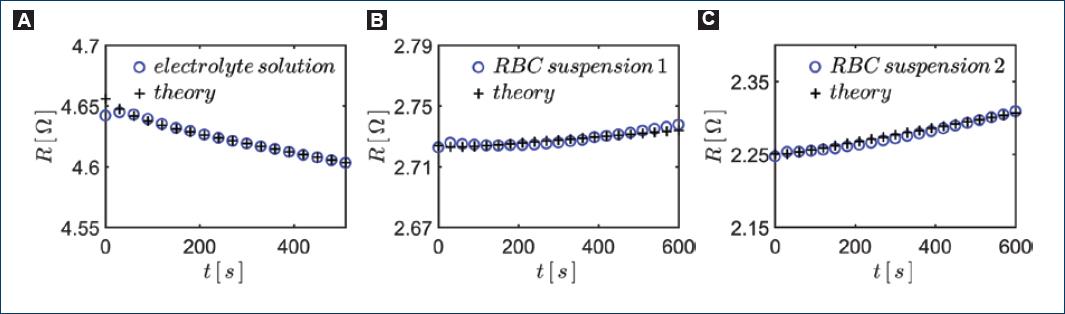
Figure 7 Monitoring hemolysis through the resultant resistance R of the system. We show the curves obtained. A: 0.4 w% NaCl hypotonic solution without RBCs. B-C: blood from two different individuals in each case.
The capacitance of the system, filling the sensor with pure water, is readily estimated to be C ≈ 4.3 × 10⁻¹ nF, whereas the capacitance signal in figure 6 is hundreds of nanofarads. Thus, clearly, the capacitance with the electrical double layer on the electrodes is much larger than without it, that is, C1 >> C.
The capacitance signal in figure 6A, obtained with pure NaCl solutions, decreases exponentially and stabilizes after about 3 min. This fact assures us that the exponential behavior of the capacitance is unrelated to the presence of erythrocytes. Thus, we conclude that the exponential decrease in capacitance should be due to the formation of the electrical double layer at the electrode (polarization of the electrodes). After the exponential behavior of the capacitance signal, we see that the capacitance signal either stabilizes or keeps decreasing but linearly with time.
In the corresponding graphs in figure 7 the effect of electrodes' polarization is less clear. This means that the product ωC1R is large enough that, basically, is RT ≈ R and all resistance signals depend almost linearly on time.
Inspecting Equations (4) and (5), we may infer that the behavior of the experimental curves in both, figures 6 and 7, would be consistent with and exponential decay in time of C1 together with a linear increase in time of R.
To verify whether we can use Equations (3) and (4) to understand the electrical measurements of the capacitive sensor with the erythrocytes suspension, we assume an electrode polarization capacitance of the form,
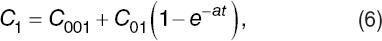
where C001, C01, and are fitting parameters. Then, for the resistance as a function of time, we assumed,

where R02 and H are fitting parameters. H represents the rate of change of resistance in time and could change its sign if the hemolysis occurs or not.
Then, we found the values of the parameters appearing in the expressions in Equations (6) and (7) to fit the experimental data using Equations (4) and (5). The values of the parameters for fitting the theory with experiment are listed in table 1. We can appreciate in figures 6 and 7 that the theoretical curves reproduce fairly well the experimental ones.
Discussion
Note that in figure 7A, the resistance decays in time. This must be due to the heating of the solutions due to the induced currents within the electrolyte solutions. The measuring electronics apply a voltage of 1 V to the capacitive sensor while the resistance of the electrolyte solution is between 2Ω and 4Ω. The power dissipated in the liquid is enough to increase the temperature by several degrees over few minutes (considering an adiabatic process).
In the other graphs in figure 7B and c that correspond to the diluted suspensions of erythrocytes in hypotonic solutions, we can see that the resistance increases almost linearly in time. This must be a consequence of the hemolysis process and surely, it should be possible to correlate this behavior with some internal process that occurs during the stages of hemolysis. For instance, before the rupture of the RBCs, its volume and shape change considerably and its membrane thickness decreases in time; also, as the hemoglobin is released from the erythrocytes the overall mobility of the ions in solution may decrease. It is known that in normal blood, the inside of erythrocytes is much less conducting than plasma outside. This is thought to be due to a lower mobility of ions in the presence of hemoglobin30. Some modeling and further experimental work is needed to correlate the electrical resistivity signal to the physical processes happening during the hemolysis.
Recall that the initial volume concentration of erythrocytes in the samples used for the experiments was about 1%. Thus, the change in resistance of the capacitive sensor due to hemolysis during the 600 s of each experiment corresponds to a change in the volume fraction of the lysed erythrocytes of < 1%. Now, both the capacitance and resistance signals plotted in figures 6 and 7 present a noise much smaller than the observed change in the signals values after 600 s, meaning that one could discern a change in the volume fraction of lysed cells much smaller than 1%. In fact, from inspecting the plots in figures 6 and 7, we can see that one could discern variations of the resistance of at least one-tenth of the overall variation during the 600 s. Thus, at least a resolution of 0.1% in the change of the volume occupied by the unperturbed RBCs is measurable in this way.
Notice that the constant H in Equation (7) is a result of the combined effects of increasing temperature (negative contribution) and the hemolysis (positive contribution). To separate both effects, we defined a positive parameter h that takes the value of zero h = 0 when there is no hemolysis. Hence, the slope of the resistance line, H = h - b is negative when there is no hemolysis, that is, when h = 0 (Fig. 7A) and positive if h > b, where b is the rate of change of resistance due to a temperature increase. The results showed in figure 7B and C shows that it is possible to reach the condition mentioned before, i.e., hemolysis contribution is stronger than the effect of temperature. Therefore, we can determine the signal due only to hemolysis by measuring H with and without RBCs lysing and then we obtain h as H + b.
Comparing figure 7B and C, we see a difference in the rate of change of the resistance in time, suggesting that it should be possible to infer differences in osmotic fragility of erythrocytes in suspension between different individuals, and thus, showing that this type of sensors could, in fact, be used to investigate alternative rapid medical diagnostic tests in future works.
Conclusions
We showed that it is, in fact, viable to monitor hemolysis induced by osmotic stress in human erythrocytes using a rather simple capacitive sensor with parallel-plane electrodes. Due to the so-called polarization of the electrodes, only the effective resistivity of the erythrocytes suspension is directly measurable. We performed experiments with diluted suspensions of erythrocytes in hypotonic NaCl solutions and measured an almost linear time dependence of the effective resistivity that can be attributed to the progress of hemolysis. The results clearly show that a resolution at least of 0.1% in the volume occupied by unlysed erythrocytes during an osmotic stress is achievable without much difficulty. Furthermore, the resistance signal due to hemolysis is clearly detectable right after the sample is introduced in the sensor. This means that it is possible with the current electrical sensor to measure the rate of lysis of RBCs in a short period of time and compare this rate between different individuals or with a standard. Measuring the rate of a hemolysis process could be used for rapid determination of RBCs vulnerability to different types of stress. Therefore, we believe the present results open the way for new research in the development of electrical sensors for express medical diagnosis from RBCs physical properties.

