


 nueva página del texto (beta)
 Inglés (pdf)
 Artículo en XML
 Referencias del artículo
 Enviar artículo por email
 Citado por SciELO
  Similares en
SciELO
Similares en
SciELO 
 Permalink
Study contribution
Vegetable protein sources are cheaper alternatives to fishmeal for shrimp feeding. However, there is little information on the effects of these ingredients on production performance and shrimp quality traits. This study evaluates the technical feasibility of fully replacing fishmeal with soybean and canola meal (fermented or not) in shrimp feeding. The results demonstrated that fermented soybean and canola meal had no effect on animal production performance or shrimp meat quality attributes. Therefore, it represents an alternative to reduce the dependence on the costly and less sustainable fishmeal. The unfermented soybean and canola meal is not recommended for shrimp feeding as it increases mortality.
Introduction
The global supply of seafood products has increased due to growing demand.1 Therefore, aquaculture has a steady growth to meet the demand for human consumption.2 Fishmeal is usually the main protein source in shrimp diets due to its high nutritional value.3, 4 However, its use represents environmental (overfishing), economic (variations in prices and availability of raw material) and quality (variations in nutritional value and adulteration) difficulties.5-7
The use of high-quality proteins in shrimp diets improves their digestibility, growth, and health, as well as shrimp quality.8 Shrimp quality attributes are associated with the perception of flavor, aroma, color, and firmness by consumers. Among these, firmness is the most important attribute for consumers.8-10 It may vary depending on factors such as the farming system,11 post-harvest handling (type of storage, preparation method),12 and feeding.
Brauer et al.13 reported that muscle lipid and protein content changes when shrimp are fed different protein sources (sardine meal, squid meal or a commercial formula). Along the same lines, Maldonado14 evaluated the effect of dietary vegetable flours (soybean, wheat, and potato flours) on firmness-related attributes of L. vannamei, such as shear force and collagen type. In that research, there was no variation in shear force across diets, as shown by the similar electrophoresis patterns of type V collagen extracted from shrimp muscle. Other studies have shown that fishmeal can be substituted by plant-based proteins in shrimp diets,15 provided that palatability and digestibility and amino acid balance are adequate. In this regard, soybean and canola meals are good options to replace fishmeal due to their nutritional attributes (containing almost all essential amino acids) and low cost compared to fishmeal.16-18
Soybean and canola meals have been tested in the feeding of different productive species (trout, salmon, other teleost fish and crustaceans) with positive results.10, 19, 20 Moreover, it has been observed that the fermentation of these vegetable meals improves their nutritional value, increasing protein bioavailability and degrading anti-nutritional factors, which are abundant in these ingredients.15 However, there is little information on the effects of vegetable protein sources (fermented or not) on digestibility, production performance, and quality of shrimp. Therefore, this study evaluated the effect of dietary fermented and non-fermented soybean and canola meals on growth performance, in vivo and in vitro digestibility, digestive enzyme activities, and meat quality of L. vannamei.
Materials and methods
Ethical statement
This research project was reviewed and approved by the Institutional Committee for Experimental Animal Care and Use (SICUAE) of the graduate program on Animal Health and Production, Faculty of Veterinary Medicine, National Autonomous University of Mexico (approval number SICUAE.MC-2020/2-2).
Study design
A randomized design experiment of 3 treatments (control and two experimental diets) with 3 replicates was conducted. A total of 513 shrimps were randomly assigned to each of the 9 tank groups (replicates) of the three diets (171 shrimp per treatment). Animals on the control diet were fed a commercial feed concentrate (Api-shrimp®, Malta Cleyton). For the other treatments, fishmeal was fully replaced by a mixture of soybean and canola meal (50:50), either unfermented (SC) or fermented (FSC). The formulation of the SC and FSC diets is presented in Table 1.
Table 1 Formulation (g/100 g) of the experimental diets
| Soybean & canola (sc) |
Fermented SC (FSC) |
|
|---|---|---|
| Soybean protein concentrate | 27 | 27 |
| SC meal (50:50) | 46 | — |
| FSC meal (50:50) | — | 46 |
| Fish silage | 5 | 5 |
| L-lysine | 1 | 1 |
| Taurine | 0.16 | 0.16 |
| Fish oil | 8 | 8 |
| Corn starch | 5 | 5 |
| Vitamin/mineral premix | 3 | 3 |
| Carboxi-metil-celulose | 1.5 | 1.50 |
| Celite | 1 | 1 |
| Filler | 2.34 | 2.34 |
| Total | 100 | 100 |
Shrimps
A total of 513 Pacific white shrimps (L. vannamei; mean weight 7 ±0.25 g) supplied by the Unidad Multidisciplinaria de Docencia e Investigación de Sisal, Mexico, were used. The animals were reared in 500 L tanks (57 shrimp each), using a recirculating aquaculture system (RAS) of seawater. The feeding period was 60 days. The daily ratio was 10% of the biomass of each pond, with a periodic adjustment (15 days) according to biometrics. Feeding was provided 3 times a day. During the feeding period, the water was maintained at 28 ± 1 °C and had a salinity of 35.0 ± 0.5 PSU, and a dissolved oxygen of 6.5 ± 1.0 mg/mL. The recirculated seawater was filtered through cartridges with pore diameters of 20 and 5 μm and subjected to UV light treatment. Feces were collected from each tank during the feeding period to test in vivo digestibility.
At the end of the feeding trial (60 d), shrimp recovered from each tank were counted and weighed (Ohaus balance at 0.01 g) to determine growth traits and mortality rate. Subsequently, shrimps were slaughtered by heat shock, and their cephalothoraxes were manually removed. Next, 90 shrimps were randomly selected from each experimental diet. Of these, two-thirds (n = 60) were used to determine quality attributes and the remaining 30 for sensory evaluation. To avoid bias associated with spoilage and endogenous enzyme activity, samples were frozen at -18 °C until analysis (approximately one month). Before analysis, samples were thawed at 2-4 °C for 24 hours.
Feedstuff and diet formulation
Commercial soybean and canola meals were milled to particle size < 500 μm and then fermented using a modified method of Yabaya et al.21 soybean meal (2 kg), 60.5 mg of commercial dry yeast, Saccharomyces cerevisiae, with a cell density of 3x10⁶ cells/g (Fermipan®Magidely®Mexport) and 1.1 L of distilled water (50 % humidity) were homogenized and incubated at 40 °C for 48 h. The yeast-fermented soybean meal was then dried at 70 °C and reground (< 500 μm). The same process was carried out for fermented canola meal. Fish silage was added to the formulation to maintain diet palatability. For that purpose, 10 kg of frozen fish heads cut into small pieces and ground to a homogeneous paste were used. Subsequently, 100 mL of hydrochloric acid (HCI) was added and homogenized manually ensuring good acid contact.22
All diets were isoproteic, with 36 % crude protein (CP). Essential fatty acids (20:5n-3 and 22:6n-3) were added via fish products (silage and fish oil) and carbohydrates were chosen for their digestibility (corn starch).23 The stability of the cold extruded feed (pellet) was ensured by adding carboxymethyl cellulose (CMC) to the formulations. Celite was used as a marker, including for the digestibility test. Chemical analyses of the diets were performed for dry matter (AOAC 934.01), ash (AOAC 942.05), lipids (AOAC 920.39), protein (AOAC 984.13), crude fiber (AOAC 962.09), and nitrogen free extract NFE (Tables 2 and 3). Before starting the experiment, the shrimps were acclimatized to the dietary treatments for 10 d before we started collecting their feces. The control diet consisted of a concentrated commercial feed (Api-shrimp®, Malta Cleyton), with fish meal, krill and squid as the protein source.
Table 2 Chemical composition of the experimental diets
| Variables (% dry matter) | Soybean & canola (SC) |
Fermented SC (FSC) |
Control diet (CD) |
|---|---|---|---|
| Moisture | 2.8 | 3.2 | 3.6 |
| Crude protein | 36.9 | 37.02 | 36.7 |
| Ether extract | 8.4 | 8.7 | 6.4 |
| Ash | 15.1 | 13.1 | 7.2 |
| Crude fiber | 7.9 | 7.2 | 5.01 |
| Nitrogen free extract | 26.7 | 27.8 | 41.3 |
Table 3 Means and standard deviations of apparent digestibility coefficients (ADC) of dry matter, crude protein, and ether extract in L. vannamei fed experimental diets (n = 30)
| ADC (%) | Soybean & canola (SC) |
Fermented SC (FSC) |
Control diet (CD) |
P-value |
|---|---|---|---|---|
| Dry matter | 38.4 ± 4.2 | 40.2 ± 2.2 | 42.6 ± 2.2 | 0.2190 |
| Protein | 83.7 ± 6.2a | 93 ± 0.7b | 94.7 ± 0.4b | < 0.0001 |
| Ether extract | 78 ± 5.8b | 71.2 ± 7.1 b | 56 ± 7.9a | < 0.0001 |
a, b Means with different superscripts in the same row are significantly different (P < 0.05).
In vitro digestibility
The PH-Stat method, which measures the degree of hydrolysis (HD), was used to test the in vitro digestibility of the ingredients, as described by Adler-Nissen.24L. vannamei fed with commercial diet (36 % protein) were slaughtered and dissected to obtain midgut glands, which were frozen in liquid nitrogen (-40 °C) until use. The midgut glands were individually homogenized (IKA T18 basic, ultra-turrax), and centrifuged at 13 300 rpm for 30 min at 4 °C, to obtain an enzymatic extract for the hydrolysis reaction. The degree of hydrolysis was measured in triplicate for the four ingredients. Samples were sieved through a 250 μm mesh and homogenized to 0.966 mg in 5 mL of distilled water and the hd was measured.25 The hd for protein26 used 0.1 N NaOH for 5 min at 28 °C to maintain PH at 8.0 and was determined through the following formula:
Where: B = mL of 0.1 N NaOH used to control PH; Nb = normal NaOH with a calibration factor of 1.5 at PH 8 and 28 °C; M = g of mixture; S = protein concentration (%); 8 = total peptide bond content (meqv g-1) for casein.24 Total protein concentration was measured in a 5 μL sample at 1/10 dilution, mixed with 125 μL of reagent, incubated 5 min at room temperature and read at 595 nm.27
In vivo digestibility
Feces were collected with the aid of siphon samplers from each tank one hour after feeding. Feces were washed with distilled water and dried at 60 °C. In vivo digestibility was measured by the acid insoluble ash method,28 with celite as a marker.29 For nitrogen and ether extract determination, we used an elemental analyzer (Thermo Quest AS 2000 Falsea TM1112) operated with a 10-mg sample of ingredients and muscle. Digestibility calculations were carried out as in the previous case:
Apparent digestibility coefficient of dry matter(DM) =
100 × (1-(%celite in feed/%celite in feces))
Apparent digestibility coefficient of crude protein (CP) =
100 × (1-(% celite in feed / % celite in feces) / (% CP in feed / % CP in feces))
Apparent digestibility coefficient of ether extract (EE) =
100 ×(1-(%celite in feed/%celite in feces)/(%EE in feed/%EE in feces))
Digestive enzyme activity
Midgut glands from intermolt stage C or D0 shrimp were dissected and frozen in liquid nitrogen and stored at -40 °C until analysis. Homogenate was performed individually by adding 500 mL of distilled water (IKA T18 basic homogenizer, ultra-turrax), and then centrifuged at 12 000 rpm for 20 min at 4 °C. Midgut gland-soluble protein concentration was measured with a Bio-Rad-500-0006 kit and read in a spectrophotometer at 595 nm;27 enzyme activities were expressed as specific activity (U/mg protein). The total protease activity was measured following the method of Jiang et al.30 Collagen impregnated with 2.4 % azo dye (Azocoll, Sigma A4341, USA) was used as substrate diluted in 10 mM sodium phosphate buffer, PH 7 at 25 °C, with a 1:10 ratio. The rate of hydrolysis was measured, as an increase in absorbance, using a spectrophotometer (Spectrophotometer Genesys 10s UV, Thermo scientific, USA) at 520 nm at the end point, U/mg protein. The determination of trypsin activity followed Geiger and Fritz31 methodology, while that of chymotrypsin was performed as described by Geiger,32 both with modifications for development on the microplate reader. To determine trypsin activity, 100-mM BAPNA (n-benzoyl-l-arginine-p-nitro-anilide; Sigma B7632) was used as a substrate in 0.1 M TRIS buffer, PH 8 at 40 °C. The rate of hydrolysis was measured, using a spectrophotometer (BioTek Synergy HT Microplate Reader) at 405 nm for 2 min, with an extinction coefficient the ϵ405 = 1.02 L(mol-1) cm-1.32 Chymotryp-sin activity was measured by the same method, but with another substrate, succi-nyl-alanine-2-proline-phenyl-p-nitro-anilide (SAPPNA), and an extinction coefficient of ϵ405 = 1.02 L(mol-1) cm-1.
Shear force (SF)
Shear force was determined using the second abdominal segment of each shrimp. A sample of 24 shrimps from each treatment was frozen in liquid nitrogen (-40 °C) (to stop any further deterioration process by endogenous enzyme activity), until processing. The meat was weighed and placed in transverse position in a Brookfield ct3® texturometer, set at 8 g force, 9.9 mm deformation and 2.5 mm/s speed, with a craft knife (TA-CKA). The results were expressed in newtons (N) as the mean of three replicates.
Determination of instrumental color variables
Shrimp were cooked in boiling water for 4 min and then immersed in cold water (4 °C) for 5 min before the shells were manually removed. Color measurements were performed on the cooked shrimp (three replicates per sample) using a Hunter-Lab® MiniScan EZ-4500L portable spectrophotometer (Hunter Associates Laboratory). The instrument had an aperture size of 25 mm and was adjusted with CIELAB color scale, D65 illuminant, observer at 10° and specular component excluded.
The spectrophotometer was calibrated before measurements and after one hour of operation or 100 readings (whichever came first). In this way, color coordinates (L*, a* and b* values, corresponding to lightness, redness and yellowness, respectively), as well as hue angle (h*) and saturation (C*) were obtained. We also calculated the total color differences
Water holding capacity (WHO)
The WHC of shrimp was determined by centrifugation, following the method of Díaz.33 For this purpose, two shrimp segments of approximately 10 g each were used as replicates. The shrimps were dried with disposable paper towels before weighing and recording the initial weight. It was then centrifuged at 16 000 rpm for 30 min at 4 °C. Subsequently, the supernatant was discarded, and the shrimps were removed from the centrifuge tubes with forceps and dried with disposable paper towels before recording their final weight. The WHC of each sample was calculated as the mean percentage of the initial weight retained, using the following equation:
pH value
The PH of the shrimps was measured with the aid of a PH meter (Starter 3100, OHAUS®). Two replicates of 10 g per sample were homogenized in 20 mL of distilled water at 25 °C for about 30 s, using a commercial blender (4655 classica, Oster®). Subsequently, the probe of the PH meter was introduced into the sample until the PH value stabilized.
Total volatile basic nitrogen (TVB-N)
TVB-N was determined, in 35 shrimps per treatment, as described by Botta et al.34 with some modifications. Briefly, duplicates of 15-g shrimp each, shelled, were mixed with 45 mL of 5 % trichloroacetic acid. This mixture was introduced into a distillation unit (Büchi® K-350 unit) and distilled with a steam flow and 3 % boric acid. The distilled solution was collected and titrated with 0.1 N HCI to neutral. TVB-N was calculated using the following equation:
Sensory evaluation
We used a panel of 30 consumers to conduct the sensory evaluation of cooked shrimp. The shrimps were cooked as described above for color measurements. Two abdominal segments per treatment were served at the same time to the panelists. Samples were assigned random identification numbers before sensory evaluation. The panelists were asked to rate the aroma, flavor, color, texture, and overall acceptability of the shrimp samples. For this purpose, a seven-point hedonic scale was used, ranging from 1 (I dislike it very much) to 7 (I like it very much). Scores > 5 (I like it slightly) were considered positive ratings.
Statistical analysis
The degree of hydrolysis, ADC values, digestive enzyme activity, weight gain, survival data and quality attributes were analyzed by one-way analysis of variance (ANOVA), with the following model:
Yij is the response variable, which is any observation for each i-level of a factor (diet) and the replicate (j) within each i-level,
μ is the mean,
Ti is the effect of treatment i-level (diet), and
ϵj is the random error
When significant differences were observed, means were discriminated using a Tukey HSD multiple range test. To confirm the homogeneity of variance and normality, we used the Levene's and the Shapiro-Wilk tests, respectively. For sensory evaluation, a Chi-Square test was performed to evaluate whether there was an association between dietary protein source and sensory attributes. All statistical analyses were performed using the STATISTICA software package (Dell Software). Differences were considered significant at P < 0.05.
Results and discussion
In vivo and in vitro digestibility
The evaluation of in vitro and in vivo digestibility of feed is an ideal method for determining the nutritional quality of feedstuffs.25 In this study, we observed that fermentation significantly increased (P < 0.05) the HD of soybean and canola meals by 12 % compared to that of their unfermented counterparts (Figure 1). These findings agree with previous research documenting the positive impact of fermentation on shrimp feed digestibility.25 This effect is attributed to the action of s cerevisiae enzymes (i.e., phosphatases and phytases) that reduce antinutritional factors during the fermentation process19, 35 increases the content of free amino acids in the feed36 and rises small peptides (< 15 kDa) through the cleavage of long-chain proteins, making protein hydrolysis more efficient.19
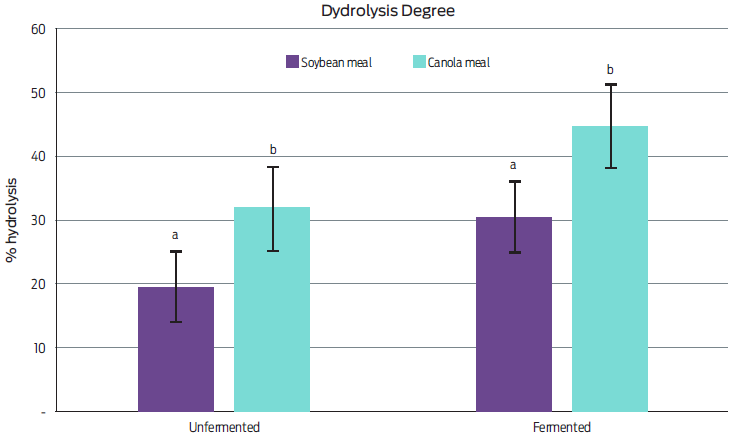
Figure 1 Means and standard deviations of hydrolysis degree of dietary fermented and unfermented soybean and canola meals used in the experiment (n=36). a,b Means with different superscript in the same row are significantly different (P < 0.05).
The study of ingredient digestibility is a relevant prerequisite for evaluating their potential in developing nutritious shrimp feeds.37-39 We found that canola meal had higher in vitro HD compared to soybean meal, both before and after fermentation. Hence, it seems canola meal is more promising as a dietary protein source in shrimp feeding as compared to soybean meal, which is known for its high content of antinutritional factors and low digestibility.14, 40, 41 However, the combination of soybean and canola meal is a good option, due to its content in sulfur amino acids (methionine, cysteine and taurine), which are determinants for the growth and survival of organisms.29
Apparently, the inclusion of vegetable protein sources did not affect the palatability of feed as there was no difference in apparent dry matter digestibility coefficients across treatments (Table 3; P = 0.2190). Moreover, the apparent digestibility coefficient for ether extract was higher in shrimp fed with plant meals, unfermented or not, compared to the control diet. However, the apparent digestibility coefficient for crude protein of shrimps fed unfermented vegetable meals was lower as compared to that of shrimp fed either FSC or CD (P > 0.05). These findings further confirmed the need to ferment plant meals to achieve digestibility coefficients comparable to those of fishmeal. The low apparent digestibility coefficient for crude protein of shrimps fed sc correlated with the low values for trypsin and chymotryp-sin activities observed in shrimp fed this diet. Taken together, our results showed the use of non-fermented soybean and canola meals decreased dietary protein digestibility in shrimp, and thus, are not appropriate for shrimp feeding.
The activity of digestive enzymes is an indicator of the proper functioning of the shrimp digestive system, whose adequate activity favors the absorption of nutrients necessary for growth.42 In this study, the activity of total proteases and chymotrypsin was similar across diets (Table 4). However, trypsin activity was higher in shrimps fed FSC compared to those on the unfermented and control diets. It is possible that this increased activity was related to a reduction of antinutritional factors (phytic acid and trypsin inhibiting factor) and to the prehydrolysis of the soybean and canola meals during fermentation.43 Ayala-Borboa44 mentions that the prehydrolysis of feed releases some metabolites, such as zinc and phosphorus, which are cofactors of trypsin and promote its proteolytic activity. Considering that S. cerevisiae has a complete enzyme package (with several types of lipases, proteases and carbohydrases),16 it was expected that the fermentation of soybean and canola meals would favor the digestive process of the shrimp, increasing the apparent crude protein digestibility coefficients in the organisms fed the diets with fermented vegetable meals, equaling the coefficient of the control diet.
Table 4 Means and standard deviations of total protease, trypsin and chymotrypsin enzyme activities of L. vannamei fed the experimental diets (n = 30)
| Enzyme activity (mU/mg protein) |
Soybean & Canola (SC) |
Fermented SC (FSC) |
Control diet (CD) |
P-value |
|---|---|---|---|---|
| Total proteases | 36.3 ± 5.4 | 33.0 ± 9.1 | 32.6 ± 4.5 | 0.6100 |
| Trypsin | 0.9 ± 1.2a | 3.0 ± 2.5b | 1.8 ± 1.5a | 0.0300 |
| Chymotrypsin | 16.4 ± 6.5 | 20.7 ± 9.7 | 15.9 ± 3.7 | 0.3000 |
a,b Means with different superscripts in the same row are significantly different (P < 0.05).
Summarizing results so far, we observed that the fermentation of the ingredients favored the physiological parameters (in vivo and in vitro digestibility and enzymatic activity) of the shrimp. Since the growth of these organisms is highly dependent on protein metabolism,45 we would expect better production performance traits of the shrimp, as well as a better quality of the final product.
Production performance
Production performance traits of shrimp fed diets with fermented soybean+canola meal as the major protein source was comparable to that of shrimp on a fish meal based commercial concentrate (Table 5). Conversely, unfermented sc caused a drastic increase in mortality. Overall, these findings are consistent with digestibility results and further confirmed that the fermentation of SC is a pre-requisite for its successful inclusion on shrimp diet as the major protein.43, 46, 47 Hence, this study showed it is possible to fully replace fish meal with fermented soybean + canola meal without impairing feed consumption, dietary protein digestibility and animal production performance.
Table 5 Effect of dietary protein source on production performance (mean ± standard deviation) of L. vannamei during the 60-d feeding trial
| Experimental diets | ||||
|---|---|---|---|---|
| Performance traits | Soybean & canola (SC) |
Fermented SC (FSC) |
Control diet (CD) | P-value |
| n | 342 | 342 | 171 | |
| Initial weight (g) | 7.5 ± 0.3 | 7.3 ± 0.2 | 7.3 ± 0.3 | 0.42 |
| Average weight gain (g/week) | 1.1 ± 0.2 | 1.0 ± 0.1 | 0.9 ± 0.1 | 0.32 |
| Final weight (g) | 16.2 ± 1.3ab | 15.6 ± 0.4ab | 14.7 ± 0.4a | 0.02 |
| Survival rate (%) | 75.7 ± 1.4b | 87.1 ± 3.1a | 92.9 ± 3.5a | 0.03 |
a,b Means with different superscripts in the same row are significantly different (P < 0.05). Average weight gain: (final weight- initial weight)/days. Survival rate: (final shrimp number- initial shrimp number)/100.
Shrimp quality traits
The increase in shear force of shrimp fed fermented vegetable protein was accompanied by an increase in WHC by 8-9 % (Table 6). This behavior was expected considering WHC and shear force are positively correlated.48, 49 Still, WHC values observed here are within the range reported in L. vannamei.33, 49 Dietary vegetable protein also increased the TVB-N content of shrimp (over 70 %) as compared to the commercial concentrate. Accumulation of TVB-N in shrimp is attributed to the presence of free amino acids in muscular tissue.50 Perhaps, feeding vegetable proteins induced a higher concentration of free amino acids in shrimp muscle, favoring the formation of TVB-N.29, 51 It is important to note, however, that TVB-N content was well below permissible limits (30 mgN/100 g).52 Hence, this disadvantage should not be relevant, considering shrimp is usually stored and distributed frozen, which inhibits autolytic and microbial enzyme activity on amino acids.53-55
Table 6 Means ± standard errors of shrimp quality attributes across experimental diets and total color differences (ΔEab) among treatments
| Experimental diets | |||||
|---|---|---|---|---|---|
| Quality traits1 | n | Soybean & canola (SC) | Fermented SC (FSC) | Control diet (CD) | P-value |
| Shear force (N) | 24 | 20.9 ± 1.9ab | 23.7 ± 1.0b | 16.2 ± 1.4a | 0.0077 |
| WHC (%) | 30 | 87.9 ± 2.2b | 88.8 ± 3.2b | 79.6 ± 1.8a | 0.0266 |
| PH | 30 | 7.4 ± 0.5 | 7.5 ± 0.1 | 7.5 ± 0.5 | 0.0565 |
| TVB-N (mgN/100 g) | 90 | 16.9 ± 0.3a | 16.7 ± 0.3a | 9.7 ± 0.4b | <0.0001 |
| L* | 30 | 49.6 ± 1.6 | 49.6 ± 1.5 | 49.3 ± 1.6 | 0.8978 |
| a* | 30 | 26.7 ± 3.7a | 27.0 ± 1.3a | 30.7 ± 0.8b | 0.0078 |
| b* | 30 | 24.9 ± 0.5 | 25.0 ± 0.46 | 24.8 ± 0.3 | 0.3764 |
| c* | 30 | 36.6 ± 0.5a | 36.8 ± 0.4a | 39.4 ± 0.8b | 0.0067 |
| h* | 30 | 46.76 ± 0.67a | 47.12 ± 1.56a | 51.12±0.40b | 0.0198 |
| ΔEab | SC vs CD | FSC vs CD | SC vs FSC | ||
| 2.7 | 0.7 | 0.7 | |||
1 WHC: water holding capacity, TVB-N: total volatile basic nitrogen, L*: lightness, a*: redness, b*: yellowness, C*: Chroma, h*: hue. ΔE ab: total color difference between treatments.
a,b Means with different superscripts in the same row are significantly different (P < 0.05).
Cooked shrimp color is another relevant attribute for consumers. 56 Usually, consumers associate the redness of cooked shrimp meat with higher quality.57, 58 Dietary protein source caused some changes in chromatic coordinates (a*), color appearance (h*) and color saturation (c*). In that sense, previous research has suggested that consumers tend to prefer cooked shrimp that is orange to intense orange,59 an appearance that is associated with the range of h* values observed here (close to 50). Therefore, the inclusion of the vegetable protein sources under study in shrimp diets did not cause color impairment in cooked shrimp. This hypothesis was further confirmed by the small total color difference (ΔEab) between shrimp fed FSC and CD, as well as by the rather uniform proportion of positive ratings given by consumer panelists to shrimp fed any experimental diet (Table 7). The panelists did not detect differences in aroma between treatments. These findings agree with a report by Erickson et al.12 showing a trained panel did not detect differences in the aroma of shrimp stored fresh (8 h on glassed ice), refrigerated (5 °C), or frozen (-18 °C). Furthermore, our study showed that the taste of shrimp fed with fermented plant meals and the control diet were similar (five on average). The flavor of shrimp is related its content of glutamate (or glutamic acid), which gives the characteristic flavor to seafood.60 Therefore, we believe that determining the glutamate content of shrimp could helpful to complement the sensory evaluation.
Table 7 Percentage of positive ratings1 (≥5) for aroma, flavor, color, texture, and overall acceptability of shrimp fed different protein sources
| Experimental diets | |||||
|---|---|---|---|---|---|
| Soybean & canola (SC) |
Fermented SC (FSC) |
Control diet (CD) |
X 2 | P-value | |
| n | 30 | 30 | 30 | ||
| Aroma | 80 | 76.6 | 63.3 | 2.1 | 0.34 |
| Color | 73.3 | 83.3 | 63.3 | 3.1 | 0.21 |
| Flavor | 57.1 | 60.7 | 58.6 | 0.1 | 0.95 |
| Texture | 66.6 | 76.6 | 53.3 | 3.6 | 0.16 |
| Overall acceptability | 68.9 | 74.2 | 62.06 | 0.7 | 0.70 |
1 Ratings based on a 7-point hedonic scale (= I dislike it very much through 7 = I like it very much).
Conclusions
Taken together, results indicate it is possible to use fermented soybean + canola meal as the major protein source, in L. vannamei feeding, without compromising production performance, shrimp quality attributes or consumer acceptance. Hence, it represents an opportunity to reduce the dependence on costly animal ingredients, such as fish meal, for shrimp production. Despite quality attributes and consumer acceptance of shrimp fed unfermented soybean + canola meal was comparable to those of shrimp fed the commercial diet, its use as a major protein source is not recommended since it appears to impair productivity.
Data availability
All relevant data of this research are within the paper. The datasets generated and/ or analyzed during this study are available from the corresponding author on reasonable request.
Funding statement
The National Council of Science and Technology (CONACYT: www.conacyt.mx) provided financial support through the master degree fellowship for Rafael Escobar. Unidad Multidisciplinaria de Docencia e Investigación de Sisal, Facultad de Ciencias, UNAM, Puerto de Sisal, Yucatán, México (sisal.unam.mx) provided the research facilities, personnel, animals, feed, and laboratory materials, equipment and reagents to conduct the experiments. The funders had no role in study design, data collection and analysis, decision to publish, or preparation of the manuscript.
Conflicts of interest
The authors have no conflict of interest to declare in regard to this publication.
Author contributions
Conceptualization: MS Rubio Lozano, JC Maldonado Flores, G Gaxiola Cortes, R Escobar-Alvarez.
Data curation: R Escobar-Alvarez, G Gaxiola Cortes, JC Maldonado Flores.
Formal analysis: R Escobar-Alvarez, MS Rubio Lozano, EJ Delgado Suárez.
Funding acquisition: MS Rubio Lozano, JC Maldonado Flores, G Gaxiola Cortes.
Methodology: R Escobar-Alvarez, MS Rubio Lozano, JC Maldonado Flores, G Gaxiola Cortes.
Project administration: MS Rubio Lozano.
Resources: MS Rubio Lozano, JC Maldonado Flores, G Gaxiola Cortes.
Software: R Escobar-Alvarez, EJ Delgado Suárez.
Supervision: MS Rubio Lozano, EJ Delgado Suárez.
Visualization: MS Rubio Lozano, JC Maldonado Flores, G Gaxiola Cortes.
Writing - original draft: R Escobar-Alvarez, MS Rubio Lozano.
Writing - review & editing: EJ Delgado-Suárez, R Escobar-Alvarez, MS Rubio Lozano.

