


 text new page (beta)
 English (pdf)
 Article in xml format
 Article references
 Send this article by e-mail
 Cited by SciELO
  Similars in
SciELO
Similars in
SciELO 
 Permalink
INTRODUCTION
In the last decades, the growth of the transport sector has been slightly inferior to that of the commercial services; however, it has become in one of the pillars of globalization (Kumar & Hoffmann, 2010), which is why the transport services constitute the backbone of merchandise trade (World Trade Organization, 2015). On its behalf, in Mexico, the federal freight transportation is the most used method for the merchandise forwarding: Dirección General de Autotransporte Federal (General Direction of Federal Road Transport; (DGAF, 2018) points out that 56% of goods aremobilized though this method of transportation, provides services to all productive sectors and, therefore, is considered a strategic factor for the economic growth of the country.
In essence, inside the supply chain, motor transport is a crucial strategy for competitiveness, inasmuch as it facilitates the physical flow of merchandise, creating bonds between the shippers and the consignees; ergo it’s found in the margins of supply and distribution constituting a dynamic process of high coordination, guaranteeing on one way the raw material for the production and on the other the shipping of the products to the final customers; for any enterprise, the capability of delivering merchandise on time, at a reasonable price and adequate quality, impacts positively in the customer service level. Under this context the transport must be a quality service in terms of safety, frequency, opportunity, punctuality and efficiency. For this reason, the coordination and planification of the supply must react to the quick changes of demand to keep control over the products´ flows.
In this sense, to know the current situation of motor transport results relevant for the creation of strategies that contribute to the success of the supply chain. Therefore, this study aims to show the economic and labor environment of road freight transport in Mexico, under the premise that the number of employed people in the activity of driving goods transportation vehicles is in function with the production growth of the subsector. First, it is shown how the business structure of road freight transport in Mexico is conformed, later includes the principal macro-economic indexes- referent to the Gross Domestic Product and the labor- and, subsequently, the situation of the labor market of cargo drivers. In this way, it is intended that this study be of utility and provides the basis to understand the sector.
I. THE ECONOMIC GROWTH AND ROAD TRANSPORTATION STUDIES
To measure the economic growth, the Gross Domestic Product (GDP) is employed, which is an indicator that measures the total revenue from all the members of Economy (Mankiw & Espáriz, 2014). Specifically, the GDP is equal to the sum of all the assets and services monetary value produce by a country or region, and it is defined by the Organization for Economic Co-operation and Development (2002) as an “aggregate measure of production equal to the sum of the gross values added of all resident institutional units engaged in production (plus any taxes, and minus any subsidies, on products not included in the value of their outputs). The sum of the final uses of goods and services (all uses except intermediate consumption) measured in purchasers' prices, less the value of imports of goods and services, or the sum of primary incomes distributed by resident producer units” (OECD, 2002).
Nonetheless, the theories about economic growth refer to the increase of the production (Long term GDP) in full employment economies. The growth models can be classified as endogenous and exogenous depending on if the variable that explains the economic growth is explained (endogenous) or not by the model (exogenous). On its behalf, Romero (2014) indicated that the endogenous models are based in focused policies, which have positive effectivity and increase in a long term the production level; like for example the subsidies directed to improving the human capital, the knowledge or technical level. While that, exogenous economic growth models entail that the way to increase the national production of goods and services is in function of the capital, labor and the available technology; and that is necessary to accumulate, through saving and investing, capital goods or fixed capital (such as facilities and machinery) so that these at the given time could allow to increase the quantity in the production levels. Despite the difference between both economic growth models, these agree in considering among the principal productive factors the capital and the labor.
Likewise, to understand how the level of production is determined, the classic basic model of the national income indicates that the productions of goods or services of an enterprise depends on of the quantity of production factors and of its capacity of transforming (Mankiw & Espáriz, 2014); which is why the production factors of higher relevance are capital and labor. Essentially, the capital is confirmed by all the resources that are used to create value and that, for example, for the case of road transportation enterprises the principal mean is formed by vehicles or load trucks; while that, labor is the time which employees assign to do their activities, for example, the assigned to drive the vehicles. Besides, the quantity of production is in function of the existing technology, thus the technological increases generate growth in the production levels. In this sense, the capital and the labor as production factors determine the production of goods and services, and therefore, the national income (Mankiw & Espáriz, 2014). Likewise, the national income flows from the enterprises to households by the payment of the factors and through the production factor markets, while that the revenues are returned to the enterprises by consumption and through the goods and services markets (Mankiw & Espáriz, 2014, p. 105). In this way, in accordance with the classic idea of the income distribution, the prices in the production factor markets adjust to balance the supply and demand.
On its behalf, the neoclassical theory of distribution indicates that the margin productivity of a production factor determines its supply. Furthermore, if the production factors are capital and labor, the prices of these factors are determined by the demand and supply of each factor; which in general terms would be the income obtained by the owners of capital goods and the salary perceived by the workers. Thus, the demand of production factors in a market - as, for example, that of the road freight transportation in Mexico- created by thousands of enterprises that sell its services to market prices, and under the supposition that its production level is small in omparison with its market, hence each enterprise can vary its production level without influencing in the sale price and the worker’s income.
Regarding the employment level (L) it is known that it is in function with the production level f(Q); and the absorption of the employment generated by the production growth is the output elasticity of employment (Ꜫ), which is defined as the relative change ratio of employment amid the relative change of the product (Kato, 2004). This indicator allows to identify the quantity of people that enter to labor in an industry by each percentage point that grows the product in a determined time period.
For the specific case of transportation in Mexico, there are several studies about the structure and economic development, the markets of the transportation sector and the labor markets of drivers. Most have plenty decades, which makes necessary to update data and create prospective analysis which help as a foundation to formulate economic policies. In this way, Camarena (1985) and Islas (1992) analyze in a general way the economic situation of the transportation sector, with specific sections destined to road transportation; however, the used data correspond until few years after the great expansion economic period of the 80s (1979-1980), where the repercussions due to the congestion of the national transportation system are analyzed.
On its behalf, Izquierdo (1995) reunites theorical and analytical material about different transportation markets, broads topics like the deregulation of road transportation in Mexico and North America, and a practical description of the evolution in transportation markets, with emphasis in the economic regulation, and the principal factors that determine the competence conditions that prevail in this industry.
Cruz (2015) analyzes the output elasticity of employment in the workers of the transportation sector in Mexico, specifically the dynamic and structure of the labor sector and the impact of economic growth over the labor demand of drivers of mobile machinery; in her analysis concludes that in Mexico are seven favored entities with the growth of the Economically Active Population.
Additionally, Cruz, Torres, Hernández, Arroyo, and González (2017), from a gender based perspective realize an analysis of the participation of women comparing diverse variables with males, conclude that the growth of the product affects unequally each one of the unitary groups of the workers of the transportation and mobile machinery drivers. Both studies are based on the National Survey of Household Income and Expenses (Encuesta Nacional de Ingresos y Gastos de los Hogares, ENIGH), celebrated in Mexico between the years 1996 and 2014.
Hereinafter, Cruz Ross (2019), in a study of the truck driver’s employment quality, describes the business structure of road transportation in Mexico, indicates that among the implicated agents, are found the principal employers or contractors , such as the Mexican Alliance of Carrier Organization (AMOTAC), the National Association of Private Transportation (ANTP), the National Camera of Road Freight Transportation (CANACAR), and the National Confederation of Mexican Carriers (CONATRAM); while that in the organizations of workers are the Revolutionary Confederation of Workers and Farmers. (CROC), and the Mexican Workers Confederation (CTM).
Besides, she mentions that the seven biggest enterprises, in the road freight transport in Mexico, possess together a fleet of 34,826 vehicles, while that the two inferior levels (enterprises 34 to 100 of the ranking) posses 35,820. With this, the advances in road transportation in Mexico are shown, given that, the size can be associated with the quality in the service and, according to Islas (1992), for 1980, there were only two enterprises with over 500 vehicles (5.2% of the total) in as much as that 60% of the enterprises had as a maximum 30 vehicles (15% of the vehicles). Nonetheless, returning to Cruz Ross, it is important to indicate the potential oligopoly is limited since the official record data of the fleet were of 806,405 trucks registered in 2015.
In sum, there are few studies about economic aspects of road freight transport in Mexico and their importance in the national economy makes necessary to maintain and update in a constant manner the analysis of how road transportation, through capital and labor as production factors determine the production of the service and, hence, its contribution to the national income.
II. MATERIAL AND METHODS
A retrospective analysis of the business structure of the road freight transportation sector was conducted, which is provided by the Dirección General de Autotransporte Federal (General Direction of Federal Road Transport); (DGAF, 2018), and was related with the behavior of the quantity and the proportion of enterprises according to their size in the last twelve year (2007-2018). Likewise, it was examined the number of vehicles in the period between the year 1980 and 2018, which compared the growth trends of the vehicle fleet, before and after the 1989 deregulation: the national behavior respecting the age of the vehicle fleet (2001 to 2018) and the movement which gives service to the actual demand of shipped tons and kilometers traveled nationwide.
Likewise, the statistics of the Gross Domestic Product were used, provided by the Instituto Nacional de Estadística y Geografía (National Institute of Statistics and Geography, INEGI) to distinguish the behavior of the production of the subsector of road freight transport in comparison with the commercial, industrial and total production of the country. This with the purpose of highlighting the importance of road freight transport in the national economy and employment. It was compiled with information from the National Survey of Occupation and Employment (INEGI, 2020a) and statistics from the Instituto Mexicano del Transporte (Mexican Institute of Transportation; (IMT, 2000; 2008, 2015; NATS, 2019b) to describe and compare the salaries of road freight transport, with the economic national activity and of other transportation modes. For this, it is proposed the calculation of the monthly average salary of the different economic activities (Table 3 and Table 4), through the total salary ratio per year of the production personnel, sales and services in millions of pesos (J010A) and the production personnel, total sales and services (H101A), converted to months, from the information of the economic census of the INEGI (2014).
Finally, to analyze the relationship between the demand and supply of the labor market of freight transportation drivers; and, with the analyzed databases, it was calculated the output elasticity of employment in the lustrum comprehended between the year 1990 and 2019, with the intention of identifying the changes in the employment level by each percentage point that the production grows in road freight transportation.
III. ROAD FREIGHT TRANSPORT IN MEXICO
At the end of the 80s external trade was boosted in the country, which is because globalization and trade liberalization pressed for change the regulatory framework of transportation. In this sense, July 6th, 1989 the Federal Government and the representatives of driver groups subscribed the Agreement of Concertation of Actions for the Integral Modernization of the Federal Road Freight Transport. With these actions, it was hoped to increase the level of service, to renovate the vehicle fleet, to reduce the administrative barriers for the simplification of paperwork and the obtention of permits or concessions, the deliverance of routes, the authorization to move any type of merchandise and the freedom of negotiation in the tariff levels.
The deregulation of routs and tariffs created a new adjustment between the supply and demand of the service of road freight transportation; with this, the tariffs were reduced between 20 and 30% reducing as well the profits margins in proportions of 30% for the big enterprises, and up to 50% for small ones (Izquierdo, 1995). Besides, the shipping enterprises (remittent) with big requirements of services and with more transportation options, started to apply its negotiation power, taking like this, the control of the tariffs. On its behalf, the drivers, surrounded in competitive environment, were forced to reduce their operation costs, and offer additional services, like the Global Positioning Systems (GPS) and other logistic services. This paved the way for a new unfair competition in which, for some sectors, drivers offer their services even with tariffs that do not allow to reach the balance point, in a market dominated by micro-enterprises, known as owner-operator, that offer its low-cost services, but with an old vehicle fleet, deprived of preventive maintenance, labor precarity, and no added value to the service (Berrones-Sanz, 2010).
Moreover, 152,487 road freight transport enterprises exist, with 982,856 vehicles dedicated to merchandise shipping; of these, 80,7% are classified as micro- enterprises (owner-operator) y 16.5% as small enterprises that, together, possess 53.2% of the cargo transportation vehicles (DGAF, 2018). The classification of road freight transport enterprises includes four categories; the micro-enterprises, owner- operator, that possess from one to five vehicles, the small, with six to thirty units, the medium, with 31 to 100; and the big enterprises, with over 100 vehicles. Therefore, in the last twelve years (2007-20018), the number of enterprises dedicated to road freight transport has had an Average Annual Growth Rate (AAGR) of 3.39%; where micro-enterprises have grown 3.18% in average per year, and the big enterprises around 5.52% (Figure 1).
Source: Own elaboration based on DGAF (2007-2018).
Figure 1 Historic number of road freight transport enterprises according to the type of enterprise
In this sense, as to the number of enterprises as to the number of vehicles in the road freight transport, had a strong growth in the last decades (Figure 2). Hence, for example, in the period comprehended between the year 1980 and 2018, the number of moral persons in road freight transport increased more than ten times its time (10.87 times), while the number of vehicles increased 6.9 times. Figure 2 shows the growth of the number of vehicles and, for the last decade, the possession in agreement to the business structure. Besides, it can be observed that before the 1989 deregulation, the trend in the number of enterprises was relatively constant (AAGR80-88=0.87%), while that starting from that date the number has been increasing, having its highest growth in the year 1990 (AAGR89-90=35.96%), and 1991 (AAGR90-91=24.19%).
Source: Own elaboration based on DGAF (2007-2018). Tables 1.3.1. and Evolution of federal road freight transport (1980-2018).
Figure 2 Number of vehicles registered in the road freight transport by year and by enterprise type.
Regarding the number of vehicles, 496,057 (50.5%) of the vehicle fleet are drive units and, the rest (486,335;49.5%) are towing units, trailers and semi-trailers. The 90.5% of the drive units use diesel as fuel, 7.65% gasoline, 0.40% gas and 1% gas-gasoline (DGAF, 2018); and its antiquity has an average of 17.05 years, quantity that has increased over the last years. In Figure 3, it’s shown the percentage according to the antiquity in years of the drive units for different annual periods; the year 2001, with an average antiquity of 14.09 years; 2005, with 15.42; 2008, with 14.43; and 2018, with 17.05. Therefore, it can also be observed that the vehicles with over a 15- year antiquity, have increased its proportion, while the newer recent vehicles reduce it.
Source: Own elaboration based on DGAF (2018).
Figure 3 Proportion of vehicles by its antiquity in years
In this way, and under these characteristics, the General Direction of Federal Road Transport (Table 1) estimates the movement of around 556.4 million of tons or 260,642 million of ton-kilometers per year (general and specialized load), for the combination of general cargo transportation and the specialized cargo, with unit trucks of two (C2) and three (C3) axles, and the tractor trucks of two (T2) and three (T3) axles.
Table 1 Total of Transported Tons and Tons-Km by Service Type
| Vehicle type | General Load | Specialized Load | ||||
|---|---|---|---|---|---|---|
| Demand a | Traffic b | Demand a | Traffic b | |||
| C-2 | 29,935 | 5,732,615 | 8,475 | 1,632,885 | ||
| C-3 | 68,740 | 15,368,030 | 5,775 | 1,291,680 | ||
| In combination with T-2 | 3,860 | 1,463,800 | 365 | 138,145 | ||
| In combination with T-3 | 383,761 | 205,320,980 | 55,500 | 29,693,865 | ||
| Total | 486,296 | 227,885,425 | 70,115 | 32,756,575 | ||
aDemand Attended in thousands of tons
bTraffic in thousands of Tons-km
Source: General Direction of Federal Road Transport (DGAF, 2018).
Principal aggregate indicators in the road freight transport (Production and Employment)
The Gross Domestic Product (GDP) in the transport sector, postal service and storage of Mexico recorded between the year 1993 and the year 2018, an average annual growth rate of 2.85%, slightly superior to the 2.34% that the total national GDP recorded (Figure 4). Which is because not to strange that the participation of the sector remained around the 6.13% of the national total, with an annual deviation of only 0.23%. However, in the same period, the trade subsector (wholesale and retail) had a growth of 3.34%, while the manufacturing sector got one AAGR= 2.18%. This growth slightly above the national total, can be interpreted as positively, as negatively. On one hand, it can be a benefit for the transportation service users’ - shippers and passengers- given that it indicates a higher dynamism, supply, and, as a result, competitiveness in the shipping of goods and people; the transportation improves the service through the investment in infrastructure and equipment, adds value to the national production and in general contributes to productivity.
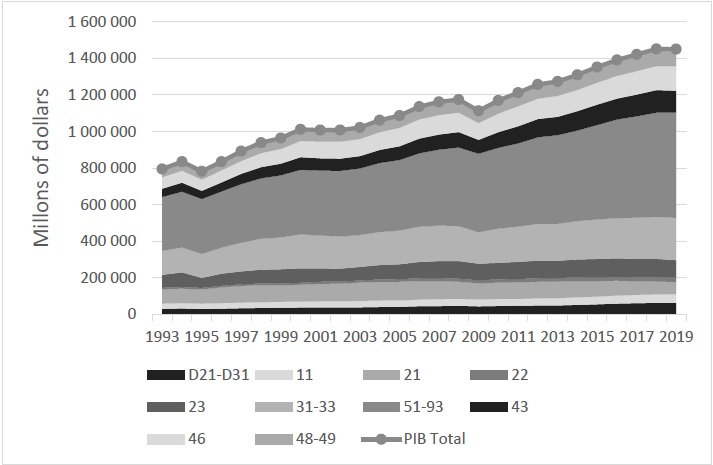
Source: Own elaboration based on INEGI (2020b).
Figure 4 Gross Domestic Product in Mexico Gross Domestic Product in prices of 2013; exchange rate US$1 = 12.7696 Mexican Pesos. The nomenclature is indicated by the INEGI for the different economic factors and the North America Industrial Classifying System 2018. Taxes over Products (D21-D31); Primary Activities (11); Mining (21); Generation, transmission y distribution of electric energy, water and gas supply through ducts to the final consumer (22). Construction (23); Manufacturing Industries (31-33); Other third-party activities (51-93); Wholesale and Retail Commerce (43); Retail commerce (46); Shipping, postal service and storage (48-49).
In the other sense, in which the GDP in the transportation and storage is higher, could mean inefficiency and high costs for the other sectors and, hence, be an obstacle for the development of the country, since the commercialization of products is restricted and creates congestion in transportation systems. Islas (1992) indicates that in Mexico has been evidence of the existence of both situations, even though he concludes that the participation of the transport sector in the GDP is reduced and this does not possess the accelerated rhythm which is normally attributed to it.
Nevertheless, inside the transport sector, postal service and storage stands out the road freight transportations that contributes the 82.98% of the gross added value of the sector (Figure 5). Leaving out the passenger transportation, the cargo transportation represents the 51.43% of the activity, and 3.96% of the GDP nationwide. The participation of road freight transports highly superior, in comparison to the rest ways of transportation; during 2016, in the domestic movement of cargo, 536 million of tons were moved, 83.2% of the national total (IMT, 2017); while that, in foreign trade, the participation was of 711,755 million dollars, 19% of the total commerce (NATS, 2019b).
Source: Own elaboration based on INEGI (2020b).
Figure 5 GDP in the economic activity Transportation, postal service and storage (48-49) for the year 2018 The nomenclature is indicated by the INEGI for the different economic factors and the North America Industrial Classifying System 2018. Air Transportation (481); Railroad Transportation (482); Water Transportation (483); Road freight transport (484); Land passenger transportation, except railroad (485); Transportation by ducts, touristic transportation, transport related services (486-488); Postal service, couriers and messengers (491-492); warehousing and storage (493).
As to the creation of employment, the National Survey of Occupation and Employment (INEGI, 2020a) indicates that the transport sector, postal service, couriers, messengers, warehousing and storage with 2,781,924 workers in the first trimester of 2020, which represent 5.03% of the occupied population of the country. Inside the transportation activity (491-493) the labor force is categorized in eleven groups, described in Figure 6, and it can be observed the hegemony of road freight transport with 88.5% of the total of workers, where road freight transport represents 44.7% of the subsector and 2.73% of the total employment nationwide.

The nomenclature is indicated by the INEGI for the different economic factors and the North America Industrial Classifying System 2018. Air Transportation (481); Railroad Transportation (482); Water Transportation (483); Road freight transport (484); Land passenger transportation, except railroad (485); Transportation by ducts (486); Touristic transportation (487).
Source: Source: Own elaboration based on North American Transportation Statistics (NATS, 2019a).
Figure 6 Employed personnel in the transportation subsector (48)
Likewise, the data obtained from the Mexican Institute of Transportation (IMT, 2000; 2008, 2015; NATS, 2019b) point out that, in the decades between 1993 and 2013 (Figure 7), it was obtained an average annual growth rate of 2.5% in hobs related to road freight transport. The periods where the highest employed personnel growth is concentrated, are between 1995 and 2000, being from 536.08 to 760.37 thousand jobs, which represents an increase of 41.8% in only five years; and between 2003 and 2008, from 744 to 890.6 thousand jobs, representing 19.7 of the increase.
On its behalf, in the same two decades, the national GDP and the transport sector GDP, had an average annual growth rate of 2.38% and 2.82% respectively, quantities very similar to the rate of employments related to the road freight transport (INEGI, 2020b). In Figure 7, it can be observed the behavior of the number of employed people in the road freight transport and its similarity, in increases and decreases, with the national GDP; it is important to highlight that between 2008 and 2013, the average annual growth rate is of 0.31% for the cargo transportation personnel, 0.97% for the road freight transport GDP, and 1.36% for the national GDP.
Nevertheless, the data obtained from the number of employed personnel in the road freight transport have a correlation coefficient of 0.99 with the National GDP and the road freight transport GDP.

Figure 7 Employed road freight transport personnel and the National Gross Domestic Product Gross Domestic Product in prices of 2008; exchange rate US$1 = 11.1438 Mexican Pesos Source: Own elaboration with data of the trimestral Gross Domestic Product; INEGI (2020b) IMT (2000, 2008, 2017).
Table 2 shows the output elasticity of employment in road freight transportation; contrary to Cruz (2015), the data from the ENIGH is not used but that directly obtained from the Gross Domestic Product and the employed personnel in road transportation (Figure 7), and it is shown the information divided in lustrum, which allows to appreciate the changes in the number of people that enter to labor in the road transportation industry in different periods of time and how it relates with the production, and with increases in the elasticity in the growth periods of the sector. It can be observed a negative elasticity during the period that includes the reduction of the production in the year 2009, and values from up to 3.641 during the greatest growth period, remaining in 1.009 in the last lustrum.
Table 2 Outuput elasticity of employment in freight transportation
| Period | LR | GDPR | ∆LR | ∆GDPR | Ꜫi |
|---|---|---|---|---|---|
| 1990-1994 | 590.35 | 21.57 | 0.019 | 0.048 | 2.466 |
| 1995-1999 | 725.18 | 29.53 | 0.062 | 0.086 | 1.373 |
| 2000-2004 | 771.98 | 33.65 | 0.003 | 0.005 | 1.591 |
| 2005-2009 | 868.34 | 33.47 | 0.012 | -0.009 | -0.723 |
| 2010-2014 | 907.42 | 47.45 | 0.012 | 0.043 | 3.641 |
| 2015-2019 | 1099.88 | 56.14 | 0.024 | 0.024 | 1.009 |
LR - Personnel employed in road freight transport in thousands of people of the final year
GDPR - GDP in road freight transportation (484) in thousands of millions of dollars of the final year
∆LR - Employment Growth
∆GDPR - GDP growth in road freight transportation
Ꜫi - Output elasticity of employment in road freight transportation in the period i.
Source: Own elaboration with data of the Gross Domestic Product, INEGI (2020b) IMT (2000, 2008, 2017).
As to the salaries in the transport sector, in Table 3 it can be observed that in the air transportation and aquatic transportation are where the operative personnel are better remunerated, railroads follow behind, and finally the personnel related to road freight transport. Comprehensively, the remuneration is related with the level of school education, the demands of training and, thus, the requirements to access employment.
Table 3 Salaries and personnel in the transport sector
| Economic Activity (branches) | Salaries (millions of pesos) a | Personnel b | Average monthly salary c |
|---|---|---|---|
| National Total | $56,878.02 | 10,269,503 | $461.54 |
| Transportation, postal service, storage (48-49) | $3,921.62 | 449,047 | $727.77 |
| Air Transportation (481) | $459.01 | 16,449 | $2,325.43 |
| Railroad Transportation (482) | $166.03 | 8,741 | $1,582.84 |
| Water Transportation (483) | $166.24 | 5,901 | $2,347.68 |
| Road freight transport (484) | $1,014.44 | 140,061 | $603.57 |
| Land passenger transportation, except railroad (485) | $1,217.41 | 163,688 | $619.78 |
| Touristic Transportation (487) | $20.68 | 4,325 | $398.50 |
| Transportation related services (488) | $460.64 | 61,415 | $625.04 |
a Total of salaries to the production, sales and services personnel in millions of dollars; in prices of 2014, exchange rate US$1 = 13.3032 Mexican Pesos (J010A )
b Total production, sales and services personnel (H101A).
c Calculated from the total salary and personnel.
Source: Own elaboration based on INEGI (2014).
Specifically, for the road freight transport (Table 4), the highest income is for the personnel dedicated to refrigerated foreign motor transport (US$906.42 monthly average), followed by those dedicated to the shipping of hazard materials and the shipping of foreign general cargo. The special requirements- as the federal driving license type “E”, for the transportation of hazardous materials and vehicles with double semi-trailer- and a greater responsibility in the driving or caring of the merchandise are reflected in the income.
In this context, the workers that record the worst income are those related to the local transportation activities that, in general, have less-sized vehicles which are adequate for the geometry of urban areas. These vehicles, are less hard to drive and, consequently, are related with less stress or dissatisfaction levels (Berrones, Cano, Sánchez, & Martínez, 2018a), have less regulatory requirements, do not require a federal license and, besides that the training is lighter and of a less time, the probability of a road accident is lesser (Berrones, Cano, Sánchez, & Martínez, 2018b).
Table 4 Salaries and personnel in cargo transportation
| Economic Activity (branches) | Salaries (millions of pesos) aa | Personnel b | Monthly salary average c |
|---|---|---|---|
| Local general road freight transport (48411) | $479.57 | 6,236 | $481.74 |
| Foreign general road freight transport (48412) | $7,063.02 | 77,399 | $571.63 |
| Relocation Services (48421) | $237.41 | 3,029 | $490.97 |
| Local road freight transport of raw materials for construction (484221) | $578.04 | 7,713 | $469.46 |
| Local road freight transport of materials and hazardous waste (484222) | $181.76 | 2,077 | $548.19 |
| Refrigerated local road freight transport (484223) | $17.15 | 221 | $486.17 |
| Local road freight transport of wood (484224) | $5.59 | 68 | $515.23 |
| Foreign road freight transport of specialized cargo, except moving services (48423) | $4,618.07 | 40,071 | $721.93 |
| Foreign road freight transport of materials and hazardous waste (484232) | $1,648.62 | 14,473 | $713.55 |
| Foreign refrigerated road freight transport (484233) | $903.80 | 6,246 | $906.42 |
a Total of salaries to the production, sales and services personnel in millions of dollars; in prices of 2014; exchange rate US$1 = 13.3032 Mexican Pesos (J010A ).
b Production, sales and total services personnel (H101A)
c Calculated from the total and personal salary.
Source: Source: Own elaboration based on INEGI (2014).
Despite that the road freight transport dedicated to local activities- like the case of raw material transportation for construction, Table 4- present the lowest income (US$469.19), its average is found slightly above the income of the national total (US$461.54) (Table 3). In general, driving activity is undervalued and considered to be of low qualification in the work, which can be comparable with other labor activities, such as working in a factory or other professions. Regarding this, Aguilar Nery (1999) indicates that dedicating to drive vehicles has the advantage of being an activity of self-regulated integration or formal autonomy. Hence, this characteristic makes desirable and attractive to become a professional driver, since it contrasts with other disadvantages which have other activities with a low labor qualification - like the work in factories o the low income in the informal commerce - which is why dedicating to driving vehicles has its reward, inasmuch as for the way as for the conditions and expectations in which it unwinds. (Aguilar Nery, 1999: 138).
Then, some questions arise, if the driving activity has relatively bettered income and is attractive because of its labor autonomy, why has the number of drivers in the road freight transport not risen (AAGR=0.31%) at the same rhythm as the GDP of road freight transport (AAGR=0.097%) and the National GDP (AAGR=1.36%) of the last years (2008-2013). Hence, it is of interest to analyze the market, the work process, and the working conditions of drivers, as variables that contribute to the explanation between the growth differences of these indicators.
The Labor Market of the cargo drivers in Mexico
The deregulation of July 6th in 1989, the adjustment between the supply and demand of road freight transport services, the reduction of its tariffs and the reduction of the profit margin of the motor transport enterprises had for result, a labor reassignment in favor of the big road freight transport enterprises (Dutz, Hayri, & Pablo, 2000). Facing this problematic, the small road freight transport enterprises were the most affected since, to maintain financial stability, had to reduce the utility by accepting tariffs under the balance point; this meant to reduce the employee’s retributions, to increase the professional requirements, to avoid strict preventive maintenance and worsen the working conditions of drivers.
Actually, the great number of drivers creates a high level of competitivity, in which the shipping enterprises, main consumers of the general cargo service, have taken control of the tariffs, which makes the drivers to reduce their operation costs and to offer some additional activities which add value to the merchandise (such as the satellite tracking or some logistic services) to increase the level of service (Berrones-Sanz, 2010). Within the reduction of its operation costs it must be not only considered the costs derived from the performance and usage of the vehicles, but also the related costs with drivers or operators of tractive units, which are an important part of the structure of costs and the service level
Drivers and their influence in the service level are developed in a labor market where road freight transport enterprises complain about a strong level of disqualification of the labor workforce, and each time demand a higher effort from the workers, despite that the salaries are lower each time and that the working conditions are getting worse.
Therefore, it is interesting to describe the economical behavior of road freight transport enterprises and the drivers of tractive units, in its ambit to the realization of transactions or labor employment, where the worker drives the vehicle, and the businessman delivers a remuneration to the worker. In this sense, the labor market of road freight transport drivers refers to the conditions in which the deals, treaties, agreements, negotiations, and commitments of the suppliers and demanders for the conduction of tractive units of road transportation. It is to say that in this part it is not described the market conformed by drivers and businessmen that require the cargo movement, but to, the labor market of road freight transport drivers refers to the conditions in which the employment of human resources for the conduction of tractive units and the labor ambit in which they realize the shipping, loading, unloading and any other way of merchandise maneuvering.
The labor market of road freight transport is made up by the supply and demand. The supply is integrated by enterprises and their job opportunities, the number of jobs offers or workplaces that, in a determined time-lapse, exist for drivers in Mexico. While the demand is constituted by the real and potential candidates for the job opportunities, equating to the total number of drivers who can do the job for the same period. Therefore, to begin with, the road freight transport enterprises have preferences according to the training and qualification degree to the job that the workforce offers and that through which is determined the maximum cost that are willing to pay, in function with the benefits obtained through the quality in the service, the security and punctuality of the drivers.
On its behalf, drivers analyze the minimum cost for which they would be willing to do the labor activities; though generally, this decision is influenced by the need to cover their basic needs and which forces them to take low-paid jobs or with scarce working conditions. However, between the highest cost that the road freight transport enterprise is willing to pay and the lowest for which the driver is willing to work, it is undetermined the real cost of the interchange and it could lead to the benefit of any side and leave both sides happy, despite the unconformities due to low salaries and bad labor conditions.
In this way, in the relationship between the supply and demand of the labor market of road freight transport, three situations can be presented, when the supply is: 1) higher, 2) same, or 3) less than the demand. Chiavenato (2000, p. 203) indicates that, when the supply is higher than demand in the labor market there is a lot of employment opportunity, hence, the criteria for employment are more flexible and less rough, more investment in training is done to compensate the lack of experience, more attractive salary offers are done, to keep the personnel it is tried to boost professional growth plans, there is a strong competition between the organizations that dispute the same personnel, and these become in a scarce resource that deserves special attention. When the supply is the same as the demand it exists a relative balance between the number of job opportunities and the workers willing to fill them. While that, when the supply is less than demand there are more workers than the required by organizations. In this situation, the consequences, as for the organizations as for the workers, are opposite; resulting in more rigorous employment processes, it is less invested in training and it is desired previous knowledge, lower salaries can be offered, workers are substituted by better qualified ones, there is no competition between the enterprises, and human resources become an abundant and easy to obtain resource.
In a particular manner, for the cargo transportation drivers in Mexico, a deficit of 80,000 drivers has been estimated (Baltazar, 2014), which is because the supply is higher than the demand. It is deducted that; this is the consequence due to the differences between the dynamics of the transportation sector growth (with AAGR=0.97%) and of the people that embody to its operation (with AAGR=0.31%). In a principle, it can be inferred that, the potential drivers face troubles that restrict the access to this labor market; some setbacks could be related to the requirements of the training derived of the existence of more sophisticated vehicles, and the demands derived from the polyvalence in the labor and new logistic models imposed by the competitiveness in the supply chains.
Besides, driver scarcity, is not a phenomenon found only in Mexico. The United States also have an employment oversupply for drivers. Which is why the qualified workers are hired by the neighbor country’s companies (Juárez, 2014); hence, working in foreign territory, leads beneficial for Mexican drivers who obtain higher income, better work conditions, with more modern and comfortable vehicles, and in a safer traffic environment.
Faced with this context, as Chiavenato (2000) indicates, it can be observed the consequences of the excess of vacancies and job opportunities in the labor market. In a particular manner for the road freight transport, it can be deducted that the driver scarcity promotes that enterprises have a high personnel rotation and, resulting, in a constant vacant disposition; drivers do not hesitate in taking the risk of leaving their organizations, to look for a salary or working conditions betterment; and, since the drivers feel in control of the situation, tied to the rotation flexibility, makes them undisciplined and with irresponsible attitudes, such as impunctuality or absenteeism.
CONCLUSIONS
The economic dynamism of the road freight transport subsector in Mexico, the oversupply of employment for the driving activity, the lack of employment that is generalized in the country, and the income that, in general terms, are higher than to the average of workers, oppose to the scarcity of road freight transport drivers. In this sense, it is essential to review the work process and the context of drivers.
Specifically, in Mexico, the activity is considered the second highest as to risks associated to a profession is concerned (Berrones et al., 2018b); hence, it is relevant to know the personal and environmental variables which influence in the accidents, the disabilities and deaths of professional drivers, in such way that the risk factors could be fought.
Besides, it is necessary to improve the labor conditions, given that despite that the road freight transport drivers have an income superior to other activities, the scarcity prevails. Evidently, the drivers’ salary cannot be increased, given that the market is regulated by external factors such as the prices of products and the control of the supply chains. Inasmuch, it can be inferred that the poor working conditions and long working hours of drivers, in many times, are responsible that the goods do not arrive on time and shape to the destination, and these impact directly over the supply chains’ performance, from where it is important to focus the attention in the solution of this problematic for the benefit of the drivers, society, and the economy of the country.
Improving the working conditions of drivers will contribute to two fundamental aspects: 1) the reduction of road accidents and 2) improve the competitiveness of the sector. In regard to the first point, besides that professional drivers are a work group whose activity has a strong impact in public health (Berrones et al., 2018b), the disabilities and fatalities withhold a familiar and personal tragedy intrinsically, which generates externalities for the enterprises and the relatives, in terms of memorial services, hospitalization or rehabilitation. Although the greatest part is paid by insurance, the material damages create arrests in the productivity activities - for example the days of repair or substitution of the vehicles- which causes capital expenses. In this way, reducing the number of accidents it is not only useful to reducing externalities, but also for not wasting the enterprise’s productivity.
The actions that can be followed to reduce the accidents can be divided in the related to: 1) the regulation, such as driving hour limit restrictions, gross vehicle weight limitation, physical mechanical checkups; 2) the training, in regulation concerns, safe driving and defensive driving; and 3) awareness and constant betterment inside the organizational environment, such is the case of campaigns to improve working conditions, and the implementation of quality management systems like the ISO39001
Regarding the improvements in the competitiveness of the sector, in addition to reducing risks, through knowing the characteristics and variables that increase the risk to drivers, both in terms of road safety and patrimonial security; the effect of improving the working conditions of drivers in the supply chain must be studied, under the premise that it is an investment and not a cost, given that positive changes would allow to reduce the scarcity, while the level of service is improved as well. Improving the labor conditions of drivers is a moral obligation of the businessmen, but that, simultaneously, will bring improvements in the service level, and therefore, in competitiveness.
Undoubtedly, road transportation is the main method of transportation in Mexico; besides it generates 2.73% of the employment nationwide, through it are moved 83.2% of the national total tonnage of the domestic cargo movement and 19% of the values in international trade. However, the business structure of road freight transport is dominated by the micro and small enterprises, which in whole result in the 97.2% of the total enterprises. These enterprises have the characteristic of offering low tariffs, many times even below their operation costs, in exchange for a series of externalities which keep the vehicle fleet with a 15-year-old average antiquity. In this sense, it turns relevant to know the costs of road freight transport. It is proposed a study that allows to evaluate the structure of costs and success of operations between different company types, including the externalities they generate, in such way that proposals to improve transportation, and therefore, its competitiveness.
Regarding the scarcity of drivers it can be observed that (Figure 7), in the face of the national GDP deceleration and the road transportation GDP, the gap is reducing, in contrast with the period comprehended between the year 2010 and 2014, where the elasticity of employment was of 3.64, in the period from 2015 to 2019 was of only 1.009 (Table 2), it is to say that today for each percentage point that the product grows, the number of people that enter to labor in the industry is fewer than in the last period; in fact, at the end of the last lustrum, practically the relationship is of one by one, it is to say that before a 1% product growth, the number of employees grows 1.009%
Despite this, if we take the historical series of numbers of personnel and the production in road freight transportation, and it is taken in consideration the reduction of the production during the year 2020 (-6% according to Bnamericas, 2020), the forecast of the output elasticity of employment between 2019 and 2020 is calculated in 0.94. This indicates that, despite the population reduction, there will not be reduction in the number of drivers in road freight transportation, like in the year 1995 or the year 2009. Thus, it is possible that during the economic recession of the year 2020, the scarcity of drivers prevents the amount of employed workers in road freight transportation from decreasing and, hence, the scarcity problem is resolved, giving opportunity to create strategies, for example the training and professionalization of drivers, so that the number of drivers grows at the same pace of the sector.
Herein, it is proposed to keep track of the records of salaries of the transportation sector (Table 3) and road freight transportation sector (Table 4), given that the same reduction in the elasticity of employment, will generate certain stability in the salary of the personnel for road transportation. Nonetheless, it is possible that the same economic environment provokes that the salaries in road transportation, in comparison with the national total and the rest of activities in the transportation sector (branches 48-49), has a relative growth of higher proportion, or at least does not reduce in comparison with the other activities that demand a higher certification in the job. While that, for the different classifications of road freight transportation (Table 4), the growth of salaries will be relatively similar, keeping the lowest incomes for urban transportation, and increasing according to the demands of the work process reflected in the specialization for the operation of certain goods and the labor journeys imposed by long road trips.

