


 text new page (beta)
 English (pdf)
 Article in xml format
 Article references
 Send this article by e-mail
 Cited by SciELO
  Similars in
SciELO
Similars in
SciELO 
 Permalink
Introduction
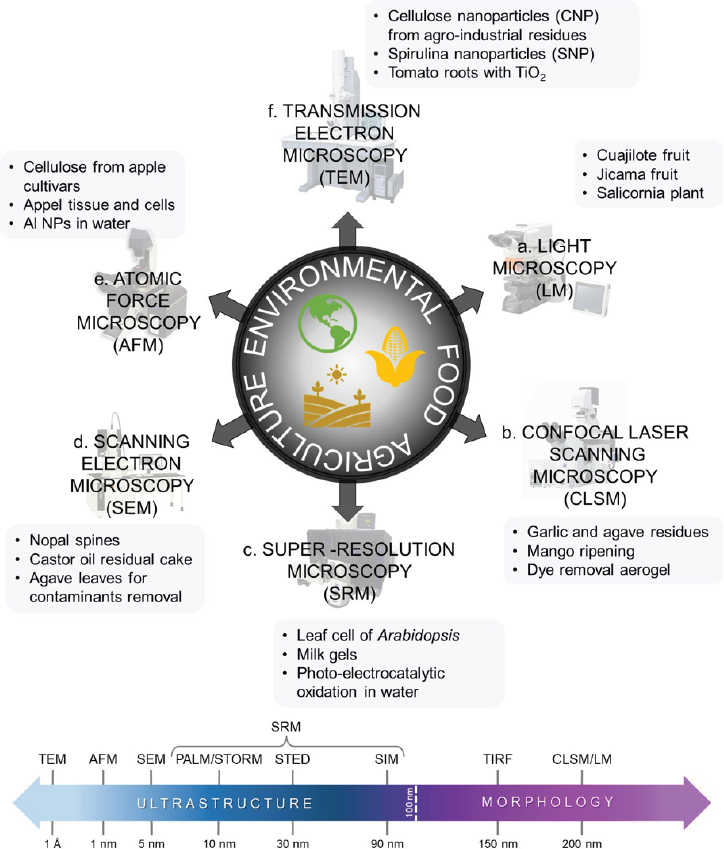
Microscopy has been used as an essential tool in characterizing the general properties of samples based on the image formation related to the source interaction and the samples (Hawkes & Spence, 2019). After light microscopy (LM), technological advances in microscopy have improved their analytical capabilities and helped to develop other innovative characterization techniques (Verma et al., 2018). These improvements have made it possible to analyze the composition and behavior of several samples in great detail and the obtention of nanometric resolutions and high-quality images (Figure 1). Historically, the term “resolution” has been defined by Ernst Abbe (1873) and Lord Rayleigh (1896) as the power of a microscope system to discriminate two objects with a certain level of distinction (Cremer & Masters, 2013). This definition of resolution allows the scientific community to resolve problems depending on the microscope used and also based on the sample studied. For example, confocal laser scanning microscopy (CLSM) and superresolution microscopy (SRM) use the availability of fluorescent molecules in a sample to form images from hundreds of micrometers or a few nanometers in the case of SRM (Hernández-Varela et al., 2021a; Pujals et al., 2019). However, other techniques in addition to light microscopy have facilitated the study of samples in a straightforward manner, including transmission electron microscopy (TEM) and scanning electron microscopy (SEM). The latter involves electron beams interacting with the sample’s surface to obtain high-resolution images, through interference or incoherent scattering phenomena (Goldstein et al., 2018; Verma et al., 2018; Williams & Carter, 2009). Similarly, atomic force microscopy (AFM) is an approach in which a cantilever is used to perform scanning with a possibility of a wide range of techniques. This method can be performed with the same microscope, with only the operation principle varying, producing atomic resolutions and nanomechanical properties (Cárdenas-Pérez et al., 2016). Although these microscopic techniques have been extensively used in biological and inorganic materials, their potential applications in agriculture, food, and environmental technology have not been widely studied yet (Figure 1). Meanwhile, these techniques have presented different resolutions (see resolution scale in Figure 1) which can be implemented depending on the objectives in the investigation. Firstly, for a more detailed study of the ultrastructure below 100 nm and secondly, for a more general observation of the samples’ morphology above 100 nm. However, our research group has studied a wide range of techniques and the samples are explained below. For LM (Figure 1a), some examples include fruits such as cuajilote (Vicente-Flores et al., 2020) and jícama (González-Lemus et al., 2018) for agricultural and food fields, respectively. Furthermore, plants such as Salicornia (Cárdenas-Pérez et al., 2020) were used in the solution of environmental problems related to salinity soils. Moreover, CLSM (Figure 1b) shows some interesting examples based on the study of agro-industrial residues of garlic and agave (Hernández-Varela et al., 2021a), some mango ripening processes (Cárdenas-Pérez et al., 2018), and studies on dye removal from aerogels based on cellulose nanoparticles (Hernández-Varela et al., 2022). Since SRM presents a revolution in the study of samples in the nanometric scale using fluorescent techniques, some examples (Figure 1c) could be found in the study of RNA polymerase II in plant nuclei (Schubert & Weisshart, 2015), the spatial correlation of fat and protein in milk gels (Glover et al., 2019), as well as a non-fluorescent surface reaction that follows single photo-electrocatalysis in water decontamination (Mao et al., 2019). Furthermore, electron microscopies such as SEM and TEM (Figures 1d and 1f, respectively) are the most common techniques used in agriculture, food, and environmental fields, offering a higher number of examples in these research items. For example, structural characterization of nopal spines by SEM (Marin-Bustamante et al., 2018) and analysis of cellulose nanoparticles (CNP) from agricultural wastes by TEM were found for agricultural research. In other investigations for food analysis by SEM and TEM, the study of cellulosic components of castor oil residual cake (López-Ordaz et al., 2019) and the analysis of the size and lattice spacing of Spirulina nanoparticles (Neri-Torres et al., 2016), were also carried out. Finally, a study of agave leaves for removing contaminants by SEM (Hernández-Botello et al., 2020) and the analysis of TiO2 nanoparticles in tomato roots by TEM (Álvarez et al., 2021) were also published in the environmental field. Recently, an extensive study of samples through AFM (Figure 1e) reveals noteworthy results in biopolymers (cellulose) presented in four different apple cultivars (Rojas-Candelas et al., 2021), changes in the mechanical properties of tissue and isolated cells from apples (Cárdenas-Pérez et al., 2016), and aluminum nanoparticles (Al NPs) after bioaccumulation in common carp (García-Medina et al., 2022).
Source: Author’s elaboration.
Figure 1 Schematic representation of the microscopy techniques that contribute to the characterization of materials in agriculture, food, and environment fields. A resolution scale in which techniques are the group for ultrastructure (TEM, AFM, SRM) and morphology (TIRF, CLSM, LM) is presented.
For this reason, the fundamental basis of microscopic techniques (LM, CLSM, SRM, SEM, AFM; TEM) used in agricultural, food, and environmental research fields and some examples of interest materials in each one are explained in this review. A brief summary of instrumental configuration and techniques performed for each microscope, advances, and experimental examples are provided to describe the fundamental conditions for obtaining and describing appropriate image interpretation for further analysis in scientific materials for agricultural, food, and environmental studies.
Operating principles and studies on microscopy techniques in agricultural, food, and environmental areas
Light microscopy
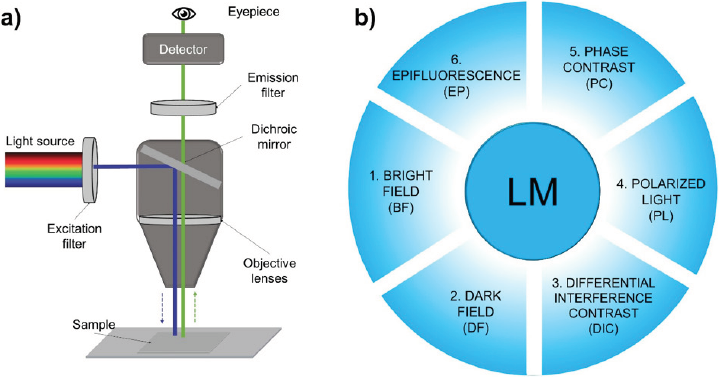
Light microscopy (LM) is a technique that uses visible light to detect and magnify very small objects and enlarge them. It uses lenses to focus the light on the sample, magnifying it and thus producing an image. The sample is usually placed close to the objective lens of the microscope. The lateral resolution in an ideal optical microscope is limited to about 200 nm, while the axial resolution is about 500 nm. The magnification of the microscope varies according to the type and number of lenses that comprise the microscope. An example of this is shown in Figure 2a, corresponding to an epifluorescence light microscope, a technique that will be explained in detail further on in this paper. There are two types of microscopes depending on the number of lenses: the simple optical microscope (low magnification, has a single lens) and the compound optical microscope (higher magnification, has at least two sets of lenses, an objective lens, and an eyepiece). The lenses are aligned so that they can deflect light to achieve effective image magnification (Huszka & Gijs, 2019). The operation of the optical microscope is based on its ability to focus a beam of light through a sample (very small and transparent) to produce an image. The image is then passed through one or two lenses to magnify it for viewing. The transparency of the sample allows easy and rapid penetration of light (Friedrich, 2003; Hawkes & Spence, 2019).
Source: Author’s elaboration.
Figure 2 Schematic representation of (a) the paths followed by a beam of light from an epifluorescence microscope and (b) common techniques used in light microscopy (LM): bright field (BF), dark field (DF), differential interference contrast (DIC), polarized light (PL), phase contrast (PC) and epifluorescence (EP).
The use of certain elements placed in the condenser and/or objectives, which interpose themselves to the light beam filtering or obstructing it, gives rise to the different types of optical microscopy. This type of device practically manipulates the light beam in a physical way, selecting part of the waves of which the beam is composed, thereby causing a contrasted image to have a clearer and more detailed interpretation depending on the sample (Herman & Lemasters, 1992). Therefore, it is possible to define the following types of optical microscopy which are shown schematically in Figure 2b. In bright field (BF), a daylight filter (blue color) is used which simply modifies the color temperature of the illumination coming from a conventional lamp making it cooler (blue) and thus more natural and less disconcerting to the eye (Figure 2b1) (Lacey, 1999; Lawlor, 2019). In dark field (DF), an opaque device is interposed between the light beam and the sample, allowing only the peripheral rays to pass through, and the objective receives the rays scattered by the sample. This technique shows an image with very sharp boundaries on a dark background, and is very useful for samples that cannot be stained as well as live preparations (Figure 2b2) (Hayden, 2002; Lawlor, 2019). Differential interference contrast (DIC) uses polarizing filters and prisms that produce images with three-dimensionality, although the relief obtained is not real as the passage of light through the prisms produces birefringence. In addition, the polarization of the light produces a higher image acuity at the edges of the sample. This type of microscopy helps to discern surface details and internal structures (Davidson & Abramowitz, 2002; Lacey, 1999). In addition, the use of prisms allows bright-colored images to be obtained without the need for staining protocols or sample preparation (Figure 2b3). Polarized light (PL) uses two polarizers or filters, one between the condenser and the sample and the other between the sample and the observer to let only the light waves that are vibrating in a specific plane to pass through to analyze the samples’ optical properties. This light produces light or darkness in the microscope field (Figure 2b4) (Davidson & Abramowitz, 2002; Herman & Lemasters, 1992). Phase contrast (PC) is used when the internal structures of the samples and the surrounding medium have different refractive indices.
Part of the light beam is selected, which affects both the beam before passing through the sample and the beams that have already passed through the sample. Therefore, a condenser and a phase objective are used to display a gray background where the sample is highly contrasted and the interior with different shades of gray (Bradbury & Evennett, 2019; Davidson & Abramowitz, 2002). This approach is useful for samples that cannot be stained, in vivo samples, or samples that have a lot of detail (Figure 2b5). In epifluorescence (EP), fluorescence (the ability of some samples to emit light at a certain wavelength, either naturally or induced) is exploited by using filters to control the wavelength of light emitted by a given sample (Figure 2a). Generally, the sample is treated with fluorescent markers or fluorochromes (substances capable of emitting light at a certain wavelength), so that the type of fluorescence to be observed can be controlled and related to the marked structure (Figure 2b6) (Chiarini-Garcia & Melo, 2011; Mondal & Diaspro, 2014).
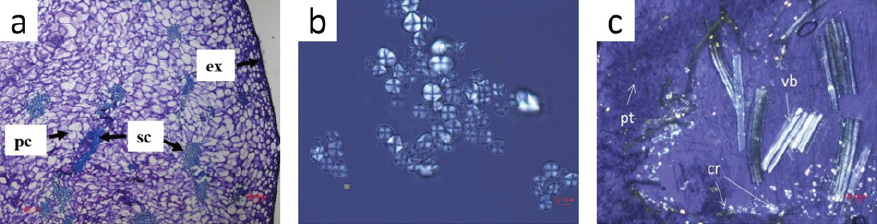
Within the fields of agriculture, food, and environment, LM has been very useful for studying microstructure biological materials. For example, Vicente-Flores et al. (2020) performed a study of cuajilote (Parmentiera edulis D.C.) fruits collected from trees in unripen and ripe stages. The exocarp, mesocarp and endocarp regions were histologically sectioned transversely and longitudinally and then stained with specific dyes to study the content of polysaccharides and lignocellulosic components where (ex) is exocarp, (sc) are sclerenchyma fibers, and (pc) parenchymal cells. As a result, the structure of the cuajilote samples was differentiated by shape and size using image analysis at different maturity stages as shown in Figure 3a. In this way, it is possible to have a selection criterion of fruits according to their maturity stage, in which cellulose or lignin can be extracted with greater benefits from their fibers for future uses.
Source: a): Adapted from (Vicente-Flores et al., 2020); b): adapted from (González-Lemus et al., 2018); c): adapted from (Cárdenas-Pérez et al., 2020).
Figure 3 Light microscopy (LM) images of (a) Cross-section of cuajilote (Parmentiera edulis) fruit in ripe stage where (ex) is exocarp, (sc) are sclerenchyma fibers, and (pc) parenchymal cells. (b) Frozen jícama (P. erosus) starch sonicated at 90 min, viewed with a polarized light filter. (c) Salicornia bigelovii stems where polarized light evidenced the abundance of (cr) NaCl crystals, (pt) are palisade tissue and (vb) are vascular bundles.
In another food study carried out by González-Lemus et al. (2018), it was possible to observe starch from the frozen roots of jícama (P. erosus). Samples were placed on a slide, and a drop of 50% glycerol solution was added. Different zones on the slide were observed with polarized light to analyze the crystalline structure and morphology of the starch granule, where the appearance was not modified after different sonication exposure time. For example, Figure 3b shows sonication at 90 min.
In another study, Cárdenas-Pérez et al. (2020) studied the microstructure of the stems of Salicornia bigelovii plants under saline stress conditions, demonstrating the plant’s capacity to tolerate high concentrations of NaCl. Samples were cut into thin slices with a blade, fixed in a cryostat, and visualized in an Eclipse Ti-U microscope (Nikon, Japan), where not only structural details were observed. However, through the use of polarized light, it was evident that there was an abundance of (cr) NaCl crystals along with (pt) palisade tissue and (vb) vascular bundles (Figure 3c). Therefore, these examples confirm that with the use of microscopy and its different forms of illumination, it is possible to see and locate important areas without the need for specialized microscopes, thereby facilitating biological analyses.
Confocal laser scanning microscopy
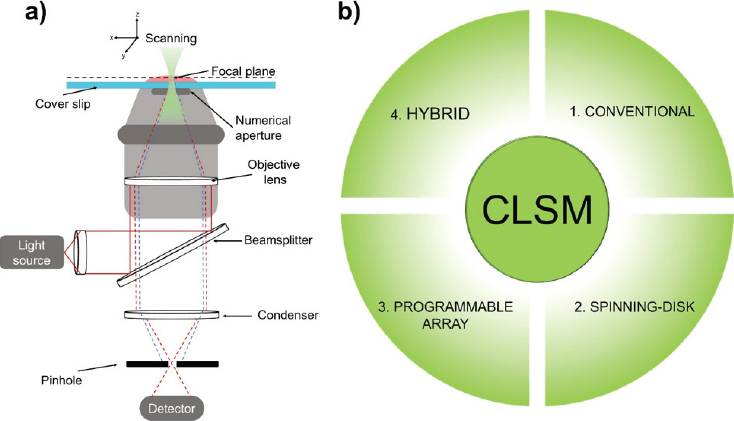
As an improvement in conventional microscopic techniques, confocal laser scanning microscopy (CLSM) has emerged as a technique for resolving the structure of many samples through the internalization of fluorescent molecules (Olivier & Moine, 2013). CLSM microscopy (Figure 4a) is a technique that conjugates focal planes of specimens between objective lens and detectors to sample visualization. The main feature of a CLSM microscope is the use of an aperture diaphragm or pinhole that limits the photon collection from different focal planes, allowing optical sectioning to occur. In conventional CLSM samples are scanned using a point of light or excitation laser that moves around the x and y coordinates of the specimen in short pattern distances through its modulation, once it has passed through the specimen and pinhole (Abdel-Hafez et al., 2018). Signals are registered by a photoelectric cell that amplify the current which allows for the beam intensity to be regulated through a long persistence cathode ray and tuning forks. The contrast produced between the sample and its background facilitates the creation of a focal plane, thereby producing the required image (Mikami et al., 2018). In the case of conventional CLSM (Figure 4b1), samples are scanned in the x, y, and z axes which leads to the construction of a 3D image. The visualization of internal fluorophores is used to label specific analytes in the sample by carrying out different depth measurements (Hawkes & Spence, 2019), obtaining resolutions near 200 nm laterally and 500 nm axially. These resolutions are related to the dye configuration, sample, as well as the spherical aberrations that may occur for the refractive index mismatches.
Source: Author’s elaboration.
Figure 4 (a) Schematic description of the functioning of a confocal laser scanning microscope (CLSM) showing its basic configuration, which includes a light source, a beam-splitter, objective lenses, and a pinhole. (b) Complementary techniques on CLSM include conventional, spinning-disk, programmable array, and hybrid configurations.
Moreover, CLSM has the potential to obtain internal and surface images in conventional mode, through establishing specific experimental excitation lines and bandpass filters, hybrid techniques can be reached which are related to the microscope configuration (Jonkman et al., 2020; Splinter, 2010). For example, Figure 4b shows some of the confocal microscope configurations, including a dual-spinning disk confocal additament (Figure 4b2), that interchanges bandpass filters and many pinholes that synchronize with the electron multiplication cameras (EMCCD) automatically. This technique can be employed to capture data rapidly reducing the photodamage in samples (Hawkes & Spence, 2019; Splinter, 2010). Furthermore, hybrid dual systems have been developed to enhance the capabilities of CLSM (Figure 4b3). For example, a CLSM module attached to a superresolution module can acquire images taking advantage of both systems, in which images can be resolved with better resolution. In addition, with the use of a programmable array system (Figure 4b4), a digital micromirror can act as a Nipkov disk to change the pinhole size and separation and to control the light intensity on a mirror that can simultaneously illuminate many discrete points at high-speed. Laser light passes through the pinholes and illuminates the whole specimen simultaneously (Klar et al., 2000).
As an experimental example using CLSM in the agricultural field (Hernández-Varela et al., 2021a) studied garlic and agave wastes which were subjected to different extractive processes to obtain crystalline cellulose, including alkali and a bleaching process. In this study, lignocellulosic samples (Figure 5a) were labeled with calcofluor white (blue) and then visualized in the CLSM using the autofluorescence of lignin (green). Results show that CLSM is capable of observing the morphology of samples during the cellulose extractive process. Information relating to the identification of components such as calcium oxalate crystals were obtained due to the contrast of the fluorescence, which assisted with the undertaking of appropriate staining, fiber measurements, and process differentiation.
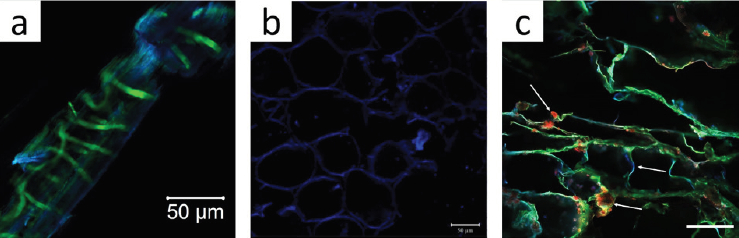
Source: Adapted from: a): (Hernández-Varela et al., 2021a); b): adapted from (Cárdenas-Pérez et al., 2018); c): adapted from (Hernández-Varela et al., 2022). Scale bar 200 mm.
Figure 5 Confocal laser scanning microscopy (CLSM) images of a) garlic skin in cellulose alkali extraction and bleaching process, lignin content appears in green and cellulose in blue. b) CLSM image of Tommy Atkins mango cellulose during the ripening process. c) Structural distribution of chitosan (green), alginate (red), and nanocellulose (blue), in aerogel to dye removal.
With the confocal microscope’s numerous applications, its use in food science presents an opportunity to study the structural interaction of fruits during maturation processes. One example is a study by (Cárdenas-Pérez et al., 2018) which, through the use of CLSM images, analyzed the structural changes of pectin and cellulose along the ripening process in mango slices (Figure 5b). The microscopic capacities can observe the changes in isodiametric cells, and in this study, samples were stained with calcofluor for its selective interaction with mango cellulose. This visualization leads to the conclusion that the presence of hemicellulose acts as support material for the first day up until day 8 where the CLSM images showed amorphous structures due to the increase of soluble pectin’s that generate agglomerates. As a result, an increase in the fluorescence of CLSM images was registered.
Finally, in environmental science, the removal of pollutants in water effluents is studied with the creation of aerogels based on biopolymers. The fabrication and characterization through CLSM of an aerogel based on crystalline cellulose, alginate, and chitosan were made by (Hernández-Varela et al., 2022). This investigation shows that the composition of the aerogel, and in particular the content of cellulose and chitosan, explain the structure and mechanical properties of the aerogel. The hierarchical structure and the distribution of the aerogel’s components were observed by a selective labeling strategy and visualization in the CLSM images using conventional dyes (Figure 5c). In the study concerned, fluorescein 5-isothiocyanate (FITC) was used for selective recognition of chitosan (green), calcofluor white to stain cellulose (blue), and alginate (red) dye with rhodamine B. The use of CLSM makes it possible to observe the distribution of the structural biopolymers in the aerogel matrix, and this approach can be considered versatile and useful for structural analysis in environmental science.
Superresolution microscopy
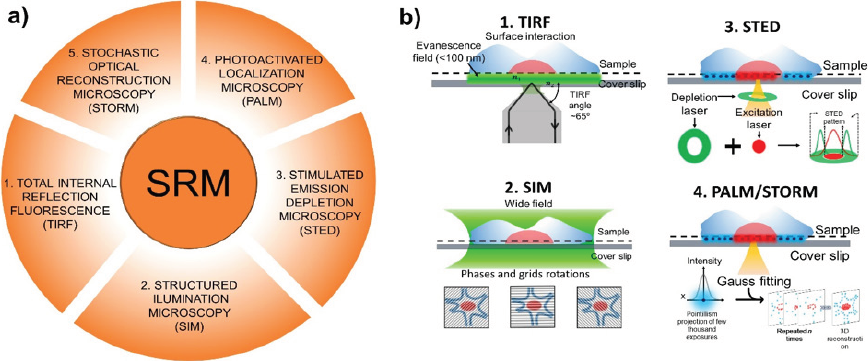
In the last few years, superresolution microscopy (SRM) has emerged as a technique that improves the resolution of fluorescence-based microscopes such as the confocal type. These techniques, shown in Figure 6a, include a complementary technique in the SRM known as total internal reflection fluorescence microscopy (TIRF) (Kudalkar et al., 2016), and the SRM techniques such as structured illumination microscopy (SIM) (Villegas-Hernández et al., 2020), photo-activated localization microscopy (PALM) (Manley et al., 2008), stochastic optical reconstruction microscopy (STORM) (Coltharp & Xiao, 2012), and stimulated emission depletion microscopy (STED) (Kozma & Kele, 2019) that breaks the Abbe’s diffraction limit (<200 nm), allowing the resolved images to surpass the resolution limit imposed by Abbe’s diffraction Law. These innovative techniques present resolutions related to their configuration and operating mode, and in the case of TIRF microscopy, the resolution reached is between 100 and 150 nm. This resolution is dependent of the light incident angle and the evanescent wave that is created through the different refractive indexes of samples (Oheim et al., 2019). On the other hand, the resolution of the SRM techniques (SIM, STED, PALM/ STORM) is dependent on the fluorescent molecules that are used for the specific label. For example, PALM and STORM use photoactivable and photoconvertible fluorochromes that are in the range of 20 to 40 nm in size, providing 104-106 photons per localization, meaning that resolutions of 10 nm are possible. Furthermore, the number of frames detected improves image resolution for the image reconstruction (Dempsey et al., 2011; Vaughan et al., 2012). Finally, STED obtains resolutions of < 50 nm, as this technique uses a pulsed and continuous-wave laser illumination to create a convolution operation to improve the resolution by a factor of 3 (Dumbović et al., 2021; Hein et al., 2008).
Source: Author’s elaboration.
Figure 6 a) Common techniques used in the superresolution microscopy (SRM): total internal reflection fluorescence microscopy (TIRF), structured illumination microscopy (SIM), stimulated emission depletion microscopy (STED), photo-activated localization microscopy (PALM), stochastic optical reconstruction microscopy (STORM). b) Basis of the operation of the SRM techniques: (b1) TIRF is based on the surface interaction of the light source with the sample to create an evanescence wave. (b2) SIM is based on the grid pattern rotations to fit excessive fluorescence, (b3) STED uses an excitation and a depletion laser to reduce the fluorescence of a fluorescence spot, and (b4) PALM/STORM is based on the pointillism detection of fluorophores with on/off behavior for image reconstruction.
Figure 6b shows the super-resolution microscopy techniques fundaments, in which Figure 6b1 refers to the total internal reflection microscopy (TIRF). It is well known that this technique takes advantage of epi-illumination and the deviation angle of the laser (TIRF angle) to create an evanescent wave and different refraction indexes. Superficial analyses can be undertaken to reduce the damage in samples (Oheim et al., 2019), reaching high magnification texture details that are not visible in CLSM. One example is an investigation by (Hernández-Varela et al., 2021b) that compares the cellular details in garlic cells obtained in CLSM and TIRF microscopy, which can yield a high detail level in the cell wall of samples. On the other hand, Figure 6b2 shows structured illumination microscopy or SIM, which is a technique that uses wide illumination in samples. However, this approach uses grid patterns and their rotation to fit and reduce the excess excitation signal of fluorescent molecules, reaching up to 100 nm in resolution (Jost & Heintzmann, 2013) (Heintzmann & Huser, 2017). The STED technique (Figure 6b3) uses two lasers (excitation laser and depletion laser) to fit the emission of a fluorescent spot in the sample to their detection. The reduction of the point spread function (PSF) emission by STED laser enhances the image, and once the PSF diameter is smaller, the diffraction limit images are produced with a resolution of around 30 nm. Additionally, as the STED laser is near the infrared region, samples suffer minimal damage (Yang et al., 2016). Figure 6b4 shows the PALM and STORM techniques commonly classified as pointillism reconstructions. In both techniques, the on/off behavior of fluorescent molecules is used for image reconstruction. With this approach, numerous images are captured during an analysis, short pulses of an activation laser turn on or turn off certain fluorescent molecules in the sample while others are deactivated, and n-images are detected to create a detailed reconstruction with a resolution close to 10 nm (Almada et al., 2015). In PALM, photoactivatable fluorophores are preferable for reaching high-resolution images, while in STORM, photoconvertible probes are used.
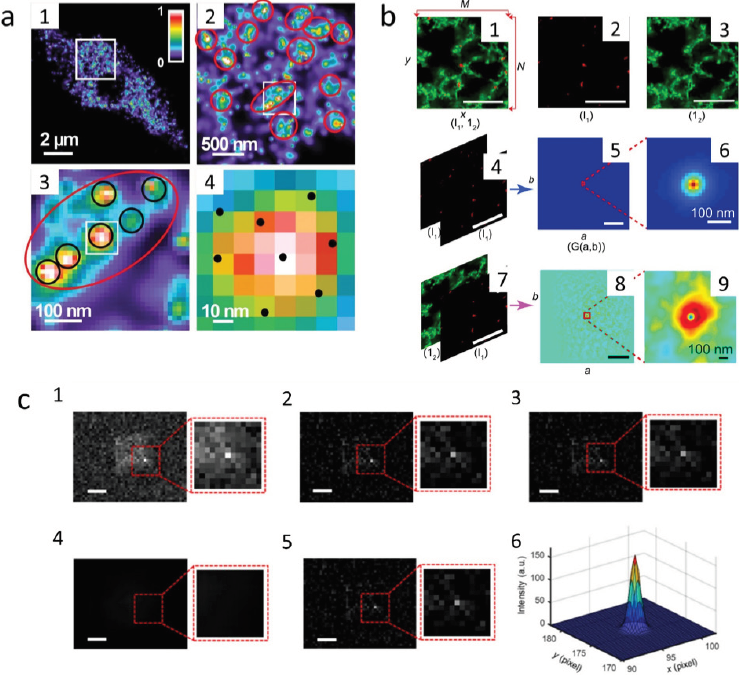
In SRM, the image resolution is related to the size of the PSF that determines the position of emitters, defining the level of detail in images (Huff, 2015). Due to the high-resolution level and the ability of the software used in SRM, the determination of active sites of RNA polymerase II was analyzed (Schubert & Weisshart, 2015) using Arabidopsis thaliana nuclei and PALM microscopy as shown in Figure 7a, where a heat map representation shows the distribution and aggregation of RNAPII. This technique uses specific photoactivable fluorochromes for the sample visualization, and as a result, Figure 7a1 shows a PALM image of the distribution of a 110 nm slice of plant cells using the Alexa488 goatanti-mouse-Cy5 to stain RNAPII. Figure 7a2 shows an enlarged image of Figure 7a1, where aggregation of RNAPII is shown in red. In contrast, Figure 7a3 is an enlarged image of 7a2 where a particular zone was selected to show in extensive circles and small clusters. Finally, 7a4 shows black dots that represent the single-molecule distribution of 8 nuclei. This microscopic analysis allows researchers to discriminate between the density and number of RNAPII molecules along with their distribution and aggregation sites through accurate localization in plant cells through a 3D reconstruction based on the nuclei localization. More specifications for this sample’s preparation and microscope configuration are shown in Table 1.
Source: a1-4): Adapted from (Schubert & Weisshart, 2015); b1-9): adapted from (Glover et al., 2019); c1-6): adapted from (Mao et al., 2019).
Figure 7 Examples of super-resolution microscopy (SRM) applied in the analysis of samples from agricultural, food, and environmental samples. a) PALM images of Arabidopsis leaf to RNAPII distribution: (a1) 110 nm slice of Arabidopsis cell and an enlarged image from a white square (a2). (a3) shows large and small clusters, and (a4) shows a representation of single molecules with black dots as adapted from (Schubert & Weisshart, 2015). b) SRM images of milk gels: (b-1) shows the merging of two colors for a CLSM image, (b2) and (b3) show the separate channel CLSM image; (b4-9) STED images used to obtain the autocorrelation image adapted from (Glover et al., 2019). c) Images of BiVO4 photocatalyst in the hydroquinolines degradation. c1) fluorescence image of catalyst; c2) photoluminescence subtract image; c3) Gaussian smoothed image; (c4) and (c5) non-uniform background image of single-molecule localization and c6) 3D-PSF fitting of a selected area of a single particle.
Table 1 Some examples of agricultural research using each microscopy technique mentioned in this review.
| Microscopy Techniques |
Samples | Sample preparation and equipment | Noteworthy results | References |
|---|---|---|---|---|
| LM | Cuajilote fruits (Parmentiera edulis D.C.). | Samples were subject to histological sectioning. They were placed in a water bath with histological gelatin, stained with Schiff's reagent and toluidine blue for polysaccharides and lignocellulosic compounds, then mounted on slides with a drop of Entellan mounting medium. Eclipse Ti-U, Nikon, Japan. | The difference between the cells of each region that comprise the fruit structure during the immature and mature stages was shown. It is possible to have a fruit selection criterion based on maturity, in which cellulose or lignin can be extracted with greater benefits from their fibers. | (Vicente-Flores et al., 2020) |
| CLSM | Garlic and agave cellulose were isolated by using a sequential extractive process. | Isolated cellulose was labeled with calcofluor white M2R, and lignocellulose was observed by autofluorescence. LSM 710, Zeiss, Germany. | CLSM enables the monitoring of the cellulose extraction; images confirm the gradual delignification of AF and the removal of external cells during alkaline and bleaching treatments. | (Hernández- Varela et al., 2021a) |
| SRM | RNA polymerase in Arabidopsis thaliana nuclei. | Leaves were fixed in formaldehyde/buffer to suspend nuclei; then Polymerase II was stained with goat anti-mouse Alexa488 and goat antimouse-Cy5 were visualized in a Carl-Zeiss Elyra microscope PS-1, Germany. | Distribution and aggregation of RNAPII were achieved with PALM and SIM in plant cells. | (Schubert & Weisshart, 2015) |
| SEM | Nopal spines were removed from nopal waste after 30 and 110 days of growth. | Transversal and longitudinal sections of nopal spines were cut and mounted in aluminum stubs with double-sided carbon adhesive tape ESEM, XL-30, Philips, USA. | Environmental scanning electron microscopy (ESEM) helped characterize the overall structure of nopal spines. | (Marin- Bustamante et al., 2018) |
| AFM | Four apple cultivars (Golden Delicious, Granny Smith, Gala, and Red Delicious). | Tissues of each apple variety were placed on a glass slide fixation system, and pectin and cellulose were prepared with a 0.1 w % solution with ultrapure water, and 0.1 ml was placed on a glass slide and dried in a desiccator. Bioscope Catalyst, Bruker, USA (NP-10 probe). | It was confirmed that the stiffness and cell wall topography of isolated biopolymers (Young's modulus and roughness) has a strong correlation with the macroscopic firmness of each apple variety. | (Rojas-Candelas et al., 2021) |
| TEM | Cellulose nanoparticles (CNP) obtained by ball milling from garlic skin and agave fibers. | CNP after 2 h of milling dispersed in water and ultrasonic bath JEM2100 F, Jeol Ltd., Japan. | Crystalline structure, d-spacing, and angles obtained from triclinic and monoclinic structures of cellulose nanoparticles. | Hernández- Varela et al., 2021a) |
LM: Photonic microscopy; CLSM: Confocal laser scanning microscopy; SRM: Super-resolution microscopy; SEM: Scanning electron microscopy; AFM: Atomic force microscopy; TEM: Transmission electron microscopy.
Source: Author’s elaboration.
On the other hand, SRM and CLSM are correlated techniques that are useful for food science studies. For example, STED and CLSM have been applied to register and differentiate the distribution of fat and proteins in fresh milk gels (Glover et al., 2019). The quantitative measurements are helpful for texture, structure, and functionality related to a better product design. In this research, two-channel images were acquired and compared to a 2D correlative analysis, in which proteins were labeled using Alexa488 and Nile red for fat distribution, as shown in Figure 7b and Table 2.
Table 2 Some examples of food research using each microscopy technique mentioned in this review.
| Microscopy Techniques |
Samples | Sample preparation and equipment | Noteworthy results | References |
|---|---|---|---|---|
| LM | Starch from frozen jícama (P. erosus) roots. | The samples were placed on a slide, and a drop of 50% glycerol solution was added; different zones on the slide were observed at 60X with a polarized light filter in an Eclipse Ti, Nikon, Japan. | It was shown that the crystalline structure and morphology of the starch granules are unchanged regardless of the pretreatment exposure time. Birefringence is also maintained. | (González-Lemus et al., 2018) |
| CLSM | Cellulose and pectin change during mango ripening. | Pectin and cellulose were isolated from the mango cell wall in different treatments; calcofluor was used to stain cellulose and was observed using a 60X objective and excitation line 405 nm. | Changes in visualization occurred in the mango cell wall structure during maturation; the extraction of cellulose is more convenient in the advanced ripening stage. | (Cárdenas-Pérez et al., 2018) |
| SRM | Fat and proteins in daily milk gels. | Fresh milk samples were homogenized under different pressure conditions, then milk fat was stained with Nile Red and Alexa488 for proteins Leica TSC SP8 STED microscope, Germany. | Proper identification of fat and proteins in food materials was acquired in STED. | (Glover et al., 2019) |
| SEM | Residual cake from castor beans after oil extraction using thermosonication extraction (TS) in a modified Soxhlet system. | Powders were placed in aluminum holders adhered with carbon tape and coated with cathodic sputtering JEOL JSM-7800 F, Japan. | Characterization of residual cake after TS extraction using backscattered electrons (BSE) presents the possibility of studying cellulosic compounds from residues. | (López-Ordaz et al., 2019) |
| AFM | Tissue and isolated cells from apple. | The tissue was cut and held between two slides. For the isolated cells, a glass slide was covered with a histological fixator solution of 40%. A drop of the single-cell solution was deposited on the glass. Bioscope Catalyst, Bruker, USA (NP-10 probe). | To measure local mechanical properties, the "point and shoot" method was used to perform a better indentation. The Young's modulus obtained for the cells in tissue was higher than that of the isolated cells due to the loss of structural rigidity caused by the alkaline method of isolation. | (Cárdenas-Pérez et al., 2016) |
| TEM | Spirulina (Arthrospira maxima) nanoparticles (SNP) by high-impact mechanical milling. | SNP, after three h of milling were vortexed for 5 min in water JEM-ARM 200CF, Jeol Ltd., Japan TEAM 0.5 microscope, FEI, USA. | High-resolution transmission electron microscopy of Spirulina nanoparticles showing their size and lattice spacing. | (Neri-Torres et al., 2016) |
LM: Photonic microscopy; CLSM: Confocal laser scanning microscopy; SRM: Super-resolution microscopy; SEM: Scanning electron microscopy; AFM: Atomic force microscopy; TEM: Transmission electron microscopy.
Source: Author’s elaboration.
Figure 7b1 shows the two-channel image of fat and proteins in whole milk gels (red and green, respectively). This image was separated into two channels for further processing (Figures 7b2 and 7b3). The autocorrelation image is included in Figure 7b4-9 where the correlation image was produced from the fat and protein channel, which establishes the specific fat and protein distribution in the samples.
Until now, it has been shown that SRM registers the fluorescent signals of molecules in many processes. However, recent advances such as competition-enabled imaging enable quantitative imaging of non-fluorescent processes. For instance, Mao et al. (2019) study the catalytic process of BiVO4 for the degradation of hydroxyquinolines, using only the autofluorescence behavior of nanoparticles. Figure 7c1 shows a fluorescent image of a catalyst, where active sites are present and are dependent on the crystalline phase. Figures 7c2 and 7c3 show the photoluminescence and Gaussian-smoothed image of BiVO4. Figures 7c4 and 7c5 show the non-uniform back-ground image estimated from Figure 7c3, which is useful for single-molecule localization. Finally, Figure 7c6 shows a three-dimensional Gaussian PSF fitting of a 13 × 13 pixel2 area of a single molecule localization, which leads to the conclusion that catalytic sites can be noticed and without labelling with fluorescent molecules for its visualization in SRM as Table 3 reported.
Table 3 Some examples of environmental research using each microscopy technique mentioned in this review.
| Microscopy Techniques |
Samples | Sample preparation and equipment | Noteworthy results | References |
|---|---|---|---|---|
| LM | Salicornia bigelovii stems. | The samples were cut into thin slices with a blade and a cryostat. The slices were stained with safranin (red), and fast green to observe the lignin (green) and cellulose (blue) of the cell wall. Eclipse Ti-U, Nikon, Japan. | It was possible to observe the distribution of NaCl crystals (cr) in the cross-section of the stem, and the abundance of NaCl crystals, located mainly in the parenchyma cells and vascular bundles (vb), was evident. | (Cárdenas-Pérez, Piernik, et al., 2020) |
| CLSM | Cellulose aerogels with garlic nanoparticle waste in a chitosan/ alginate matrix. | Cellulose nanoparticles, chitosan, and alginate were specifically stained with Calcofluor white, Fluorescein 5-isothiocyanate (FITC), and rhodamine B, respectively; samples were excited by 405 nm, 488 nm, and 561 nm lasers. | Structural and mechanical conformation were evaluated, the identification of components along the sample was observed and labeled specifically with conventional dyes. | (Hernández-Varela et al., 2022) |
| SRM | BiVO4 photocatalyst. | BiVO4 particles with tunable truncated bipyramid morphology was assembled into a three-electrode photoelectrochemical microfluidic cell to reactions. | The electrocatalytic photoreaction in the surface of BiVO4 for the degradation of hydroquinone was monitored by SRM. | (Mao et al., 2019) |
| SEM | Epidermis from agave leaves (A. atrovirens) was obtained from waste after. the elaboration of a local beverage (pulque). | Samples without cuticles were washed, dried, milled, and sieved. ESEM, TESCA Company, Czech Republic. | The microscopy technique was used to elucidate and corroborate the affinity capacity of the A. atrovirens epidermis for the removal of lead and copper. | (Hernández-Botello et al., 2020) |
| AFM | Aluminum nanoparticles (Al-NP). | Samples were dispersed in distilled and reconstituted water and sonicated, centrifuged at 6000 RPM for 5 min and the supernatant was subtracted and deposited in glass slides and then mounted onto an AFM. Innova, Veeco Instruments Inc, USA.. | By AFM in contact mode, the size distribution of Al-NP was determined, dispersing in distilled water (87.95%<100 nm), with a numerical mean size (NMS) of 64.65 ± 21.43 nm and in reconstituted water (65.66%<100 nm), the NMS was 100.23 ± 49.67 nm. | (García-Medina et al., 2022) |
| TEM | TiO2 nanoparticles in cell walls of tomato root. | Fixed samples were cut in ultrathin slices and contrasted with uranyl acetate and lead citrate JEM-2100, Jeol Ltd., Japan. | TEM analysis inside the cells shows that TiO2 NPs are in the form of agglomerates very close to the wall of the cells. | (Nicolás-Álvarez et al., 2021) |
LM: Photonic microscopy; CLSM: Confocal laser scanning microscopy; SRM: Super-resolution microscopy; SEM: Scanning electron microscopy; AFM: Atomic force microscopy; TEM: Transmission electron microscopy.
Source: Author’s elaboration.
Scanning electron microscopy
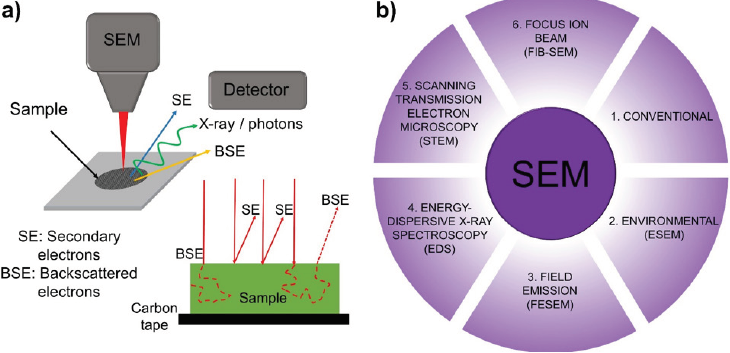
In the 1950s and 1960s, some groups started the development of scanning electron microscopes (SEM) to directly study the surfaces of solid objects (Oatley, 1982). Figure 8a shows that SEM microscopes produce images by scanning the surface of a sample using electrons from a focused beam (Goldstein et al., 2018).
Source: Author’s elaboration.
Figure 8 a) Basis of scanning electron microscopy (SEM). A focused beam interacts with the surface of a sample at different depths producing a distinctive signal such as secondary electrons (SE), backscattered electrons (BSE), and X-rays or photons, which can be detected depending on the instrument. b) Typical techniques employed in SEM: conventional, environmental scanning electron microscope (ESEM), field emission scanning electron microscope (FESEM), energy-dispersive X-ray spectroscopy (EDS), scanning transmission electron microscope (STEM) and focused ion beam (FIB) coupled with SEM.
Several signals can be detected from the interaction between the electrons and atoms in the sample, depending on the depths. Some of the produced signals include secondary electrons (SE), backscattered electrons (BSE), characteristic X-rays and light (cathodoluminescence), absorbed current (specimen current), and transmitted electrons (Hawkes & Spence, 2019; Kulkarni, 2015). In all cases, the electron beam is scanned in a raster scan pattern, and the position of the beam is combined with the intensity of the detected signal to produce an image as shown in Figure 8a (McMullan, 1995). The accelerating voltage of the electron beam (kV and tens kV) is used to converge the electron beams in the lenses to reach a resolution of 5 nm (Lenthe et al., 2018). However, several applied techniques can be used depending on the sample in the study (Figure 8b). For example, with the conventional SEM (Figure 8b1) inorganic and organic samples can be used; however, the organic samples need a gold-coated sample for a better surface characterization (Benini et al., 2018).
With conventional SEM, it is possible to find the field emission (FE) coupled with SEM. This is an electronic beam generation technique that can be installed as an electron cannon in both SEM and TEM to improve in the resolution of samples (Figure 8b2), thereby becoming a coupled scanning-transmission technique which will be discussed later. In the case of non-metallic and organic samples, environmental scanning electron microscope (ESEM), as shown in Figure 8b3, is useful due to the low pressure and higher humidity performed in this equipment (Cárdenas-Pérez et al., 2017).
Moreover, unknown samples can be analyzed to find the samples’ chemical composition when the energy of the photons emitted from the specimen can be measured. Some examples of this coupled SEM are the energy-dispersive X-ray spectroscopy (EDS) detectors (Figure 8b4) used in elemental analysis and cathodoluminescence microscope systems that analyze the intensity and spectrum of electron-induced luminescence (Kulkarni, 2015). Furthermore, when samples are thin enough, and an under detector is included, a transmission mode known as scanning transmission electron microscope (STEM) can be achieved (Figure 8b5). This allows for the analysis of samples on a nanometric scale by using only a grid as support. Finally, a focused ion beam (FIB) is a tool in which integrated circuits can cut the sample enabling high-resolution imaging of the results of the process (Figure 8b6). However, it is important to clarify that FIB is widely used as a sample preparation technique enabling high-performance materials to be used in other techniques such as tips for AFM or cross-section of samples for microfabrication (Goldstein et al., 2018; Hawkes & Spence, 2019; Kulkarni, 2015).
Therefore, SEM images are valuable for the microstructural characterization of samples from agricultural, food, and environmental fields, with some examples explained in this section and compiled in Tables 1-3. Marin-Bustamante et al. (2018) applied this technique in the characterization of spines from nopal waste, the nopal being a common plant in Mexico (Figure 9a). The authors used transversal and longitudinal sections of nopal spines with ESEM and reported an overall structure of these samples that had been scarce in the agricultural field of research. These images were acquired with SE at 25 kV accelerating voltage at a work distance of 11 mm. The authors claim that the spines lack stomas, a condition produced by the evolution of the cactus responsible for the loss of their photosynthetic functions.
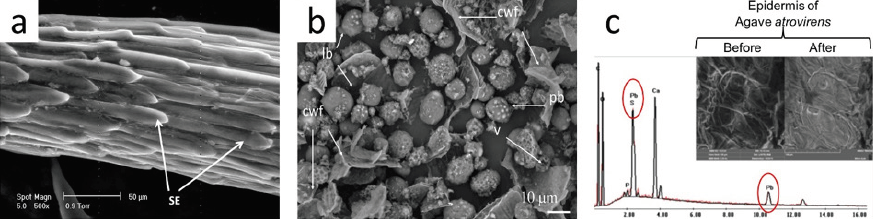
Source: a): Adapted from Marin-Bustamante et al. (2018); b): adapted from López-Ordaz et al. (2019); c): adapted from Hernández-Botello et al. (2020).
Figure 9 Examples of SEM application in agricultural, food, and environmental samples. a) Spines from nopal waste observed in a longitudinal section with secondary electrons in ESEM. b) Residual cake after oil extraction in castor beans by the Soxhlet method showing cell wall fragments (cwf), lipid bodies (lb), protein bodies (pb), and voids (v). c) uses of epidermis from agave leaves (A. atrovirens) obtained from wastes after the elaboration of pulque.
In a different study, López-Ordaz et al. (2019) used castor beans for oil extraction using thermosonication extraction (TS) in a modified Soxhlet system, and later, the residual cake was coated with cathodic sputtering and studied under FESEM (Figure 9b). The authors found changes in the cell wall (cw), lipid bodies (lb), protein bodies (pb), and voids (v) of the residual cake, and explained backscattered electrons (BSE) opened the study of cellulosic compounds from residues. Finally, Hernández-Botello et al. (2020) analyzed the advantages of plant-based material for the removal of contaminants in water. In this case, the authors presented the uses of epidermis from agave leaves (A. atrovirens) obtained from wastes after the elaboration of pulque. The SEM images were used to elucidate and corroborate the affinity capacity of the A. atrovirens epidermis for the removal of lead and copper.
Atomic force microscopy
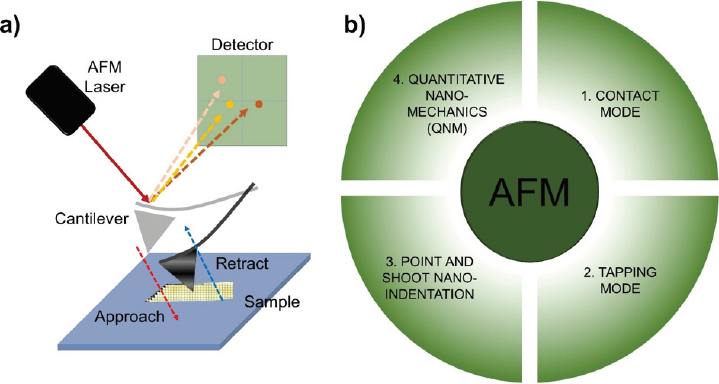
Atomic force microscopes (AFM) are near-field scanning instruments for nanoscale research. Instead of using light or electron beams as within other microscopes, this method uses a cantilever tip to detect its deflection when samples are scanned (Figure 10a). Since the radius of curvature of the tip is nanometer-sized, under the best conditions AFM can achieve sub-nanometer spatial resolution (Binnig & Quate, 1986; Hawkes & Spence, 2019). The probe is a cantilever with a pyramid-shaped sharp tip, 3-6 µm in height with an end radius of 15-40 nm. Although AFM has a low lateral resolution (~30nm) due to convolution, the vertical resolution can be up to 0.1 nm. The probe then travels extremely close to the sample surface to detect surface features, causing cantilever deflections and hence, laser deflections to the data register.
Source: Author’s elaboration.
Figure 10 a) Basis of the atomic force microscopy (AFM) showing the main parts: laser, cantilever, and detector. b) A condensation of the four most applicable techniques in AFM: contact mode, tapping mode, point and shoot nano-indentation, and quantitative nano-mechanics.
During the measurement, the AFM records the attractive and repulsive forces on the sample through deflection of the cantilever tip, which is systematically scanned across the sample surface by moving a laser reflected from the top of the cantilever towards a quadratic photosensitive photodiode, as illustrated in Figure 10a. The tip is selected based on size, geometry, stiffness composition, type of interaction with a surface, and interaction zone (Butt et al., 2005; Dufrêne, 2008).
The most important applications of AFM for the study of nanoscale samples can be classified into two categories: imaging to visualize sample topography and force spectroscopy. Imaging is further divided into two modes: contact and dynamic (see Figures 10b1 and 10b2, respectively). The contact mode is the basis of all AFM techniques and is the most used imaging mode, in which the tip and the sample surface maintain contact during scanning (raster scans) (Jalili & Laxminarayana, 2004). In contrast, the dynamic mode includes the intermittent mode, also known as the tapping mode and adaptable for air or liquid environments. The AFM tip oscillates near or slightly above its resonant frequency during scanning (García & Pérez, 2002; Kim & Chelikowsky, 2014). The force spectroscopy technique measures the interaction strength and nanomechanical properties of samples by generating force curves, while certain microscope models can measure multiple force curves as an array of points. This indentation method is known as “point and shoot” (Figure 10bc), through which a valuable collection of force curves can be obtained semi-automatically as an array or canvas of force data, thereby enabling the acquisition of several high-precision force measurements (Cárdenas-Pérez et al., 2016, 2017; Gavara, 2016; Rojas-Candelas et al., 2021). In addition, an optimized mode called peakforce quantitative nanomechanics (QNM) creates maps of various nanomechanical parameters (Young’s modulus, adhesion, dissipation, deformation, among others) while simultaneously collecting sample topography automatically with nanometer-scale resolution (Figure 10b4), from extremely soft materials (~1 kPa) to hard materials (100 GPa) (Kwaśniewska et al., 2021; Ortega-Toro et al., 2015; Smolyakov et al., 2016; Torres-Ventura et al., 2022). Changes in topography usually involve changes in Young’s modulus (E), also known as the modulus of deformability, which is a physicochemical parameter that evaluates the stiffness of a material (Cárdenas-Pérez et al., 2016).
Thus, the AFM technique has become an important tool for researchers in various biological disciplines, such as in the agricultural, food, and environmental sectors, providing detailed information as explained in the following examples (Table 1-3). Rojas-Candelas et al. (2021) evaluated firmness differences among four apple cultivars (Golden Delicious, Granny Smith, Gala, and Red Delicious). They observed mesocarp sections (10 × 10 × 0.5 mm) and indented eight × eight matrices with the “point and shoot” method for each variety (five × five μm2 images). In this work, 640 force curves were obtained from 10 different apple cells and their Young’s modulus was obtained. With this technique, it was confirmed that the stiffness and cell wall topography of isolated biopolymers (Young’s modulus and roughness) has a strong correlation with the macroscopic firmness of each apple variety. It was also found that some cultivars share similar characteristics, and Figure 11a shows the results of the Granny Smith cultivar. Furthermore, Cárdenas-Pérez et al. (2016) performed indentations on ten different isolated cells and apple tissue regions within an area of 5 μm in an 8 × 8 matrix while also using the “point and shoot” method, generating 64 indentation points for each region of interest (as shown in Figure 11b). Young’s moduli were obtained for each curve, while values for the cells in the tissue were higher than that of individual isolated cells due to the loss of structural stiffness caused by the alkaline isolation method that mainly hydrolyzes cell wall polysaccharides such as pectin. In addition, García-Medina et al. (2022) used AFM to evaluate the size of aluminum nanoparticles (AlNP) used in the bioaccumulation of fishes in controlled environments. One sample was dispersed in distilled water (pH = 7), and the second sample was dispersed in reconstituted water (NaHCO3, MgSO4, KCl, CaSO4, 2H2O at pH = 7.8). In contact mode, height and deflection images were obtained. It was found that for AlNP with distilled water there was a distribution of 87.95 % < 100 nm and numerical mean size (NMS) of 64.65 ± 21.43 nm. AlNP in reconstituted water presented a lower distribution of nanoparticles < 100 nm (65.66 %), observing several aggregates, with the NMS measured at 100.23 ± 49.67 nm. These studies highlight the importance of the nanometer range for performing this type of environmental analysis with the AFM (Figures 11c1 and 11c2).
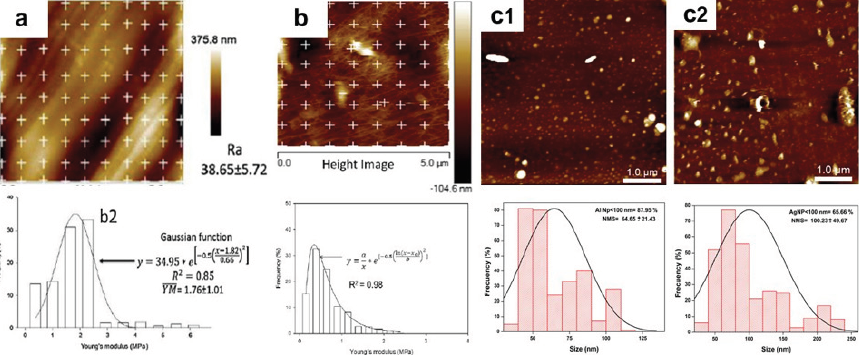
Source: a): Adapted from Rojas-Candelas et al. (2021); b): adapted from Cárdenas-Pérez et al. (2016); c1-2): adapted from García-Medina et al. (2022).
Figure 11 Some examples of atomic force microscopy (AFM). a) In agriculture, a section of the mesocarp of the cultivated Granny Smith apple was observed to evaluate its stiffness using the point and shoot method. b) For food, isolated cells and regions of apple tissue were evaluated for stiffness analysis using the point and shoot method. c) An environmental study was undertaken with the size of aluminum nanoparticles (AlNP) used in fish bioaccumulation evaluated in two controlled environments: c1) in distilled water, and, c2) in reconstituted water (NaHCO3, MgSO4, KCl, CaSO4, 2H2O).
Transmission electron microscopy
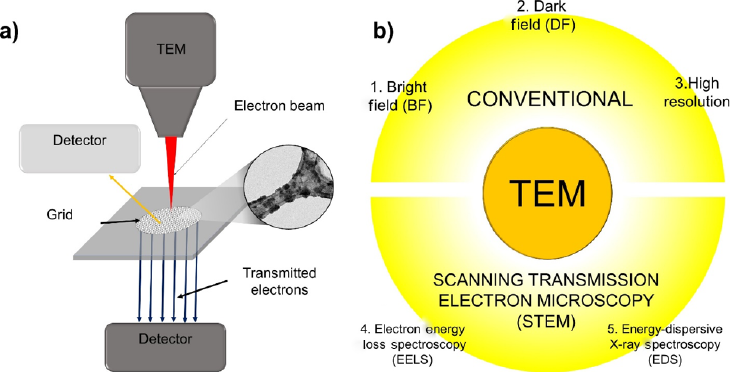
At the nanometric and atomic scale, transmission electron microscopy (TEM) emerges as a powerful technique in which two variants (TEM and STEM) can be used for analysis in material science. In conventional TEM, a high-energy electron beam is positioned through a very thin sample that registers the interactions between electrons and atoms, resulting in observing features such as size, shape, and crystalline structure (Figure 12a). In order to achieve the nanometric and atomic scale, the TEM operates in a similar manner to that light of microscopy. As with SEM, the generated beam is created from electrons instead of light, where the wavelength of electrons is smaller than light. The resolution reached in TEM is better than the light microscope in various magnitude orders (Williams & Carter, 2009). State-of-the-art spatial (spot) resolution has been limited to ∼0.15 nm. However, this value is still decreasing due to continuous improvements in microscope design and computer processing (Pyrz & Buttrey, 2008). The most common high-resolution TEMs have a spatial resolution of 0.17 nm (1.7 A), whereas general-purpose TEMs have spatial resolutions of just over 0.2 nm (2 Å). Therefore, TEM configuration can reveal smaller structures and internal behaviors such as individual atoms and crystalline phases (Kulkarni, 2015).
Source: Author’s elaboration.
Figure 12 a) Typical diagram of the transmission electron microscope (TEM), and, b) the most useful techniques used for sample analysis: bright field, dark field, and high resolution for conventional TEM and electron energy loss spectroscopy (EELS) and energy-dispersive X-ray spectroscopy (EDS) for scanning electron transmission microscopy (STEM).
The fundamentals of TEM are based on the electron gun that is focused into a small, thin, coherent beam of electrons (Winey et al., 2014). When the beam traverses the specimen, parts of electrons can be analyzed in two ways (Hawkes & Spence, 2019): one approach depends on the thickness and electron transparency of the specimen (conventional TEM mode), and the second approach on the scan over the sample parallel to the optical axis performed by the electron beam (STEM mode) (Figure 12b). Based on the TEM fundaments, some analysis can be performed, enabling chemical study, morphological, compositional, and physicochemical interactions. In both cases, bright field (BF), darkfield (DF), and the high-resolution analysis reached (Figure 12b1, 12b2, and 12b3, respectively) can be used to analyze the quality, shape, size, and density at the atomic scale (Verma et al., 2018; Williams & Carter, 2009). It is important to highlight that high resolution opens the possibility of using electron diffraction, with TEM becoming an important tool for solving crystallographic problems in related fields such as agriculture, food, or the environment that were not assessed until now (Bendersky & Gayle, 2001). Moreover, the electron transmitted portion in TEM is focused through the sample, and the electron energy loss is detected by the STEM mode based on the use of an electron spectrometer. This technique is also known as electron energy loss spectroscopy (EELS), where the emitted atoms of the sample can be detected using an electron spectrometer (Figure 12b4) (Hawkes & Spence, 2019; Kulkarni, 2015). Furthermore, another technique named energy-dispersive X-ray spectroscopy (EDS) (Verma et al., 2018), based on the characteristic X-rays emitted by each element atom in the sample, can be detected using an X-ray spectrometer, which provides elemental information about the composition of samples (Figure 12b5).
TEM has been used in different fields of research, such as agriculture, food, and the environment, and some examples are collected in Tables 1-3. In the agricultural field, Hernández-Varela et al. (2021a) studied the crystalline structure of cellulose nanoparticles obtained by ball milling using the d-spacing and angles obtained from a conventional TEM image (Figure 13a). The results indicate that TEM analysis of the samples from agro-food wastes is a new field of research that needs further study to understand the triclinic and monoclinic structures, which depend on the initial microstructure and origin of the cellulose source. The authors used TEM images depicting cellulose nanoparticles of garlic (Figures 13a1 and 13a2) and agave (Figures 13a6 and 13a7). Then, crystalline lattices (Figures 13a3 and 13a8) were obtained from a high resolution in the focus plane of the sample and used to produce a Fast Fourier Transform (FFT, insets). This facilitates a crystallographic analysis producing a masked FFT and finally an inverse Fast Fourier Transform (IFFT) with their corresponding masks (insets) for garlic (Figures 13a4 and 13a5) and agave (Figures 13a9 and 13a10). These IFFT were used for measuring d-spacings (d1, d2, d3) along with angles (α, β, γ) and presented the possibility of the elucidation of the monoclinic and triclinic crystalline structure for this cellulose obtained from agro-wastes.
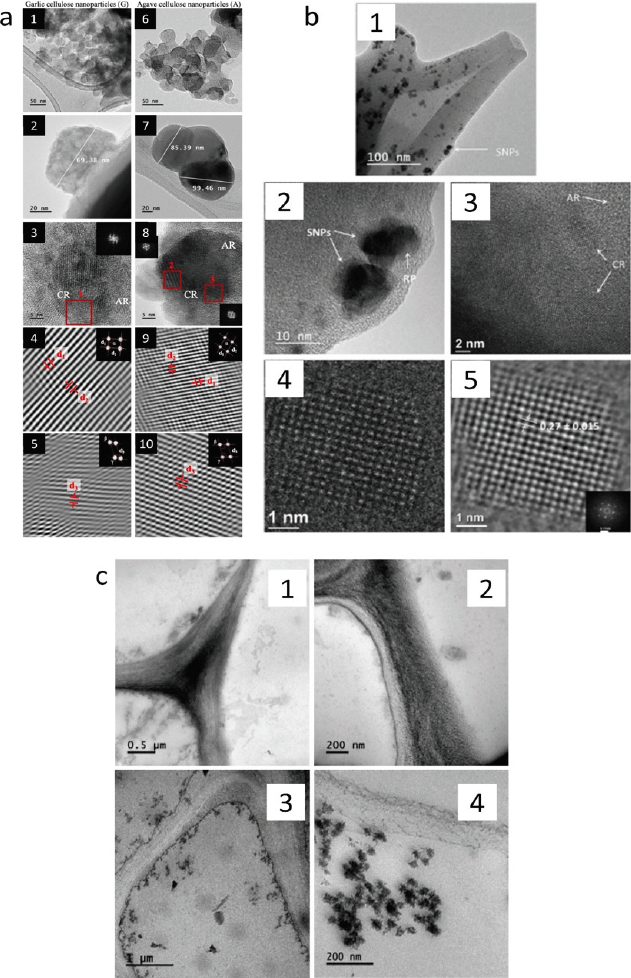
Source: a1-10): Adapted from (Hernández-Varela et al., 2021a); b1-5): adapted from (Neri-Torres et al., 2016).; c1-4): adapted from (Nicolás-Álvarez et al., 2021).
Figure 13 Examples of TEM application in agricultural, food, and environmental samples. a) TEM images of cellulose nanoparticles of garlic (1 and 2) and agave (6 and 7). Crystalline lattices (3 and 8) obtained from a high-resolution in-focus plan of the sample were used to produce a Fast Fourier Transform (FFT, inset), which enables a crystallographic analysis to be carried out, producing a masked FFT and finally an inverse Fast Fourier Transform (IFFT) with their corresponding masks (insets) for garlic (4 and 5) and agave (9 and 10). These IFFT were used for measuring d-spacings (d1, d2, d3) and angles (α, β, γ). CR: crystalline regions; AR: amorphous regions. b) TEM images of Spirulina nanoparticles after three h of mechanical milling (1) which show single Spirulina nanoparticles (2); (3 and 4) molecular structure and molecular lattice of a crystalline region in a Spirulina nanoparticle; (5) exit wave reconstruction phase image obtained from 40 images with different defocus settings. SNPs, Spirulina’s nanoparticle; CR, crystalline region; AR, amorphous region. c) Ultrastructure of tomato root by TEM of cell walls without TiO2 nanoparticles (1 and 2) and cell walls with TiO2 nanoparticles (3 and 4).
Furthermore, in food science, Neri-Torres et al. (2016) used Spirulina (Arthrospira maxima) nanoparticles (SNP) obtained by high-impact mechanical milling and determined their size and lattice spacing as well as SNP composition using high-resolution TEM and STEM. This study revealed the crystalline zones that facilitate the wall material study where nanoparticles were disposed of, and also the lattice-plane spacings normally based on maltodextrin chains shown in Figure 13b. The authors used TEM images of Spirulina nanoparticles after three h of mechanical milling (Figure 13b1), which showed single Spirulina nanoparticles (Figure 13b2) for a completed molecular structure and molecular lattice analysis of a crystalline region in a Spirulina nanoparticle (Figures 13b3 and 13b4, respectively). Finally, an exit wave reconstruction phase image obtained from 40 images with different defocus settings was analyzed (Figure 13b5), within which was found a spacing in the of 0.270 ± 0.015 nm nanoparticle, which was previously reported for nanosized starch hydrolysates.
As another application of conventional TEM, TiO2 nanoparticles in the cell walls of tomato root were studied by Nicolás-Álvarez et al. (2021). As a result, Figure 13c shows the agglomerates of TiO2 disposed near the cell wall. This analysis was implemented to perform the changes in the morphology of vegetal tissues when exposed to environmental contaminants. In particular, after 21 days of exposure to 20 mg/L TiO2 NPs, tomato root cells showed TiO2 NPs inside the cells near the cell wall (Figures 13c3 and 13c4), which are less observable in the cells before exposition (Figures 13c1 and 13c2). These results can be clearly observed by TEM image analysis.
To summarize every technique (LM: Photonic microscopy; CLSM: Confocal laser scanning microscopy; SRM: Super-resolution microscopy; SEM: Scanning electron microscopy; AFM: Atomic force microscopy; TEM: Transmission electron microscopy) and each field of investigation selected for this review (agriculture, food, and environment), Tables 1, 2 and 3, were created for ease of understanding. Each table reports the type of samples, their preparation, and equipment used in the experimental part of the investigation. The most noteworthy results found in the investigation are reported to facilitate understanding each technique in a selected sample.
Conclusion
This review presented the main results obtained from microscopy techniques applied for agricultural, food, and environmental materials, based on their ultrastructure or morphology, depending on the microscopy technique used in the analysis. The resulting revision reveals that microscopy has a great potential for research in the growth of nanotechnology applied to less developed areas. It can become a relevant field of study involving nanotechnology for further and new projects to develop exciting and novel research. These ideas were clarified decades ago, although microscopy techniques cover several fields. A compilation of the types, capacities, and uses is needed for an in-depth understanding of these approaches, together with multidisciplinary work between researchers of different fields to increase the opportunities of using these techniques in more complex and difficult samples. Finally, this review presented a detailed and accurate guideline for students and researchers of nanoscience in biological fields and other areas of study which focus on plant-based, food, and eco-friendly technologies, as many researchers focus on cell biology, ignoring this field which has a significant impact on improving people’s lives and the environment.

