


 text in
  English (pdf)
 Article in xml format
 Article references
 Send this article by e-mail
 Cited by SciELO
  Similars in
SciELO
Similars in
SciELO 
 Permalink
1. Introduction
Corrosion can be understood as the destructive interaction between steel and the environment. The corrosion is initiated by electrochemical, chemical, and physical actions or by their union. The process is usually aggravated by the activity of chlorides or by the development of cracks. The corrosion process in regions with tensile stresses is a severe problem since it can cause a brittle rupture without prior strain. (Helene, 1993; Schvartzman et al., 2010).
The steel in reinforced concretes (RCs) is protected by an iron oxide film that forms on the metal surface due to the alkalinity of the concrete, ensuring its passivation. However, the protection can be compromised with pH reduction to below nine due to the carbonation of the concrete. The carbonation process occurs due to the presence of chloride ions at critical rates of atmospheric pollution, which is intensified by the age of the construction (Maldonado-Bandala et al., 2018; Araujo et al., 2020; Silvestro et al., 2020).
The use of inadequate cover thicknesses due to design or execution errors can compromise the protection of the steel bars (Fusco, 2008; Malheiro et al., 2014; Felix e Carrazedo, 2021). Furthermore, the choice of cement, additives, and additions can mitigate or intensify the corrosive potential (Silva et al., 2015; Trevisol et al., 2017; Dietrich et al., 2017; Teixeira et al., 2021).
Steel corrosion results in a powdery hydroxide without adhesion or cohesion called rust, which increases in volume as it forms and can have eight to ten times the initial volume of steel. Thus, the rusted regions put pressure on the surrounding concrete, initiating the degradation of the structure. (Verçoza, 1991; Balestra et al., 2018).
Several studies aim to reproduce the deterioration conditions in the laboratory through accelerated tests (Meira e Ferreira, 2019). In addition, other authors intend to investigate the impact of different additions on the corrosive potential of RC (Amorim Júnior et al., 2021; Santos et al., 2020; Blanco et al., 2019; Figueiredo et al., 2014). Such studies are necessary as it is estimated that up to 3.5% of a developed country's Gross Domestic Product (GDP) is spent on repairs from corrosion degradation (Mackechnie e Alexander, 2001). Thus, research on mathematical models that can describe the structural degradation caused by corrosion is increasing.
Recent research has explored numerical simulation of chloride diffusion in concrete and reliability analyses based on probabilistic models (Ayinde et al., 2017; Souza and Leonel, 2021; Felix et al., 2020; Ramos and Carrazedo, 2021; Favretto et al., 2021). However, other applications use the finite element method, such as the one proposed by Ramos and Carrazedo (2020). They developed models capable of describing the different stages of damage propagation caused by the corrosive process on RC specimens.
Therefore, the present study aims to contribute to this area, adding to the corrosion problem the evaluation of global stability. For this purpose, the concrete behavior and the damage evolution were numerically reproduced. The numerical model was performed using the Finite Element Method (FEM), as discussed in this paper.
2. Methodology
Using numerical simulations to predict the behavior of reinforced concrete structures (in the presence of damage) requires a satisfactory stress-strain curve reproduction of the materials.
This section will describe all the parameters used to simulate the mechanical behavior of concrete and steel. The validation of the constitutive models will be demonstrated through the comparison with the Model Code (2010).
2.1 Constitutive models
Materials settings that reproduce the behavior of steel and concrete have been added to finite element models. These settings contain characteristics such as density, Young's modulus, and Poisson's ratio.
In the case of concrete, due to the natural development of cracks, it is necessary to add more information so that the model can reproduce the behavior in tension, compression, inelastic strains, and damage.
The constitutive models used for the materials (concrete and steel) were extracted from the European code CEB-FIB (2010). Thus, this step aims to reproduce the mechanical behavior of reinforced concrete, its stress-strain curve, and the influence of applying a damage model.
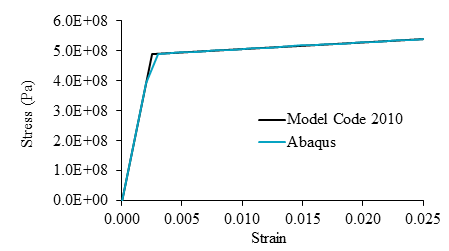
2.1.1 Constitutive model of steel
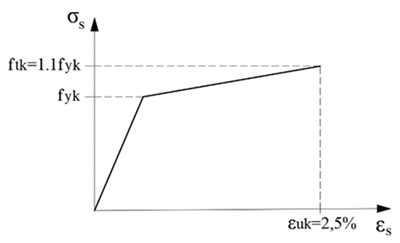
The constitutive model used for steel describes its behavior in the presence of tensile (or compression) stresses, represented in the diagram in Figure 1. The first curve represents the linear response of the material until the yield strength (f yk ). After that, yield occurs until the characteristic strength (f tk ) and the maximum strain (ε uk ) are reached.
The stresses in the steel (σ s ) were obtained through Eq. (1), i.e., from the steel Young's modulus (E s ) and the steel strain (ε s ).
where:
2.1.2 Constitutive model of concrete
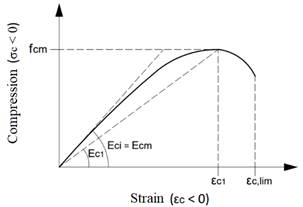
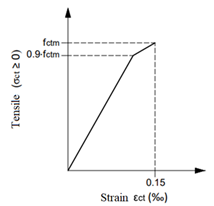
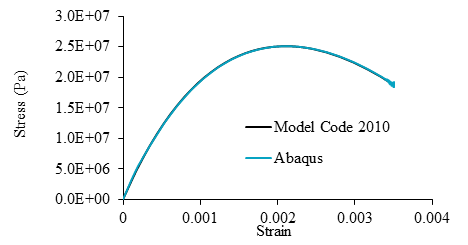
The constitutive model used in concrete reproduces its behavior in compression (Figure 2) and tension (Figures 3 and 4).
When compressed, the concrete presents an elastic behavior until reaching the average compressive strength (f cm ). After this point, microcracks development causes the softening, represented in the decreasing curve.
Tensile concrete presents a linear elastic behavior until reaching a deformation of 0.15‰ (ε ct ) in approximately 90% of the average tensile strength (f ctm ). At stresses close to the f ctm , the microcracks intensify, and the material drastically reduces its stiffness.
The f cm was defined through Eq. (2) using the characteristic compressive strength (f ck ) and the difference between the average strength and the characteristic strength of concrete (∆f).
The secant module (E C1 ) was defined from Eq. (3). In this equation, the maximum compression strain (ε c1 ) is obtained through the tabulated values contained in the CEB-FIB (2010).
Eq. (4) was used to determine Young's modulus of the concrete at 28 days (E ci ), which depends on Young's modulus initial (E c0 ), the nature of the aggregate (α E ), and the standardized value ∆f, defined by consulting the CEB- FIB (2010).
The ratio between the strains (η) and the plasticity constant (k) was defined through Eqs. (5) and (6), respectively. Finally, Eq. (7) defined the stress-strain curve shown in Figure 2.
The tensile strength of concrete (f ctm ) was defined through Eqs. (8) and (9), which depends on its f ck .
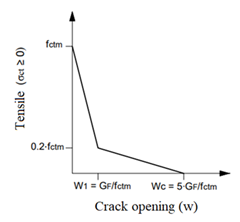
The stresses in the fracture zone (after f ctm ) are related to crack opening (w) through Eqs. (10) and Eq. (11). Finally, the fracture energy (G F ) was obtained from Eq. (12).
G F x w alone is not enough for many applications. Therefore, Aitsin et al. (2008) define the characteristic length (l ch ), Eq. (13), as a useful value for evaluating crack opening in terms of strain.
The strains ε t had values ranging from zero to maximum cracks (w c ), defined from the ratio between w c and l ch . The tensile stress (σ t ) was defined up to a strain of 0.15‰ through Eqs. (14) and (15). In the fracture zone, the σ t was determined using Eqs. (16) and (17), ranging from 0.15‰ to w c .
The values of σ c and σ t were added to the damage model applied to concrete in the numerical simulations.
2.1.2.1 Damage model applied to the concrete model
The model adopted for concrete was the Concrete Damage Plasticity (CDP), developed by Lubliner et al. (1989) and improved by Lee and Felves (1998). This model is implemented and available in the Abaqus®.
The behavior in the presence of damage is represented in the diagrams in Figures 5 and 6. Eqs. (18) and (19) described the stress x strain relationship for compression and tensile, respectively (Hibbitt et al., 2011).
While intact, the concrete shows conservation in its initial Young's modulus (E 0 ). However, upon reaching the maximum stresses (σ tu or σ cu ), the degeneration process begins as the damage variables d t (traction) and d c (compression) are increased. Finally, the plastic deformations in tension (ε t pl ) and compression (ε c pl ) add plasticity to the model.
The damage variables d c and d t were obtained through Eqs. (20) and (21), respectively, proposed by Yu et al. (2010), with the values of σ c , σ t , f cm, and f ctm already defined.
Thus, the calculated d c and d t damage variables were added to the concrete damage model.


2.2 Validation of the constitutive models
Numerical simulations were performed in Abaqus® to analyze whether the constitutive models achieved the expected response.
In this first step, three analyzes were conducted, one to verify the behavior of the tensile steel (in 2D bar elements) and the other two to demonstrate the behavior of the tensioned and compressed concrete (in 2D linear solid elements with four nodes). The elastic properties of materials, such as Young's modulus (E) and Poisson's ratio (ν), were extracted from Álvares (1993). In addition, convergence tests were performed on the finite element meshes.
The results obtained with the numerical simulations were compared to the theoretical-analytical models proposed in CEB-FIB (2010). These comparisons are represented in Figures 7, 8, and 9.
From the analyses, it was possible to define that the constitutive model used in the steel guaranteed the expected behavior, presenting only a minor deviation at the beginning of the yield. Furthermore, Figures 8 and 9 also show adequate results for the modeled concrete.

The validated constitutive models were applied in a nonlinear numerical simulation of a reinforced concrete beam. For this, a 3D modeling was carried out in Abaqus®, using linear parallelepiped solid elements of 8 nodes (simulating concrete) and 3D bar elements (simulating steel bars and stirrups). Perfect adhesion between steel and concrete was considered.
The dimensions, reinforcement rate, load application, and elastic properties of the materials (Table 1) were extracted from Álvares (1993).
Convergence tests were performed on the structured finite element mesh. Thus, several linear analyzes were conducted, increasing the number of elements until the displacement at the center of the beam converged.
Table 1 Elastic properties of materials (Adapted from Álvares, 1993)
| Material | Poisson's ratio | Young's modulus (MPa) |
|---|---|---|
| Concrete | 0.2 | 29200 |
| Steel | 0.3 | 196000 |
The numerical analysis achieved a displacement of 8 mm in the center of the beam, corresponding to a load of approximately 47 kN.
Finally, the results were compared to those obtained in the experimental analysis by Álvares (1993) and to the theoretical model deduced by the authors, based on the cracking hypotheses proposed by Branson (1968) (Figure 10). Branson's model (1968) contemplates an average inertia, which considers the effects of cracking along the structural element, based on a semi-probabilistic analysis.
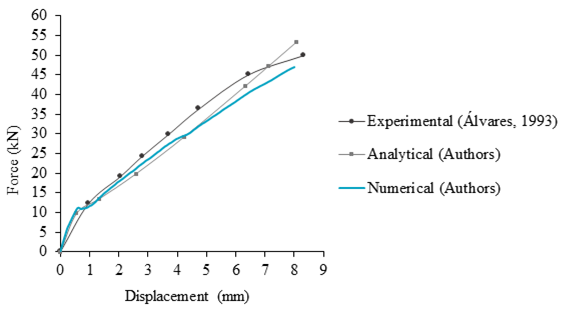
The numerical simulation presented similar results to the experimental analysis and the analytical model. However, slight divergences were observed, justified by the uncertainties associated with the concrete characterization parameters. Furthermore, there are significant differences between the boundary conditions adopted in the numerical model and those in the experimental test.
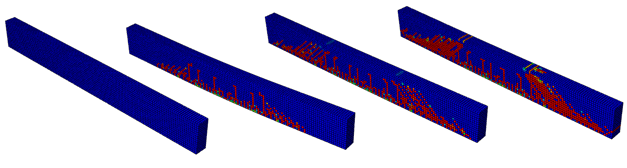
It was also possible to observe the evolution of the damage in the structure, represented in Figure 11. First, there was a development and propagation of cracks, until reaching a high state of degradation, in a very similar way to that observed by Álvares (1993) in his experimental analysis.
After confirming the efficiency of the constitutive models applied and the damage model used to represent the degradation of concrete, a new structure was modeled in Abaqus®. Corrosion has now been added to the new structure, as discussed in the following sections.
2.3 Modeling of the structure
This section presents the idealization of the studied structure, the strategy for the numerical simulation of the degradation caused by the corrosion, and the methodology for evaluating global stability. Information about the modeling in finite elements will also be given.
2.3.1 Geometric characteristics of the structure
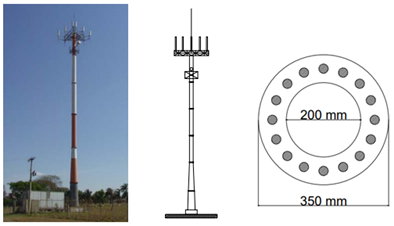
The proposed structure for the simulations is based on the one presented by Wahrhaftig (2008), Figure 12. It is a slender, hollow section structure in RC used to support a telephone transmission system. Although the dimensions reproduced in the numerical model are not the same as the real structure, the proportion of the slenderness was kept.
Thus, the structural element was modeled with a height of 14 m and is reinforced with 16 ϕ25 mm steel bars, arranged according to Figure 12.
The concrete and the steel bars were modeled with 8-node parallelepiped linear solid elements. The boundary conditions include a vertical load (5 kN) at the top, as a representation of the antennas, and a fixed set at the base.
Furthermore, the horizontal forces that characterize the wind load were added to the model in the form of forces every 1 m of the structure. Finally, the self-weight was considered (g = 9.81 m/s²), with the specific masses of concrete and steel equal to 2400 kg/m³ and 7850 kg/m³, respectively (ABNT NBR 6120:2019).
2.3.2 Wind load considerations
The wind was estimated through equations extracted from ABNT NBR 6123:1988 and applied to the structure as horizontal forces every meter.
Initially, the factor S 2 was calculated. This factor considers the influence of ground roughness, dimensions, and height of the building (Eq. (22)). The topographic (S 1 ) and statistical (S 3 ) factors take into account the slopes of the land and the use of the building, their values must be directly consulted in the code. Another essential variable is the basic wind speed (V 0 ), defined by the location of the structure. The V o allied to the factors S 1 , S 2 and S 3 determine the characteristic wind speed, V k (Eq. (23)).
Thus, after these definitions, the dynamic pressure (q) was calculated through Eq. (24); this value is useful for calculating horizontal forces.
Finally, the drag force (F a ), Eq. (25), took into account the drag coefficient (C a ), the reduction factor (K), the vertical distance between the forces (H), and the external diameter of section (D).
The F a values, calculated for each meter, were the horizontal forces applied.
where
where
where
2.3.3 Corrosion consideration
Corrosion was added in order to verify its influence on structural stability. The expansion generated by the corrosion products was represented through the application of radial displacements in pre-established extensions of the concrete in contact with the steel bars affected by corrosion. The corrosion points were chosen close to the maximum bending moment.
The method to define the values of the applied radial displacements was proposed by El-Maaddawy and Soudki (2007).
The hole flexibility constant (k) was obtained from Eq. (26). It is a constant that relates the radial displacement with the corrosion pressure, taking into account the porous zone present in the contact interface between the steel and the concrete. Physically, the porous region must initially be filled with corrosion products before the expansive stresses create pressure on the surrounding concrete.
For Eq. (26), it is necessary to define: the Poisson's ratio (ν), Young's effective modulus (E ef ), steel bars diameter (D), porous zone thickness (δ 0 ), concrete cover (C), and factor (Ψ) calculated with Eq. (27).
The radial pressure necessary to produce displacements in the concrete (P cor ) was calculated using Eq. (28), where the percentage of steel mass loss (m 1 ) varied according to the concrete strength. Finally, it was possible to define the displacement values in the concrete (δ c ) corresponding to the increase in volume generated by the rust (Eq. (29)).
The m 1 can be related to the mass of steel consumed per unit of length (M loss ) through Eq. (30), using the diameter (D) and the density of the steel bars (ρ s ).
2.4 Methodology for global stability assessment
Initially, three simulations were performed in Abaqus® to verify the stability of the structure with different concrete strengths (C20 to C50). The displacement at the top and the moment at the base were verified in each analysis.
The first step consisted of calculating the γ z coefficient according to ABNT NBR 6118:2014, Eq. (31), using data from the first analysis (named AN1). Thus, AN1 consisted of an elastic and linear analysis with a reduction of Young's modulus (E) by 20%.
The γ z coefficient depends on the moment at the base and the sum of the products between vertical forces and horizontal displacements obtained in the first-order analysis. This coefficient allows evaluating the importance of global second-order efects in the structure. Thus, if γ z < 1,1, the second-order effects can be neglected.
Additional information about the γz coefficient, including its mathematical deduction, can be consulted in the paper of Franco and Vasconcelos (1991).
The geometrically nonlinear analysis (GNA) was added to the AN1 model, producing the second analysis (AN2), where the reduction of Young's modulus was maintained at 20%.
From the moment values at the base, obtained in the first and second analysis (AN1 and AN2), a new coefficient γ z was calculated. The ∆M tot,d used was the difference between the moment obtained in the AN2 and AN1, while the M 1,tot,d was the moment of the first analysis (AN1). This calculation only confirmed the competence of the γ z coefficient as an estimator of second-order effects.
Finally, in the third analysis (AN3), the E was kept intact and material nonlinearity (MNA) and GNA was added to the model. The coefficient γ z , now renamed γ zcalc , Eq. (32), was calculated and will be presented in the results of this paper.
Therefore, in AN3, the constitutive and damage models replaced the reduction of Young's modulus by 20%.
where
where
Subsequently, corrosion was added to AN3, and eight more simulations were performed with each concrete class. Four analyses were performed on a model affected by corrosion in three steel bars in a 5 cm extension (AN4 to AN7). The other analyses were carried out in a model with corrosion action on five steel bars in a 10 cm extension (AN8 to AN11).
In both cases, corrosion was added at 30 cm from the base. In this step, the γ zcalc coefficient was calculated as described in Eq. (32).
Furthermore, the adhesion between the steel and the concrete was considered perfect, except for the regions degraded by corrosion.
The summary of the analyzes can be found in Frame 1.
Frame 1 Summary of analyzes performed
| Analysis | Description | |
|---|---|---|
| AN1 | Linear analysis with a 20% reduction of Young's modulus | 0.8E |
| AN2 | Geometric nonlinear analysis with a 20% reduction of Young's modulus | GNA and 0.8E |
| AN3 | Material and geometric nonlinear analysis without Young's modulus reduction | MNA, GNA, and E |
| AN4 a AN11 | Material and geometric nonlinear analysis with corrosion | MNA, GNA, and corrosion |
2.4.1 Finite element mesh
The finite element mesh comprised linear parallelepiped three-dimensional elements formed by six faces and eight nodes.
The mesh sizing applied to the model was performed through iterative simulations without nonlinearities. As a result, the number of finite elements was increased until the displacement at the top converged.
3. Results and discussions
Corrosion (m 1 ) was added to the model gradually, so the radial displacement was higher in each simulation with different concrete strength classes. The equivalence between the values of m 1 , the radial displacement applied to the concrete (δ c ), and the mass of steel consumed (M loss ) are represented in Table 2.
Table 2 Parameters used in the simulations
| Analysis | C20 e C30 | C40 e C50 | |||||
|---|---|---|---|---|---|---|---|
| m1 [%] | Radial displacement δc [μm] | Mloss [g/m] | m1 [%] | Radial displacement δc [μm] | Mloss [g/m] | ||
| 3 bars | AN3 | 0.091 | 0.00 | 3.51 | 0.091 | 0.00 | 3.51 |
| AN4 | 0.150 | 8.13 | 5.79 | 0.300 | 28.75 | 11.57 | |
| AN5 | 0.200 | 15.00 | 7.72 | 0.350 | 35.63 | 13.50 | |
| AN6 | 0.250 | 21.88 | 9.65 | 0.400 | 42.51 | 15.43 | |
| AN7 | 0.300 | 28.75 | 11.57 | 0.450 | 49.38 | 17.36 | |
| 5 bars | AN3 | 0.091 | 0.00 | 3.51 | 0.091 | 0.00 | 3.51 |
| AN8 | 0.105 | 1.94 | 4.05 | 0.125 | 4.69 | 4.82 | |
| AN9 | 0.110 | 2.63 | 4.24 | 0.138 | 6.41 | 5.31 | |
| AN10 | 0.115 | 3.31 | 4.44 | 0.150 | 8.13 | 5.79 | |
| AN11 | 0.120 | 4.00 | 4.63 | 0.163 | 9.85 | 6.27 | |
After the simulations, it was possible to verify that the two parameters analyzed (displacement at the top and moment at the base) increased with the m 1 , demonstrating that the evolution of corrosion generates a stiffness reduction, intensifying the second-order effects.
The moments at the base, obtained with the simulations, are represented in Figure 13.

Table 3 presents the calculated values of γ zcalc for the AN1, AN3, and AN7 simulations. The values shown for the corrosion simulations (AN7) were those obtained for degradation in 3 steel bars.
Table 3 Coefficient γ zcalc
| Concrete class | AN3 | AN7 | AN1 (NBR 6118:2014) | AN7 and AN1 ratio [%] |
|---|---|---|---|---|
| C20 | 1.0293 | 1.0302 | 1.0348 | 99.56 |
| C30 | 1.0276 | 1.0284 | 1.0330 | 99.56 |
| C40 | 1.0246 | 1.0260 | 1.0298 | 99.63 |
| C50 | 1.0237 | 1.0249 | 1.0287 | 99.63 |
Figure 14 relates m 1 to the calculated values of γ zcalc . It is possible to observe that in all concrete strength classes, γ zcalc increases as m 1 increases.

Table 3 and Figure 14 show that corrosion increased the γ zcalc coefficient in all concrete strength classes. Thus, considering that γ zcalc can be adapted to a coefficient of increase of first-order loads (NBR 6118:2014), it is possible to define that the addition of corrosion caused the intensification of second-order effects.
From the γ zcalc values obtained in AN7 and AN1, it was possible to define that the second-order effects with the corrosion correspond to 99.6% of those determined by NBR 6118:2014. Thus, the values obtained based on the Brazilian code proved to be higher, demonstrating that the stiffness reduction proposed can accommodate the corrosion level evaluated in this paper.
In addition, it was observed that concretes with lower strength suffer more from corrosion. The concretes with a higher f ck , even submitted to higher values of m 1 , presented lower γ zcalc results, demonstrating greater resistance to external actions and degradation.
Figure 15 shows images of a cross-section of the model in the region where corrosion was added, in 3 and 5 steel bars, with C40 concrete, respectively. The cracks in Figure 15 are represented by the tensile damage variable (damaget).
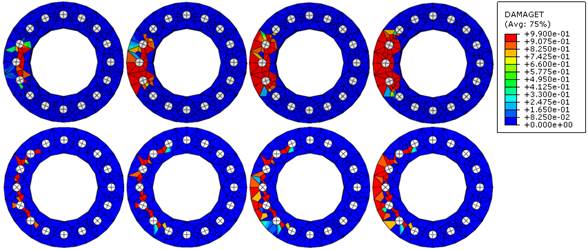
With the evolution of the damage, the numerical convergence is difficult, delimiting the corrosion values possible to be analyzed. Thus, it is noted that collapse can occur due to cross-section failure before the instability problem for a certain level of corrosion.
As observed by Pereira Junior et al. (2016), the damage was concentrated in the tensioned regions. Furthermore, as the cracking increased, the meeting of the microcracks led to the fracture of the material. Finally, the connection of cracks developed around the bars increased the second-order effects on the structure.
4. Conclusions
Corrosion degrades the steel and initiates a process of concrete deterioration, as the opening of cracks leaves the element susceptible to attack by external agents.
This paper reproduced a methodology for simulating and validating the mechanical behavior of structural elements in reinforced concrete. In addition, this study included the effect of corrosion, that is, the intensification of the cracking process due to the expansive product of corrosion.
The study concluded that corrosion negatively influences the stability of reinforced concrete elements, as it intensifies the global second-order effects.
The comparison between the γ z coefficient obtained with numerical simulations after corrosion and those calculated from NBR 6118:2014 indicated that the Brazilian code method is safe for the levels analyzed of corrosion.
However, numerical models also indicated that structural collapse could occur due to cross-section failure, even before the critical increase in second-order effects.
However, the stiffness reduction proposed by the Brazilian code must also consider the rheological effects of reinforced concrete. Therefore, the joint presence of these phenomena (corrosion + rheological effects) can lead the structure to a state not predicted by the numerical models presented. Consequently, it is recommended that future researchers analyze the rheological effects in the presence of intense levels of degradation to specify the level of security provided by the normative simplifications.

