


Services on Demand
Journal
Article
 text in
  English (pdf)
 Article in xml format
 Article references
 Send this article by e-mail
Indicators
-
 Cited by SciELO
 -
 Access statistics
Related links
-
 Similars in
SciELO
Similars in
SciELO
Share

 Permalink
Revista ALCONPAT
On-line version ISSN 2007-6835
Rev. ALCONPAT vol.5 n.3 Mérida Sep./Dec. 2015
Articles
Probabilistic analysis of the evolution of degradation of natural stone claddings applying Markov chains
1Departamento de Engenharia Civil, Arquitectura e Georrecursos, IST, Universidade de Lisboa
2Faculdade de Arquitectura, Universidade de Lisboa
3NTEC, University of Nottingham
The service life prediction models intend to extrapolate the future behaviour of building elements, anticipating the instant at which an intervention is required. Markov chains can be used to assess the future condition of the construction components and are applied in this study to model the service life of stone claddings (directly adhered to the substrate), based on visual inspections of buildings in service conditions. The degradation of stone claddings is evaluated using a discrete scale with five condition levels. In this study the probability of transition from degradation conditions and the time spent in each of these conditions are evaluated. This study also allows a better understanding of the influence of the exposure conditions on the evolution of degradation of the claddings under analysis.
Keywords: Markov chains; Service life prediction; Stone claddings
Los modelos de predicción de la vida útil intentan extrapolar el comportamiento futuro de los elementos de construcción, anticipando el punto en el que se requiere la intervención. Cadenas de Markov se pueden usar para evaluar la condición futura de los elementos de construcción y se utilizan en este estudio para modelar la vida útil de revestimientos pétreos, a partir de las inspecciones visuales de edificios en servicio. La degradación de los revestimientos pétreos se califica en una escala discreta de cinco niveles, y se evalúa la probabilidad de transición de condiciones de degradación. Este estudio también permite comprender la influencia de las condiciones de exposición en la evolución de la degradación de los revestimientos.
Palabras clave: Cadenas de Markov; predicción de la vida útil; revestimientos pétreos
Os modelos de previsão de vida útil procuram extrapolar o comportamento futuro dos elementos construtivos, antevendo o momento a partir do qual é necessário intervir. As cadeias de Markov permitem avaliar a condição futura dos elementos da construção, sendo utilizadas no presente estudo, na modelação da previsão da vida útil de revestimentos pétreos (fixados directamente ao suporte), a partir de inspecções visuais de edifícios em serviço. A degradação dos revestimentos pétreos é classificada numa escala discreta composta por cinco níveis, sendo avaliada a probabilidade de transição entre condições de degradação e o tempo de permanência em cada uma dessas condições. O presente estudo permite ainda compreender a influência das condições de exposição na evolução da degradação deste tipo de revestimentos.
Palavras-chave: cadeias de Markov; previsão da vida útil; revestimentos pétreos
1. INTRODUCTION
The degradation is a complex and dynamic process, in which agents and degradation mechanisms act synergistically and are in constant permutation. The current and future state of buildings are associated with different degrees of uncertainty. To overcome this difficulty, sometimes it is necessary to use a stochastic approach in service life prediction (Frangopol et al., 2004). In general, this approach has a high complexity and is based on the premise that the deterioration is a process ruled by random variables (Moser, 2003). Thus, the degradation can be seen as a continuous loss of performance process, which evolves probabilistically over time. The degradation phenomena can also be described as the transition between consecutive states, characterized by different degradation levels (Basso et al., 2012). Markov chains are one of the methods that allows predicting (in a stochastic way) the future condition of the façade claddings. Markov chains simulate the evolution of the buildings degradation state, allowing defining the probability of the future performance of a construction element based only on their current performance, ignoring the history of deterioration and maintenance of the building, their age, and other parameters (Neves et al., 2006).
In this study, a model based on Markov chains is proposed to predict the service life of stone claddings, which allows estimating the probability distribution of each of the degradation conditions over time (as well as the average time of permanence in each degradation condition). Additionally, the influence of some characteristics of stone claddings is analysed, aiming to understand the influence of this characteristics in the claddings' degradation process. This methodology is central to the built environment maintenance, once it provides data for the most probable time for claddings' failure according to its characteristics, and the ages in which is extremely unlikely that the rupture of these elements occurs. Using this method it is then possible to comprise the notion of risk associated with the failure of claddings, thus enabling the definition of maintenance plans and warranty periods by insurance companies.
2. DEGRADATION OF STONE CLADDINGS
Markov chains are based on a set of discrete states that characterize the buildings' performance. There are various methods for evaluate the deterioration state of buildings and components that vary according to the hierarchical classification of building elements, the hierarchical classification of defects and the setting condition parameters associated with defects (Straub, 2003). Different authors (Balaras et al., 2005; Shohet et al., 1999) established classification systems or degradation scales to describe the visual and functional deterioration of the elements under analysis; usually, these systems include the classification of defects across a range of discrete variables that vary from the most favourable condition level (no visible degradation) to the most unfavourable situation (extensive degradation or loss of functionality). In this study, it is adopted a scale with five degradation levels, ranging between condition A - no visible degradation - and condition E - generalized degradation. This classification relays the degradation state of stone claddings, according to the physical and visual assessment of façades at the inspection time ("Table 1").
Table 1 Proposed degradation levels for natural stone claddings
| Physical and visual degradation | Degradation condition |
|---|---|
| No visible degradation | Condition A |
| Visual or surface degradation defects ( 15% Loss-of-integrity defects ( 20% | Condition B |
| Visual or surface degradation defects ( 30% Joint defects ( 30% Bond-to-substrate defects( 20% Loss-of-integrity defects ( 20% | Condition C |
| Visual or surface degradation defects > 30% Joint defects > 30% Bond-to-substrate defects > 20% Loss-of-integrity defects ( 20% | Condition D |
| Bond-to-substrate defects > 20% Loss-of-integrity defects > 20% | Condition E |
3. EXPERIMENTAL PROCEDURE
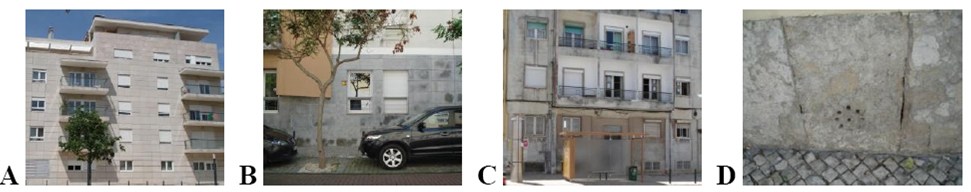
In this study, 203 natural stone claddings (directly adhered to the substrate) in-use conditions were inspected. The degradation condition of the claddings analysed is evaluated through visual inspections, assessing in situ the characteristics of the claddings, their condition (according to the scale described in "Table 1", which gives to the claddings inspected a given level of degradation based on the area of stone affected by a given set of defects), their environmental exposure and maintenance conditions. The sample comprises buildings of the nineteenth and twentieth centuries, intended for different uses: housing, commerce and services. The sample was randomly selected; however, it is tried to get a coherent and representative sample of the type of natural stone present in the Portuguese claddings. Additionally, the sample presents a wide range of ages, in which the youngest building only has 1 year and the oldest building has 82 years, allowing a more precise evaluation of the claddings' aging process. In this study, it is assumed that age is given by the period of time elapsing since the last generalized rehabilitation action to the inspection date (since an intervention in the cladding should restore the initial characteristics, thus restarting its degradation process). In the sample analysed, none of the case studies belongs to the most unfavourable degradation condition (condition E). "Figure 1" illustrates the different degradation conditions, characterized in "Table 1".
4. PROBABILISTIC ANALYSIS OF DEGRADATION OF NATURAL STONE CLADDINGS OVER TIME
In this study, the optimization of the infinitesimal generator matrix Q is carried out using the function fmincon (constrained nonlinear optimization) available in MATLAB, which provides the transition between degradation states, depending on the original state and the transition rate between the current and future state. Based on the transition rates, the probability of transition between states of condition and the mean probability of permanence in these states can be computed using Chapman-Kolmogorov differential equation. For this, in this study, the active-set numerical algorithm present in fmincon is used (Kalbfleisch and Lawless, 1985). To increase the stability of the optimization algorithm, in this case the logarithm of the likelihood was maximized as shown in equation (1) (Fletcher and Powell, 1963; Carrington et al., 2005; Higham and Higham, 2005). The matrix Q obtained for stone claddings is given by equation (2).
 1
1
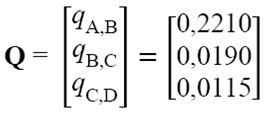 2
2
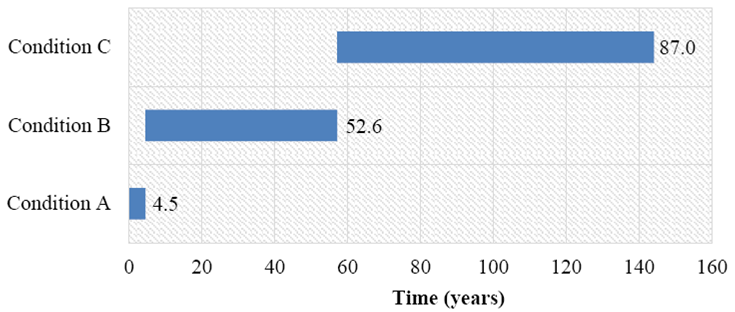
Based on the estimation of the intensity matrix (Q), the mean time of duration in each degradation state can be determined ("Figure 2"). Transitions between condition states of stone claddings occur faster for less deteriorated claddings. This results is directly related with the definition of the degradation states. Certainly, the transition between degradation states is not made uniformly, since the condition states follow a scale that is also irregular. The degradation condition A (more favourable) corresponds to a stone cladding without visible deterioration and, therefore, for a stone cladding transit to the following condition it is only necessary that the cladding presents changes in its surface or stains. Therefore, it seems reasonable that the transition from condition A to the next condition occurs only after 4.5 years. The transition between levels associated with higher degradation states imply the presence of a larger number of defects and/or more hazardous defects, including simultaneous occurrence of defects and synergies between them.
The probabilistic distribution of the degradation condition of stone claddings over time is presented in "Figure 3".
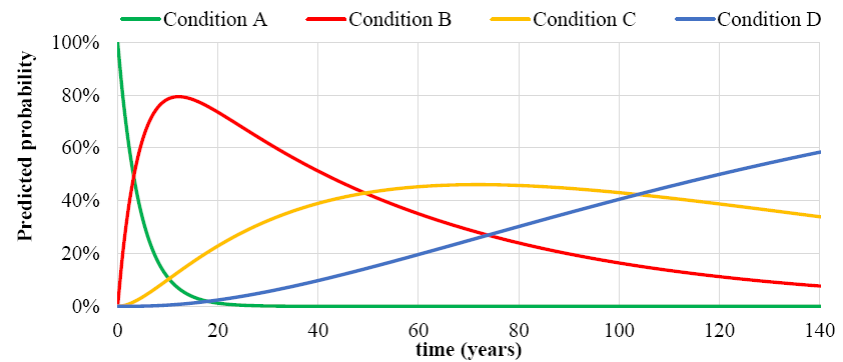
Figure 3 Probabilistic distribution of the degradation condition for stone claddings according to the age of the case studies
The probability of belonging to condition A decreases rapidly over time, being practically nil (lower than 2%) at year 8. The maximum probability (79.2%) of being in condition B is reached at age 12, decreasing after that. Regarding condition C, it is reached a peak of maximum probability of belonging to this condition between 71 and 73 years (with a probability of 46.1%). The probability of belonging to condition D increases over time: after being practically nil until year 41, it reaches 60% after year 145.
"Table 2" shows the probabilistic distribution of the degradation condition of stone claddings over time.
Table 2 Probability of belonging to a condition as a function of the age for stone claddings
| Range in years | Probability of belonging to a condition level | |||
|---|---|---|---|---|
| Condition A | Condition B | Condition C | Condition D | |
| [0:10] | 41.81% | 53.94% | 4.11% | 0.14% |
| ]10:20] | 3.95% | 77.34% | 17.32% | 1.40% |
| ]20:30] | 0.43% | 67.08% | 28.42% | 4.07% |
| ]30:40] | 0.05% | 55.84% | 36.29% | 7.83% |
| ]40:50] | 0.00% | 46.23% | 41.42% | 12.34% |
| ]50:60] | 0.00% | 38.25% | 44.44% | 17.31% |
| ]60:70] | 0.00% | 31.65% | 45.82% | 22.53% |
| ]70:80] | 0.00% | 26.18% | 45.98% | 27.84% |
| ]80:90] | 0.00% | 21.66% | 45.23% | 33.11% |
| ]90:100] | 0.00% | 17.92% | 43.83% | 38.25% |
| ]100:110] | 0.00% | 14.82% | 41.97% | 43.21% |
| ]110:120] | 0.00% | 12.27% | 39.81% | 47.93% |
| ]120:130] | 0.00% | 10.15% | 37.47% | 52.39% |
| ]130:140] | 0.00% | 8.39% | 35.04% | 56.57% |
| ]140:150] | 0.00% | 6.94% | 32.58% | 60.47% |
At years 3 to 4 the probability of condition A is practically the same as that of condition B. After years 49 to 50 the probability of any case study of being in condition B is similar to that of being in condition C. Between years 103 and 104 the probability of belonging to condition C is similar to that of condition D. In these time intervals, there is a maximum probability of transition between one degradation condition to the next one.
To evaluate the efficiency of the model obtained using Markov chains, the number of expected and observed façades in each condition state is compared ("Table 3"). The percentage error obtained is relatively low, given the complexity of the phenomenon under analysis.
5. PROBABILISTIC ANALYSIS OF THE DEGRADATION OF STONE CLADDINGS ACCORDING TO THEIR CHARACTERISTICS
The characteristics of stone claddings significantly affect their durability. Therefore, various models using Markov chains are defined in order to analyse the probability of belonging to each degradation condition over time according to the characteristics analysed. Thus, the following variables are considered: (a) type of stone; (b) type of finishing; (c) size of stone plates; (d) exposure to damp; (e) and distance from the sea. The analysis of the results is performed in Section 6, being made some considerations regarding the durability of stone claddings according to their characteristics.
5.1 Type of stone
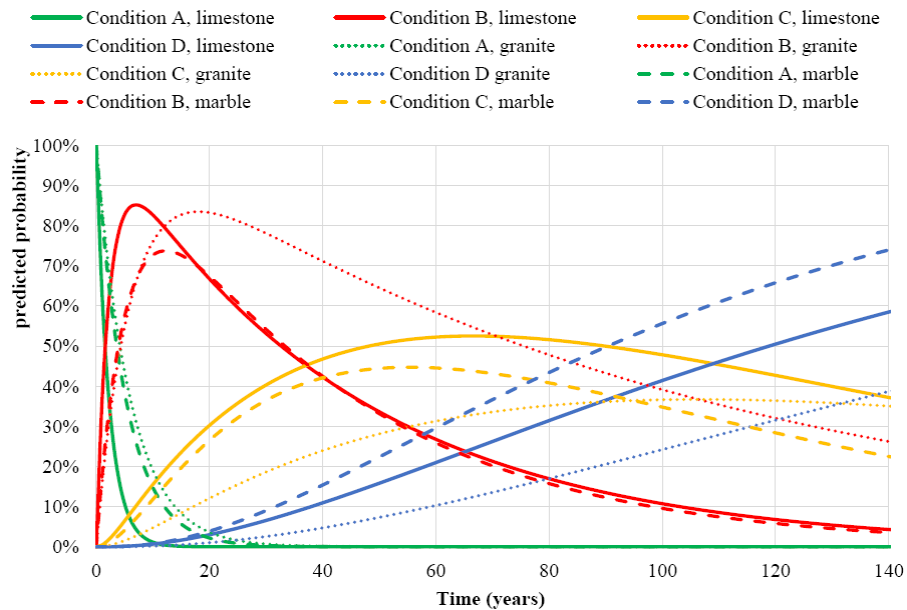
Koch and Siegesmund (2004) refers that the durability is an essential requirement to be considered when specifying the natural stones used as cladding material, especially in exterior claddings exposed to environmental degradation agents. Therefore it seems relevant to analyse the influence of the type of stone in the stone claddings' degradation process. "Figure 4" presents the probabilistic distribution of the degradation condition over time for stone claddings according to the type of stone. Limestone claddings remains for the lowest period of time in condition A; for the other types of stone, the mean time of permanence in this condition is similar. At condition B, limestone claddings reach a maximum probability (85.2%) at 7 years of age; marble claddings reach this peak (73.7%) at 12 years and granite claddings at 18 years (P = 83.5%). Marble claddings reach a maximum probability (44.7%) of belonging to condition C after 55 to 56 years; limestone claddings reach this peak (52.5%) after 66 to 67 years and granite claddings after 105 to 108 years (P = 36.7%), i.e. considerably later. The highest probability of transition between conditions B and C occurs: between 37 and 38 years for limestone claddings; between 40 and 41 years for marble claddings; and between 106 and 108 years for granite claddings.
5.2 Size of stone plates
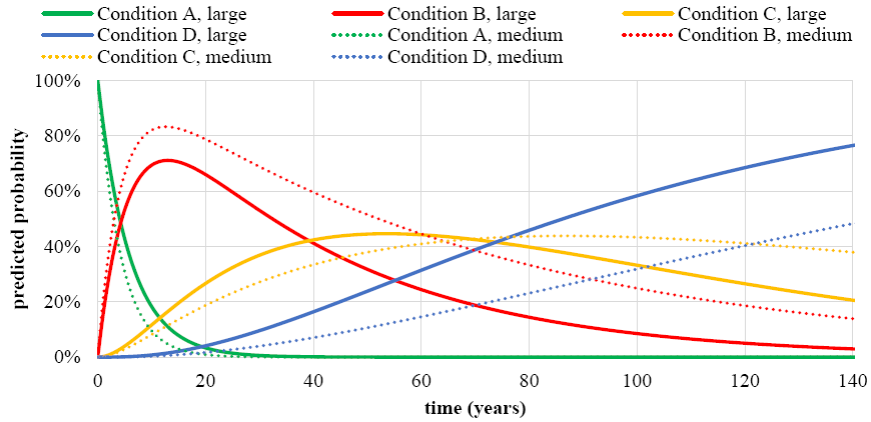
"Figure 5" presents the probabilistic distribution of the degradation condition over time according to the size of the stone plates. Stone claddings with large plates (A ≥ 0.4 m2) reach the maximum probability (71.1%) of belonging to condition B at 13 years of age and the maximum probability (44.6%) of belonging to condition C is reached at 53 to 54 years. These claddings have a maximum probability of transition between conditions B and C after 39 to 40 years and a maximum probability of transition between conditions C and D after 73 to 74 years. On the other hand, claddings with medium-size plates (A < 0.4 m2) reach the maximum probability (83.2%) of belonging to condition B at 13 years of age and the maximum probability (43.8%) of belonging to condition C is reached at 86 to 88 years. For these claddings, the maximum probability of transition between conditions B and C occurs after 64 to 65 years and the maximum probability of transition between conditions C and D occurs after 121 to 122 years.
5.3 Exposure to damp
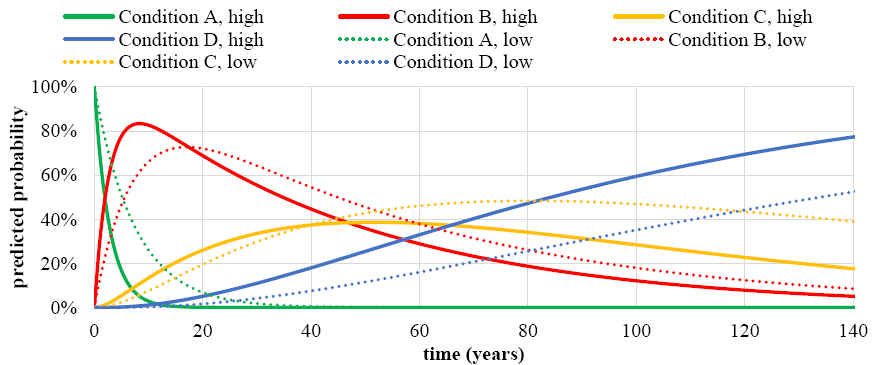
Figure 6 shows the probabilistic distribution of the degradation condition over time for stone claddings according to their exposure to damp. Regarding the definition of damp exposure conditions two categories are considered: (i) low exposure, for buildings located in urban context, located at more than 5 km from the sea and without influence of prevailing winds; (ii) buildings in coastal areas without protection of the combined action of wind and rain. Claddings highly exposed to damp remain less time in the most favourable condition (A). Claddings highly exposed reach the maximum probability (83.3%) of belonging to condition B at 8 years of age and of belonging to condition C (38.7%) at 51 to 52 years. Claddings less exposed reach the maximum probability (72.7%) of belonging to condition B after 17 years and the maximum probability (48.4%) of belonging to condition C after 80 years.
5.4 Distance from the sea
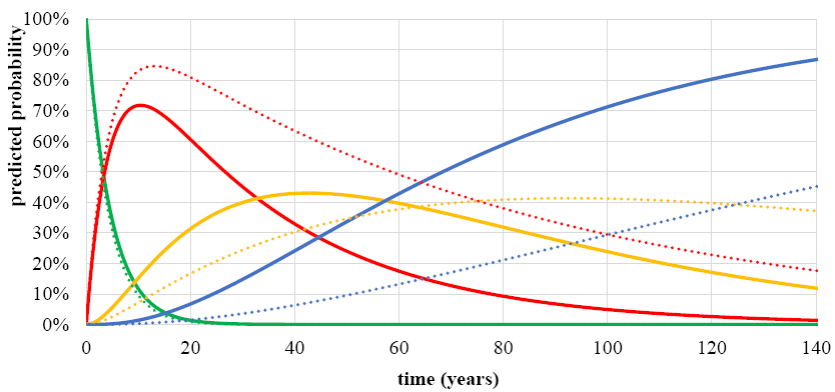
"Figure 7" presents the probabilistic distribution of the degradation condition over time for stone claddings according to their distance from the sea. The probability and mean time of permanence in condition A is similar for claddings located more than 5 km and less than 5 km. Claddings in coastal areas reach the maximum probability (71.7%) of belonging to condition B at 10 years of age and the maximum probability (43.1%) of belonging to condition C at 43 years. Claddings located more than 5 km away from the sea have a maximum probability (84.6%) of belonging to condition B after 80 years and a maximum probability (41.3%) of belonging to the condition C after 92 to 94 years.
6. RESULTS DISCUSSION
"Table 4" shows the probability of belonging to a degradation condition as a function of the variables considered for stone claddings. The results obtained are coherent, make sense from a physical point of view and they lead to the following conclusions (valid for the sample analysed):
Granite claddings have a 94.4% probability of belonging to the more favourable conditions of degradation (A and B), and no probability of belonging to condition D; marble claddings are those with lower probability of belonging to the most favourable conditions and greater probability of being in the most unfavourable degradation condition (E); these conclusions confirm the results obtained in previous studies, which indicates that granite claddings are the most durable, reaching the end of their service life later, followed by limestone claddings and marble claddings (the least durable);
Claddings with medium-size plates have higher probability of belonging to more favourable conditions and a low probability of belonging to condition E; this suggests that larger plates reach the end of their service life sooner, especially when compared with medium-size plates; this can be explained by the lower relative area of the joints in the bigger plates and consequent higher concentration of stresses due to the larger area of each plate and the greater stress needed to guarantee the adherence of the material (Silva et al., 2012);
Claddings highly exposed to damp are more likely to belong to the highest degradation condition (P = 14.3% as opposed to coatings less exposed, with 9.2%); these claddings also present a higher probability (although in a small significant level) of belonging to the most favourable conditions (A and B);
Claddings located more than 5 km away from the sea are more prone to belonging to degradation conditions A and B (P = 68.6% as opposed to 51.9% for coatings located less than 5 km away); claddings in coastal areas have a higher probability of belonging to the more serious condition of degradation (P = 26%, substantially higher than those away from the coast, with 2.5%).
Table 4 Probability of belonging to a condition as a function of the variables considered relevant for natural stone claddings
| Variables | Probability of belonging to a condition level | ||||
|---|---|---|---|---|---|
| Condition A | Condition B | Condition C | Condition D | ||
| Type of stone | Limestone | 4.2% | 45.8% | 38.9% | 11.1% |
| Granite | 5.6% | 88.9% | 5.6% | 0% | |
| Marble | 3.9% | 42.9% | 33.8% | 19.5% | |
| Size of stone plates | Large | 1.4% | 40.5% | 33.8% | 24.3% |
| Medium | 6.2% | 65.1% | 24.8% | 3.9% | |
| Exposure to damp | High | 6.0% | 60.7% | 19.0% | 14.3% |
| Low | 3.4% | 52.9% | 34.5% | 9.2% | |
| Distance from the sea | Less than 5 km | 7.8% | 44.2% | 22.1% | 26.0% |
| > 5 km | 2.5% | 66.1% | 28.9% | 2.5% | |
The upper and lower limits of conditions C and D correspond respectively to the maximum allowable degradation level, considered in this study as being the end of service life of stone claddings. Therefore, the maximum probability of transition between conditions C and D marks the moment with the highest probability of stone claddings reaching the end of their service life. For the overall sample, the maximum probability of transition between conditions C and D occurs between 103 and 104 years. Regarding the type of stone, the highest probability of transition between conditions C and D occurs: at age 109 for limestone claddings; between 77 and 78 years for marble claddings; and between 131 and 132 years for granite claddings. The results reveals that granite claddings are the most durable, followed by limestone and marbles claddings. These results confirm the study by Schouenborg et al. (2007), who tested the mechanical resistance of the samples from 200 case studies (through laboratory tests and in situ analysis), obtaining similar conclusions. Claddings with medium-size plates transit between conditions C and D significantly later (between 121 and 122 years) than claddings with large plates (between 73 and 74 years). Concerning the exposure to damp, the transition between conditions C and D is more prone to occur between 65 and 66 years for claddings with high exposure and between 118 and 119 years to claddings with low exposure. These results confirm that claddings with high exposure tend to present higher degradation levels. Regarding the distance from the sea, for claddings in coastal areas, the transition between the conditions B and C has a higher probability of occurrence between 32 and 33 years, while the transition between conditions C and D is more likely to occur between 57 and 58 years. Claddings away from the coast (over 5 km) has a maximum probability of transition between conditions B and C between 75 and 76 years and the maximum probability of transition between conditions C and D occurs between 124 and 125 years. Thus revealing that claddings in coastal areas are more prone to possess more severe degradation indexes due to the exposure to winds that contain harmful marine salts that compromises the integrity of natural stone.
The probabilistic distribution of degradation conditions over time can be seen as an assessment of risk of loss of performance due to degradation. Therefore, by establishing a threshold of acceptable risk, a stakeholder may estimate the need for re-pair based on the probabilistic analysis of a set of data. To illustrate this concept, one can consider that "high", "average" and "low" probabilities of a given condition correspond to "high", "average" and "low" risks associated to the consequences of the defects and the cost of repair and thus produce an indication of the urgency to maintenance and repair actions. Low risk (no actions required apart from monitoring) may correspond to P > 75% of belonging to either condition levels "A" or "B". High risk (need to extensive repair) may correspond to P > 25% of belonging to condition levels "D" and average risk may correspond to the intermediate states. The interpretation of the results, which depends on the assumptions made previously, leads to the following recommendations: i) monitor until year 20; ii) perform light maintenance actions before year 70; iii) consider their replacement after year 70, subject to on-site confirmation of their condition state.
7. CONCLUSION
In service life prediction models, it is relevant to know the rate of transition between degradation conditions, foreseeing the behaviour of the element under analysis and predicting the instant at which it will be unable to meet the requirements for which it was designed.
In this study, the future performance of stone claddings is predicted through the application of a Markov chain model, corresponding to a stochastic approach widely used to modelling the durability of buildings and its elements, which requires little information on its calibration. The proposed models are able to provide information regarding a complex phenomenon such as the claddings degradation, giving information on the synergy between the degradation agents (as in the case of environmental exposure conditions) and the degradation conditions. Additionally, this study provides information on the probabilistic distribution of the degradation condition for stone claddings over time (and according to their characteristics). Also, the knowledge of the average time of permanence in each degradation condition allows analysing the effects of degradation agents in the durability of stone claddings. This information is extremely useful to define (in a technically and rational manner) a set of maintenance strategies throughout the building's life cycle. When this type of information is available for different building components, it is possible to define common maintenance strategy for the different parts of the building. Stochastic models, such as Markov chains provides crucial information in the context of insurance policies, since they allow the assessment of the risk of failure of the claddings in order to evaluate the most probable time to failure of building elements according to their characteristics.
Referencias
Balaras, A., Droutsa, K., Dascalaki, E., Kontoyiannidis S. (2005) "Deterioration of European apartment buildings", Energy and Buildings, Vol. 37, No. 5, pp. 515-527. [ Links ]
Basso, N., Garavaglia, E., Sgambi, L. (2012) "Selective maintenance planning based on a Markovian approach", IALCCE - International Association for life-cycle Civil Engineering, 3rd International Symposium on Life-Cycle Civil Engineering, Vienna, Austria, pp. 435-441. [ Links ]
Carrington, P.J., Scott, J., Wasserman, S. (eds.) (2005) "Models and methods in social network analysis" (New York, USA, Cambridge University Press). [ Links ]
Fletcher, R., Powell, M.J.D. (1963) "A rapidly convergent descent method for minimization", Computer Journal, V. 6, pp. 163-168. [ Links ]
Frangopol, D.M., Kallen, M.-J., Noortwijk, J.M.V. (2004) "Probabilistic models for life-cycle performance of deteriorating structures: review and future directions", Progress in Structural Engineering and Materials, Vol. 6, No. 4, pp. 197-212. [ Links ]
Higham, D., Higham, N. (2005) "MATLAB guide" (Philadelphia, USA, Society for Industrial Mathematics). [ Links ]
Kalbfleisch, J.D., Lawless, J.F. (1985) "The analysis of panel data under a Markov assumption", Journal of the American Statistical Association, Vol. 80, No. 392, pp. 863-871. [ Links ]
Koch, A., Siegesmund, S. (2004) "The combined effect of moisture and temperature on the anomalous expansion behaviour of marble", Environmental Geology, Vol. 46, No. 3-4, pp. 350-363. [ Links ]
Moser, K. (2003) "Engineering design methods for service life planning - State of the art", International Workshop on Management of Durability in the Building Process, Politecnico di Milano, Milan, Italy, paper 40. [ Links ]
Neves, L. C., Frangopol, D. M., Cruz, P. J. S. (2006) "Lifetime multi-objective optimization of maintenance of existing steel structures", 6th International Symposium Steel Bridges, European Convention for Construction Steelwork, Prague, Czech Republic, pp. 206-215. [ Links ]
Schouenborg, B., Grelk, B., Malaga, K. (2007) "Testing and assessment of marble and limestone (TEAM) - Important results from a large European research project on cladding panels", ASTM International, Vol. 4, No. 5, pp. 10-22. [ Links ]
Shohet, I., Rosenfeld, Y., Puterman, M., Gilboa, E. (1999) "Deterioration patterns for maintenance management - a methodological approach", 8th DBMC, Conference on Durability of Building Materials and Components; Ottawa, Canada, pp.1666-1678. [ Links ]
Silva, A., Brito, J. de, Gaspar, P. L. (2012) "Application of the factor method to maintenance decision support for stone cladding", Automation in Construction, Vol. 22, pp. 165-174. [ Links ]
Straub, A. (2003) "Using a condition-dependent approach to maintenance to control costs and performances", Facilities Management, Vol. 1, No. 4, pp. 380-395. [ Links ]
Received: March 16, 2015; Accepted: August 18, 2015
 Este es un artículo publicado en acceso abierto bajo una licencia Creative Commons
