


 nueva página del texto (beta)
 Inglés (pdf)
 Artículo en XML
 Referencias del artículo
 Enviar artículo por email
 Citado por SciELO
  Similares en
SciELO
Similares en
SciELO 
 Permalink
Forest tree species of the Tropical Montane Cloud Forest (TMCF) are highly vulnerable to anthropogenic habitat changes, such as deforestation, fragmentation, and degradation, as many tree species are restricted endemics with slow natural regeneration (González-Espinosa et al. 2011). The TMCF is likewise threatened by global climate warming due to the increase in temperature and changes in precipitation patterns that will affect its cloud and mist formation (Ponce-Reyes et al. 2012). In Mexico, the TMCF occurs between 1,500 and 2,500 meters above sea level with a patchy distribution on steep slopes (Rzedowski 1978). This terrestrial ecosystem comprises Mexico's highest biodiversity per unit area despite covering less than 1 % of the national territory (Rzedowski 1996). Unfortunately, 52 % of the TMCF have been transformed into degraded or secondary forests (Challenger et al. 2009), and currently, 60 % of its tree species are under some threat category within the IUCN Red List (González-Espinosa et al. 2011).
Selective logging is a common activity in the TMCF of Mexico despite its low productivity for fuelwood and timber production (Rüger et al. 2008, Toledo-Aceves et al. 2011). Although this practice can be less invasive than deforestation, selective logging can impact the process of forest regeneration and the population dynamics of pollinators, seed dispersers, and other animal interactions (Negrete-Yankelevich et al. 2007, Farwig et al. 2008, Clark & Covey 2012, Toledo-Aceves et al. 2021) and the local genetic makeup of successive generations of forest trees (Degen et al. 2006, Sebbenn et al. 2008, Carneiro et al. 2011, Vinson et al. 2015). For instance, canopy openness and changes in plant density can affect the microenvironmental conditions for seedling establishment and seed bank formation (Lobo et al. 2007, Anthelme et al. 2011, Álvarez-Aquino et al. 2005), causing a decrease in late successional trees (Farwig et al. 2008, Clark & Covey 2012). Moreover, a reduction of gene dispersal by pollen flow and seed dispersal and the decline in the number of reproductive individuals can decrease genetic diversity (Aguilar et al. 2019) and increase the spatial clustering of genetically related individuals at the local scale in a pattern known as fine-scale genetic structure (FSGS) (Degen et al. 2006, Ng et al. 2009, Alcalá et al. 2015). FSGS results from the combination of microevolutionary forces of genetic drift, selection, and adaptation that interact at the local scale (Kalisz et al. 2001). FSGS is fundamental in plant populations' ecology and evolutionary dynamics as it can decrease effective population size, reduce offspring fitness, and consequently affect long-term population persistence (Leimu et al. 2006, Jacquemyn et al. 2012). Moreover, it is also relevant for the conservation and management of forest ecosystems because it allows us to analyze the distribution of genetic variation at fine spatial scales for the identification of seed sources and to assess whether forest restoration has been successful at disturbed sites (Smith et al. 2018).
Empirical evidence has shown that the intensity and spatial extent of FSGS may primarily depend on intrinsic factors, such as pollination and seed dispersal vectors, plant density, life form, mating system, and life stage (Vekemans & Hardy 2004, Dick et al. 2008, Kloss et al. 2011, Hoban et al. 2014, Gelmi-Candusso et al. 2017). However, extrinsic factors, such as habitat disturbance and selective logging may also play an important role (Ismail et al. 2012, Hoban et al. 2014, Alcalá et al. 2015, Kitamura et al. 2018). Empirical studies so far have shown contradicting findings. For instance, a significant pattern of FSGS in sites subject to selective logging was observed for the tropical rainforest trees Hopea dryobalanoides Miq. and Shorea parvifolia Dyer, while no effect was found for the tropical trees Shorea acuminata Dyer (Takeuchi et al. 2004), Carapa guianensis Aubl. (Cloutier et al. 2007) and Erythrophleum suaveolens (Guill. & Perr.) Brenan (Duminil et al. 2016). These varying results may imply an interaction between the species’ life history traits, the disturbance history, and the ecological context of each site, thereby complicating generalizations.
Contrasting patterns of FSGS from seedlings to adults in regeneration sites after selective logging may be expected if seed dispersal patterns, seedling establishment, and the number of reproductive individuals differ between pre- and post-disturbance conditions (Kitamura et al. 2018). Other demographic processes, such as self-thinning can also influence differential patterns of FSGS among life stages (Chung et al. 2007). FSGS analyses across cohorts provide better insights into the population dynamics occurring in forest regeneration sites following habitat disturbance. In this context, a significant pattern of FSGS and reduced genetic diversity was found for juveniles relative to adults of the tropical tree Swietenia macrophylla King, suggesting a negative effect of selective logging in the younger generations succeeding the logging event (Alcalá et al. 2015). Similarly, significant FSGS in seedlings, saplings, and juveniles, but not in mature trees, was observed for Picea jezoensis (Siebold & Zucc.) Carr. in regeneration sites, which was attributed to different colonization histories between early and late life stages (Kitamura et al. 2018). Studies of FSGS in TMCF forest tree species are scarce (e.g.,Quevedo et al. 2013), while the effects of FSGS due to selective logging have not yet been documented for any TCMF forest tree species.
Magnolia iltisiana A. Vazquez is an endemic tree associated with remnant fragments of the TMCF in Jalisco and Michoacán in the west of Mexico. It is classified as vulnerable in the Red List of Magnoliaceae (Rivers et al. 2016) and as threatened in the NOM-059-SEMARNAT (SEMARNAT 2010). It is considered a late successional TMCF species of low natural regeneration (Sánchez-Velázquez & García-Moya 1993, Saldaña Acosta 2001). Nothing is known about seed dispersal, although as in other Magnolia L. species, it may be carried out by birds and small mammals (Watanabe et al. 2002) despite their restricted gene flow and spatial aggregation (Rico & Gutiérrez-Becerril 2019, Aldaba-Núñez et al. 2021, Chávez-Cortázar et al. 2021). In this study, we investigated patterns of FSGS of M. iltisiana at the Sierra de Manantlán Biosphere Reserve (SMBR) in Jalisco, where prior to the establishment of the SMBR, the species was subjected to a history of selective logging from 1960 to 1985. Selective logging consisted of removing mature trees from the forest that measured 25-30 meters in height and 100-250 cm in diameter, which we confirmed in the field by the presence of tree stumps. Furthermore, several clearings were opened because roads were built for transporting the wood (Jardel 1991). We sampled four age classes (seedlings, saplings, juveniles, and adults) of M. iltisiana in three TMCF sites to ask the following questions: (i) In regeneration sites with a history of selective logging, does FSGS differ from a site without such a history? (ii) Is FSGS stronger in seedlings and saplings relative to juveniles and adults at regeneration sites? (iii) Is genetic diversity similar among life stages and sites? The strength of FSGS is expected greater in regeneration sites with a history of selective logging because it can restrict seed dispersal and reduce the availability of reproductive congeners, resulting in higher kinship. Moreover, we expect stronger FSGS in seedlings and saplings compared to adults. Since habitat fragmentation and disturbance can negatively affect the genetic diversity of succeeding generations, seedlings and saplings may have lower genetic diversity than adults (Vranckx et al. 2012, Alcalá et al. 2015, Aguilar et al. 2019).
Materials and methods
Target species, study area, and sampling. Magnolia iltisiana is a perennial tree of 20 to 40 m in height. It has gray bark and coriaceous leaves, elliptic to oblong-lanceolate, lustrous green on the ventral side, and pale green on the dorsal side. Flowering occurs from March to July, with chrysomelid beetles as pollinators. Seeds are predated by squirrels, which might contribute to their dispersal (Vázquez-García 1994).
The SMBR is in the southwest of the state of Jalisco and northeast of Colima. It has a total range of 139,577 ha and has three core conservation areas: Manantlán-Las Joyas, El Tigre, and Cerro Grande (Ejecutivo Federal 1987, Carabias et al. 2000, Carranza & Rhodes 2010, UNESCO-MAB 2012). A high level of biodiversity is found in the SMBR, as it supports 8 % of vascular plants, 36 % of bird species, and 26 % of mammals found in Mexico (UNESCO-MAB 2012). The natural vegetation of the SMBR has been modified by anthropogenic activities, such as agriculture, livestock grazing, forest fires, and commercial logging. Timber from M. iltisiana, Juglans major (Tor.) A. Heller, Ilex brandegeeana Loes., and Fraxinus uhdei (Wenz.) Ligelsh was harvested via selective logging, while intensive logging was restricted to pine forests in the SMBR (Jardel 1991). Forest succession is characterized by the establishment of pines and oaks, followed by latifoliate species, and culminates with slow-growing latifoliates, such as M. iltisiana and Aiouea pachypoda (Nees) R. Rohde (Sánchez-Velázquez & García-Moya 1993, Saldaña Acosta 2001), which take over ten years to produce seeds as suggested for M. grandifolia L., a related North American species (Burns & Honkala 1990). During 2020, we identified three sites (S1-S3, Figure 1) in Las Joyas Scientific Station (LJSS) with varying species composition and structure that were subject to selective logging before establishing the LJSS. Selective logging in the LJSS started in 1960 and ended with its foundation in 1985, in which adult trees of valued timber species were removed. To characterize the three sampling sites, we recorded: (i) the main plant species, (ii) the life stages of M. iltisiana, and (iii) the presence of big clearings with the occurrence of old tree stumps. Each study site was suggested by field technicians of the LJSS based on their knowledge of the research station's vegetation history and restoration status, and where M. iltisiana is frequent because it is not found everywhere. The classification of the sites comprised a site without a history of selective logging, which here we named the conserved site (S1) as it was characterized by the abundance of adult individuals of late-successional tree species, including M. iltisiana. The other two selected sites (S2 and S3) had a history of selective logging (ca., 25 years), and currently are under regeneration as both have a large abundance of early life stages of M. iltisiana and with open canopies (Supplementary material, Table S1).
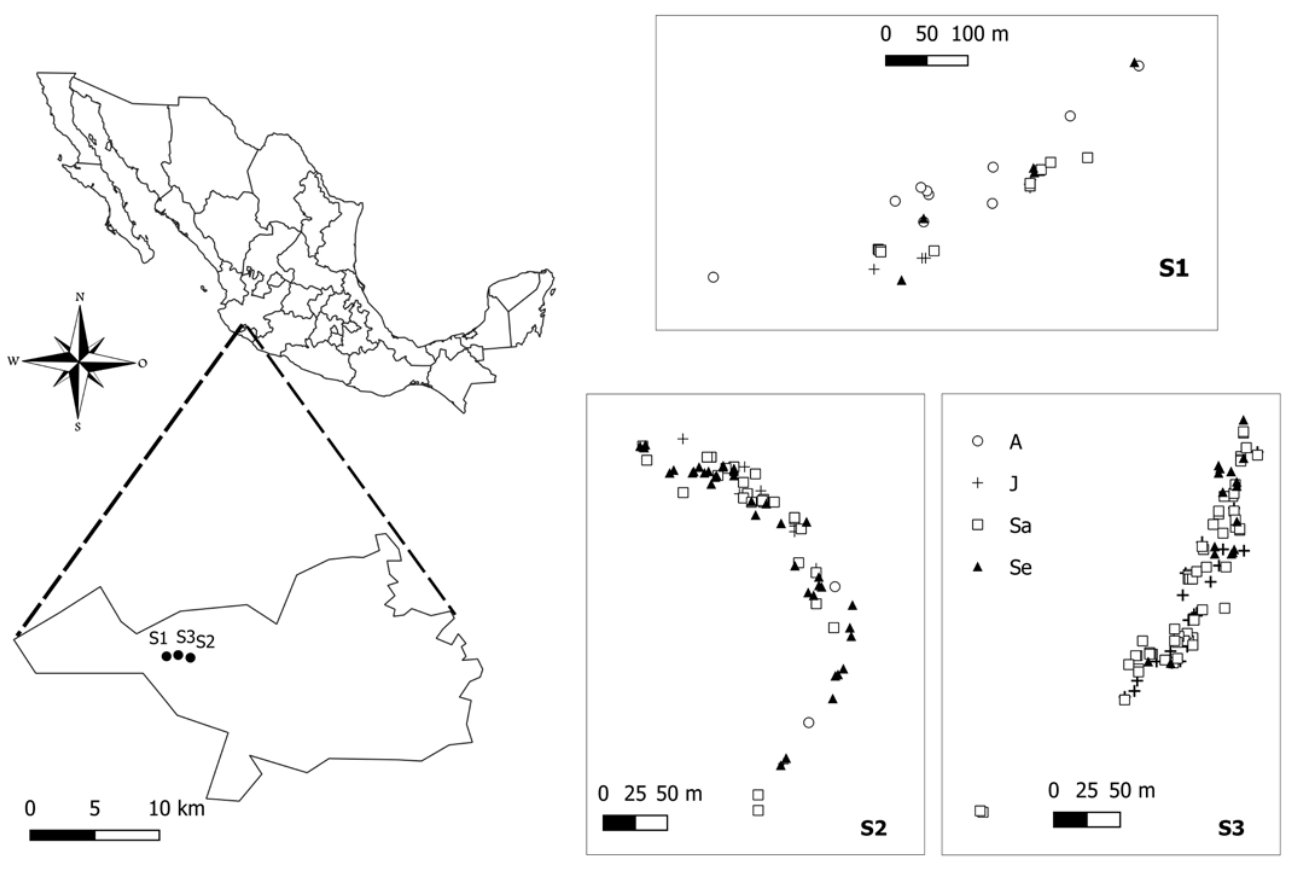
Figure 1 Sampling sites of M. iltisiana in Las Joyas Scientific Station, (SMBR): S1 (upper), S2 (bottom left), S3 (bottom right). Symbols represent: A. adults, J. juveniles, Sa. Saplings and Se. seedlings.
In each site, we collected leaf material from all individuals within a linear transect of four hundred (S2, n = 77 and S3, n = 100) to six hundred (S1, n = 34) meters in length, depending on the size of the vegetation patches and 15 meters in width to each. The transects were separated from each other by eight hundred (S1 - S3 and S3 - S2) to 1,600 (S1 - S2) meters in distance. The length of the linear transect covered almost all the individuals found at each site (approx. 60 - 80 % for S3 and S2 respectively and 95 % for S1). The transect at S1 was larger in extent due to a wider spacing between individuals and because of its much lower abundance. For each individual, we recorded the GPS coordinate, diameter at breast height (DBH), and height. Tissue samples from fresh leaves were dried in silica until DNA extraction. We classified life stages according to the following DBH categories (Vásquez-Morales et al. 2017): (i) adults 12.01-160 cm, (ii) juveniles 5.01-12 cm, (iii) saplings 0.31-5 cm, and (iv) seedlings 0-0.30 cm. Life stages were unevenly represented across sites: adults were mostly present in S1, while few were found for S2 and none for S3.
DNA extraction, PCR amplification, and genotyping. Genomic DNA was extracted from 15-20 mg of dried leaf tissue following the CTAB extraction protocol of Doyle & Doyle (1987). A single DNA band (i.e., not multiple bands) was observed in a 1 % agarose gel using a UV imaging system Gel DocTM EZ to determine DNA integrity. We evaluated the amplification of twelve microsatellites from Isagi et al. (1999), Setsuko et al. (2005), and Veltjen et al. (2019) developed for M. obovata Thunb, M. stellata (Siebold & Zucc.) Maxim., and Neotropical magnolias, but only seven (M6D3, M15D5, STM0218, STM0214, STM0200, STM0383, and MA42-481) showed clear scorable polymorphic allele peaks in the electropherogram. Nuclear microsatellite amplifications were conducted using the Type-it Microsatellite PCR kit (QIAGEN, Venlo, Netherlands) as follows: 0.2 µl of each 10 µM forward and reverse primers, 5 µl of the PCR mix, and 1.0 µl of genomic DNA (5-10 ng) in a total reaction volume of 10 µl. Forward primers were NED (M6D3), HEX (STM0383 and STM0218), and FAM (MA42-481, M15D5, STM0214, and STM0200) fluorescently labeled, and we pooled their amplification in two PCR multiplexes: Multiplex1 (M6D3, STM0383, MA42-481, and STM0218) and Multiplex2 (M15D5, STM0214, and STM0200). PCR conditions were carried out following the procedure from Rico & Gutiérrez-Becerril (2019), which began with 15 min denaturation at 95 °C, followed by thirty-two cycles of 30 s denaturation at 94 °C, 30 s annealing at 55 °C, 1 min extension at 72 °C, and a final extension of 12 min at 72 °C. Amplification fragments were corroborated by electrophoresis on 1% agarose gels under the UV imaging system Gel DocTM EZ. PCR products were run on an ABI 3730X Automated Sequencer (Applied Biosystems) with 600 LIZ as the size standard. We included a positive and negative control to check for contamination, and approximately 35% of the samples were amplified twice to assess genotyping error rate. Electropherograms were analyzed using GeneMapper v.6 with visual checking of all genotypes at least twice. The final genetic data set included 211 samples at seven microsatellite loci.
Genetic diversity and structure. The presence of null alleles was assessed with FreeNA using 50,000 iterations (Chapuis & Estoup 2007). Departures from Hardy-Weinberg equilibrium (HWE) and linkage disequilibrium (LD) were tested using probability tests with 10,000 Markov chain iterations in GENEPOP (Rousset 2008). For each life stage and for the complete data set, we estimated the observed (Ho) and unbiased expected heterozygosity (uHe), the effective number of alleles (Ae), and the fixation index (FST) with GENALEX 6.5 (Peakall & Smouse 2012). Corrected measures of allelic richness (Ar) and private allelic richness (Par) for the effect of sample size by rarefaction were estimated in HP-RARE (Kalinowski 2005). Inbreeding coefficients (FIS) and its confidence interval with α = 0.05 and 10,000 bootstraps were estimated with the package DiveRsity (Keenan et al. 2013) in R v. 4.0.3 (R Core Team 2020). The effect of null alleles on the estimation of the inbreeding coefficient was evaluated by comparing the nfb (full model which includes null alleles, inbreeding coefficients, and genotyping failures) against the fb model (model without null alleles) by performing a Bayesian Individual Inbreeding Model (IMM) analysis with 500,000 Markov chain Monte Carlo (MCMC) iterations and 50,000 burn-in cycles in INEST 2.2 (Chybicki & Burczyk 2009). The genetic diversity parameters were statistically compared among life stages with the non-parametric Kruskal-Wallis H test (Zar 1999) in R. Pairwise genetic distance between life stages and its significance was assessed in Arlequin v. 3.5.2.2 (Excoffier & Lischer 2010) with 10,000 permutations.
Population genetic structure was assessed with a Bayesian analysis in STRUCTURE v. 2.3.4 (Pritchard et al. 2000) using the model of genetic admixture and correlated frequencies for 200,000 burn-in steps followed by 500,000 post-burn MCMC iterations. We ran models for one to six genetic clusters (K), with ten replicates for each K. To determine the value for K clusters, we used STRUCTURE HARVESTER (Earl & vonHoldt 2012) and the ad hoc ΔK method (Evanno et al. 2005). The visualization of k-clusters was performed using DISTRUCT (Rosenberg 2004) and CLUMPAK (Kopelman et al. 2015). Additionally, we evaluated the degree of genetic differentiation among life stages per site as a priori groups using the Discriminant Analysis of Principal Components (DAPC) with the R package adegenet (Jombart 2008). The optimal number of PCs to retain was determined with the xvalDapc function. We graphically visualized the first two discriminant functions using scatter plots in R. We also applied an Analysis of Molecular Variance (AMOVA) with the R package poppr (Kamvar et al. 2014) using the four life stages and the three sites as hierarchical groups to observe the amount of genetic variation among and within life-stages and sites, and their significance was tested by 9,999 permutations with the randtest function.
FSGS analysis.We assessed FSGS for the three sites and for each life stage within each of the sites using spatial autocorrelation analyses in SPAGEDI v. 1.5 (Vekemans & Hardy 2002) by estimating the pairwise kinship coefficient Fij of Loiselle et al. (1995) for four to five even distance classes of 50 m. Choosing this distance ensured that each class included enough pairwise observations (Vekemans & Hardy 2004) and that spatial patterns were comparable among the sites. We evaluated for each class significance with 10,000 permutations. Additionally, we estimated the Sp statistic proposed by Vekemans & Hardy (2004) as a measure to facilitate comparisons between sites. The Sp statistic has been widely applied in empirical FSGS studies since it provides an estimate of the strength of FSGS under isolation by distance (higher values of Sp indicate higher FSGS; Vekemans & Hardy 2004). The Sp statistic was calculated as
Moreover, since we have contrasting sample sizes between site S1 vs sites S2 and S3, we used a resampling approach to evaluate the sensitivity of FSGS statistics to sample size given the lower number of individuals for S1. For each S2 and S3 site, we randomly resampled thirty-five individuals (without replacement) 1,000 times, and for each resampled dataset we estimated the Sp and its significance (using 999 permutations). We observed the number of times, significant Sp values (P < 0.05) were obtained. This analysis was conducted in R.
Results
The genotyping error rate was < 2 % based on the allele match estimation of the repeated samples. The number of alleles per locus ranged from seven (M6D3) to seventeen (STM0200), totaling sixty-nine alleles across loci. Estimated frequencies of null alleles per each locus ranged from 0 to 0.14. Significant departures from HWE were detected in two loci (M6D3 and MA42-481). Significant LD was detected in fifteen pairwise loci comparisons (Table S2 Supplementary material). We retained all seven microsatellite loci for subsequent analyses.
Genetic structure. Results based on the ΔK plot from STRUCTURE suggested K = 4 as the most likely number of genetic clusters. However, high admixture was observed among all clusters, such that no genetic structure exists among the three sites (Figure S1 Supplementary material). The DAPC obtained in adegenet showed a large overlap among the four life stages for each of the three sites, and without clearly separating any group (Figure S2 Supplementary material). Results from the AMOVA indicated that most of the genetic variation is found within sites (97.23 %, P < 0.05), and little is found between sites within life stages (3.78 %, P < 0.05) and nothing between sites (-1.02 %, P > 0.05) (Table S3). Arlequin estimates of pairwise FST between sites ranged from 0.017 to 0.032, and all comparisons were statistically significant (Table S4 Supplementary material). The pairwise FST values between the life stages were low and ranged from 0.005 to 0.0021, with adults and seedlings showing the highest differentiation, although differences were not statistically significant (Table S5).
Genetic diversity. Because the STRUCTURE, DAPC, and AMOVA showed weak genetic structure among sites and among life stages within sites, we estimated genetic diversity parameters for all individuals of each life stage without discriminating against sites. Genetic diversity estimates showed similar values among cohorts, where the expected heterozygosity (uHe) ranged from 0.66 to 0.69, effective number of alleles (Ae) from 2.88 to 3.37, allelic richness (Ar) from 5 to 5.39, and private allelic richness (Par) from 0.38 to 0.61. The overall FST obtained with GENALEX was 0.019 ± 0.003. The highest genetic diversity was found in saplings and seedlings relative to adults, although these differences were not statistically significant (Table 1). Inbreeding coefficients were low for all life stages, and without statistically significant differences (Table 1). Results from the IMM analysis in INEST suggested null alleles had an important effect on the estimation of the inbreeding coefficient as observed by the lower values of the Deviation Information Criterion (DIC) observed for the nfb model when compared to their fb model. The inbreeding coefficient Fi adjusted for the presence of null alleles was stronger for adults followed by saplings, although values were low (Table 2).
Table 1 Genetic diversity parameters for four life stages of Magnolia iltisiana. Abbreviations: n sample size, Ho observed, uHe unbiased heterozygosity, Ae effective number of alleles, Ar rarefied allelic richness, Par private allelic richness, FIS inbreeding coefficient, and Confidence Intervals (CI), F fixation index. ns indicates no statistically significant differences among life stages P > 0.05.
| Life stage | n | Ho | uHe | Ae | Ar | Par | FIS (CI) | F |
|---|---|---|---|---|---|---|---|---|
| Adults | 12 | 0.655 | 0.655 | 2.876 | 5 | 0.46 | -0.048 (-0.21, 0.21) | -0.048 |
| Juveniles | 40 | 0.659 | 0.685 | 3.369 | 5.37 | 0.61 | 0.041 (-0.06, 0.11) | 0.041 |
| Saplings | 98 | 0.666 | 0.691 | 3.509 | 5.16 | 0.38 | 0.034 (-0.02, 0.08) | 0.034 |
| Seedlings | 61 | 0.630 | 0.686 | 3.502 | 5.39 | 0.56 | 0.092 (0.02, 0.15) | 0.092 |
| Total | 211 | 0.654ns | 0.689 ns | 3.507 ns | 9.84 ns | 9.84 ns | 0.042 ns | 0.030 ns |
Table 2 Corrected for null alleles inbreeding coefficients in four life stages of Magnolia iltisiana. Abbreviation: n sample size, Fi unbiased inbreeding coefficient robust to null alleles, HPDI 95 % highest posterior density interval, DIC deviation information criterion for the nfb and fb models.
| Life stage | n | Fi | HPDI | DIC | |
|---|---|---|---|---|---|
| nfb | fb | ||||
| All | 211 | 0.0069 | 0-0.0182 | 7,330.961 | 7,389.099 |
| Adults | 12 | 0.0178 | 0-0.0616 | 379.621 | 380.566 |
| Juveniles | 40 | 0.0153 | 0-0.0493 | 1,396.480 | 1,407.545 |
| Saplings | 98 | 0.0174 | 0-0.0474 | 3,348.048 | 3,357.532 |
| Seedlings | 61 | 0.0122 | 0-0.0382 | 2,140.874 | 2,171.387 |
Fine-scale genetic structure. The overall correlogram from SPAGEDI that includes the four life stages per site revealed a statistically significant pattern of FSGS for site S2 (Sp = 0.0119, P < 0.05) and S3 (Sp = 0.0071, P < 0.05) at the first distance class (50 m), but the Sp and Fij were stronger for S2. In contrast, no statistically significant pattern of FSGS was found for S1 (Sp = 0.0011, P > 0.05; Figure 2). The FSGS statistics for the overall sites and each life stage within sites are shown in Table 3. We could not analyze seedlings of site S1 and adults of S2 due to the low sample size. For site, S1 all life stages showed extremely low values of Fij and Sp (negative and close to zero) (Figure 3). For the S2 site, we found a statistically significant FSGS only for seedlings up to the second distance class (100 m, P < 0.05) (Figure 4). For the S3, statistically significant FSGS was observed only for saplings up to the first distance class (50 m, P < 0.05) (Figure 5). The highest value of the Sp was observed for seedlings in S2 followed by saplings in S3.
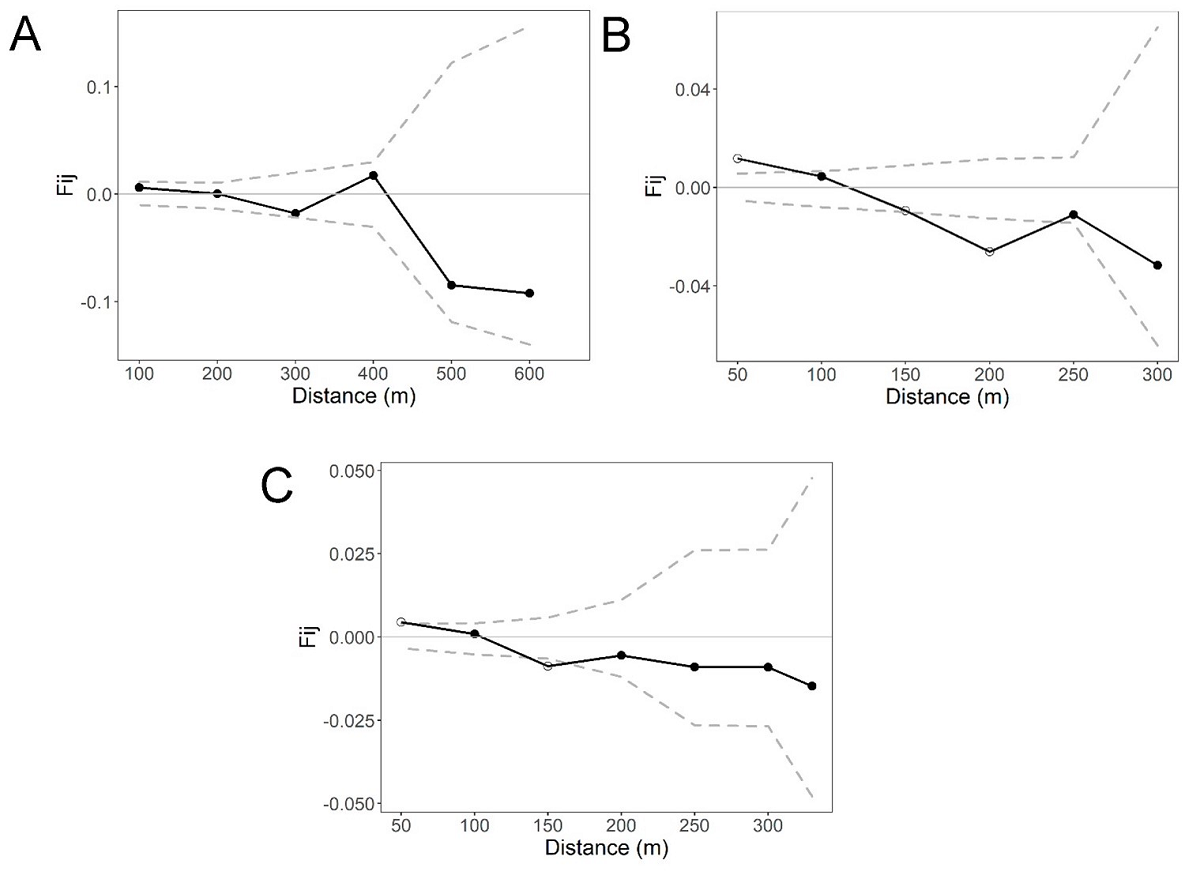
Figure 2 Spatial autocorrelograms based on kinship (Fij) coefficients in Magnolia iltisiana in an (A) conserved site (S1), and two regeneration sites (B and C) with a history of selective logging (S2 and S3). Dashed lines represent the 95 % CI.
Table 3 FSGS statistics for four life stages of Magnolia iltisiana in three sampled sites: conserved (S1) and regeneration sites after selective logging (S2 and S3). Abbreviations: n sample size, bF regression slope, F(1) mean kinship coefficient for the smallest distance class, Sp statistic. Numbers highlighted in black are statistically significant: *P < 0.01, **P < 0.001. Note. Statistics for adults of S2 were not included due to the low sample size (n = 2).
| Site | n | bF | F(1) | Sp |
|---|---|---|---|---|
| S1 | 34 | -0.0011 | 0.0059 | 0.0011 |
| S2 | 77 | -0.0118** | 0.0117 | 0.0119 |
| S3 | 100 | -0.0071** | 0.0044 | 0.0071 |
| Cohort by site | ||||
| S1: Adults | 10 | -0.0028 | -0.0019 | 0.0028 |
| S1: Juveniles | 6 | -0.0303 | 0.0453 | 0.0318 |
| S1: Saplings | 13 | -0.0023 | 0.0055 | 0.0023 |
| S1: Seedlings | 5 | -0.1037 | 0.0234 | -0.0212 |
| S2: Juveniles | 10 | -0.0047 | 0.0135 | 0.0047 |
| S2: Saplings | 26 | -0.0021 | -0.0032 | 0.0021 |
| S2: Seedlings | 39 | -0.0209** | 0.0292 | 0.0215 |
| S3: Juveniles | 24 | 0.0083 | -0.0091 | -0.0082 |
| S3: Saplings | 59 | -0.0081* | 0.0083 | 0.0081 |
| S3: Seedlings | 17 | -0.0134 | 0.0093 | 0.0135 |
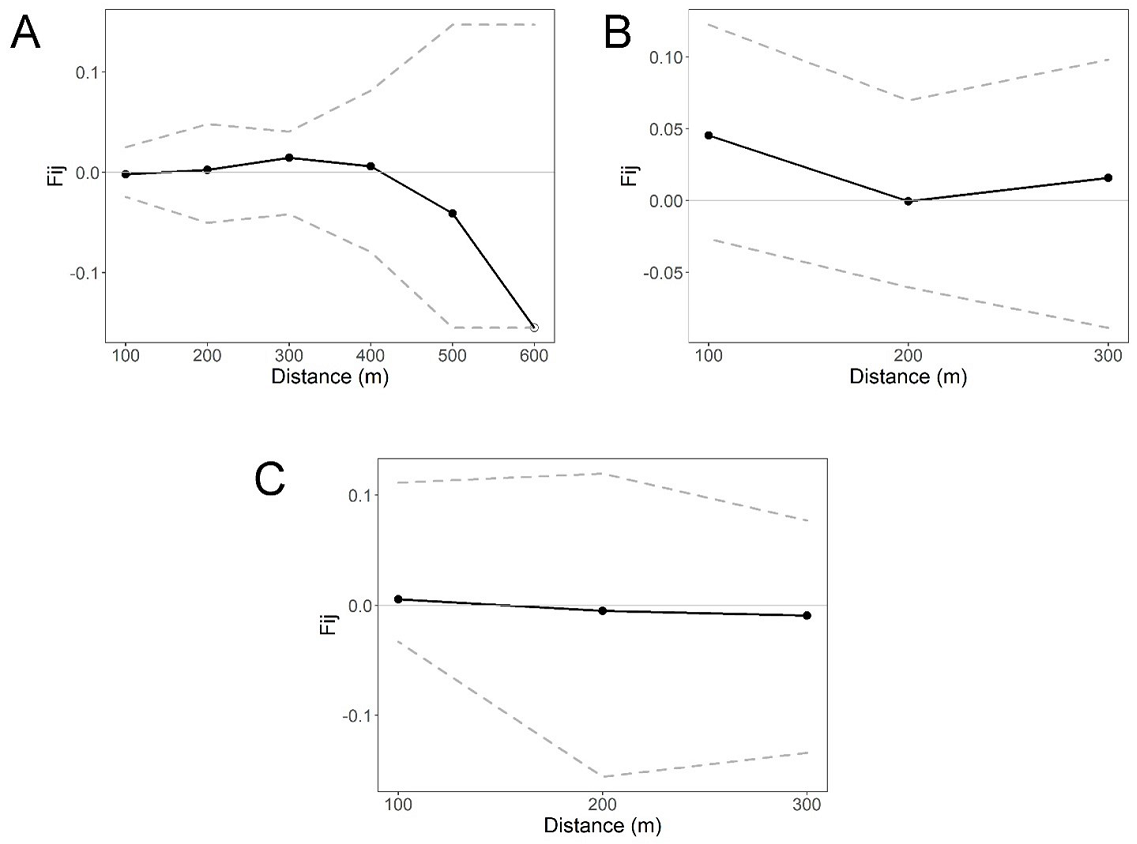
Figure 3 Spatial autocorrelograms based on kinship (Fij) coefficients in three life stages for Magnolia iltisiana in the conserved site (S1): (A) adults, (B) juveniles, (C) and saplings. Dashed lines represent the 95 % CI.
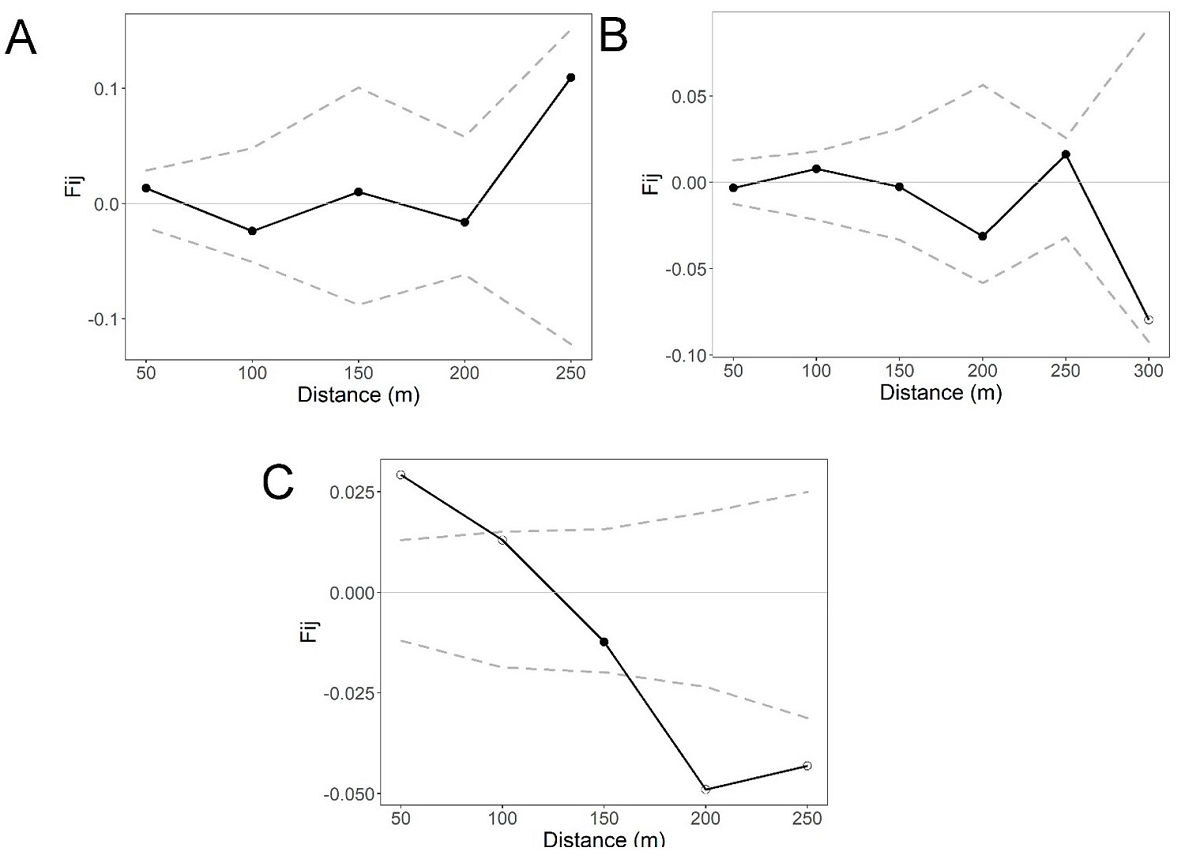
Figure 4 Spatial autocorrelograms based on kinship (Fij) coefficients in three life stages for Magnolia iltisiana in regeneration site S2 after selective logging: (A) juveniles, (B) saplings, and (C) seedlings Dashed lines in B and D represent the 95 % CI.
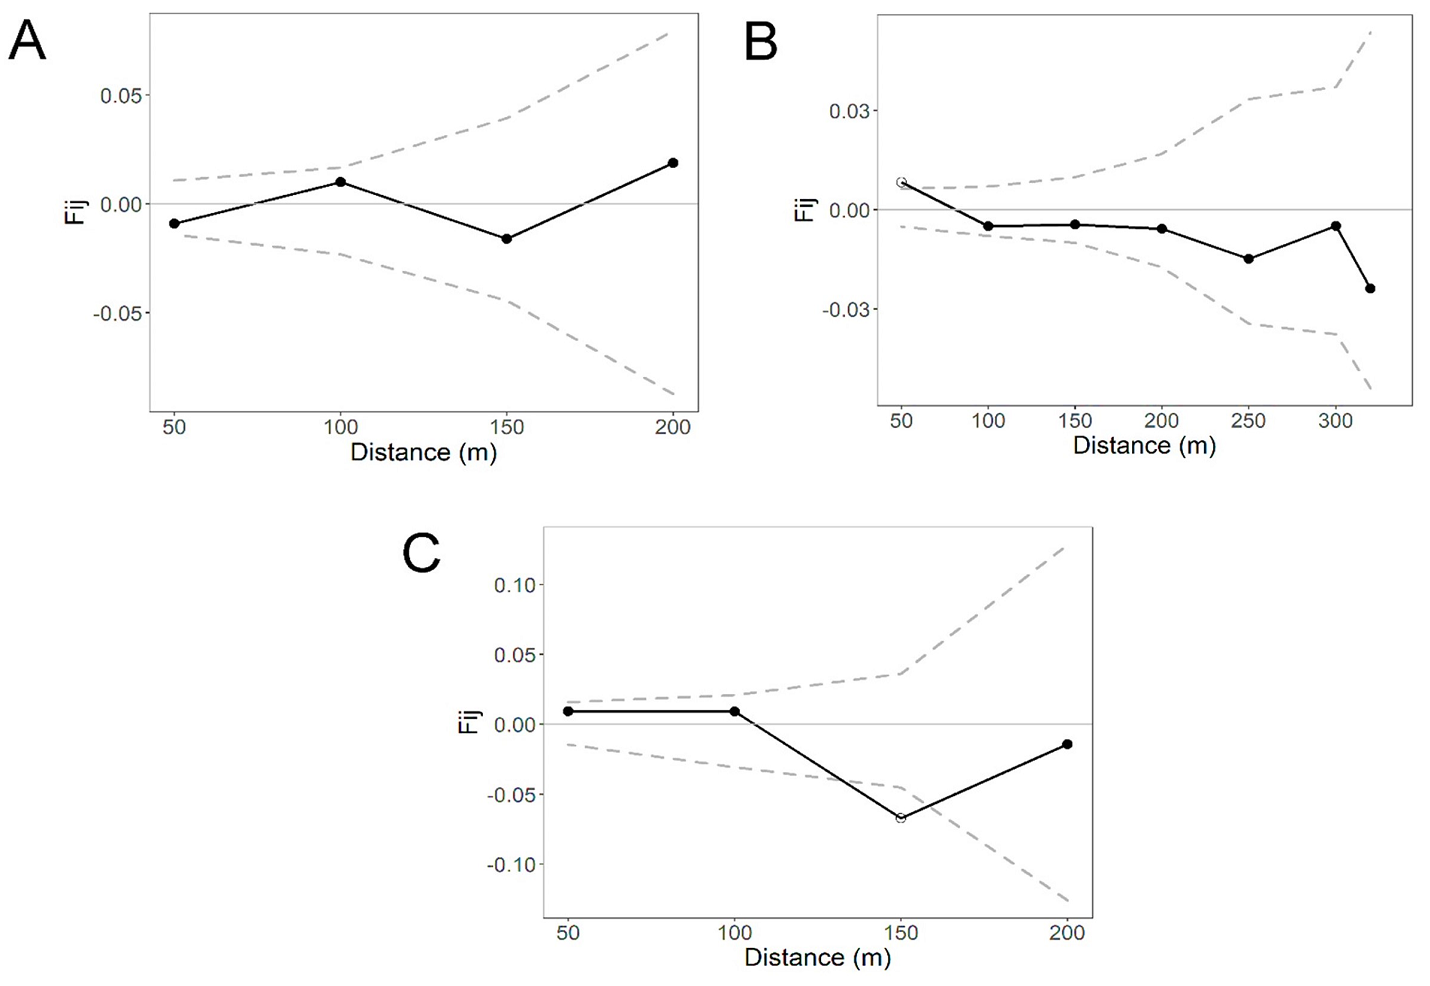
Figure 5 Spatial autocorrelograms based on kinship (Fij) coefficients in three life stages for Magnolia iltisiana in regeneration site S3 after selective logging (S3): (A) juveniles, (B) saplings and (C) seedlings. Dashed lines represent the 95 % CI.
As a result of the resampling analysis, the mean resampled Sp value for site S2 was similar (0.0128 ± 0.008) to the observed one (0.0119) while 73.2 % of the cases were statistically significant. For site S3, also the mean Sp value (0.0075 ± 0.005) was similar to the real value (0.0071) but only statistically significant in 46 % of the cases. For both permutation scenarios, the proportions of Sp values similar to the conserved S1 site (0.001) were very low (< 5 %; Supplementary material Figure S3).
Discussion
Investigating the fine-scale genetic structure of forest trees is relevant for the management of forest ecosystems (Smith et al. 2018), as it can provide information on regeneration dynamics and gene dispersal (Kalisz et al. 2001, Barluenga et al. 2011). Most FSGS studies in plants have focused on the effects of mating system, dispersal vectors, plant density, and life form (Vekemans & Hardy 2004, Gelmi-Candusso et al. 2017), while less information exists on the role of extrinsic factors, such as selective logging of which empirical evidence has shown mixed patterns (Takeuchi et al. 2004, Cloutier et al. 2007, Duminil et al. 2016).
Our study of M. iltisiana found no evidence of FSGS in the site without a history of selective logging (S1, Sp = 0.001), whereas significant FSGS was detected in regeneration sites following selective logging, of which S2 showed the strongest FSGS (S2: Sp = 0.0119 vs. S3: Sp = 0.0071). When separating the analyses among life stages per site, we observed significant FSGS in seedlings in S2 (Sp = 0.022) and saplings in S3 (Sp = 0.008) at the second (100 m) and the first distance classes (50 m) respectively, but no significant patterns in juveniles and adults. A decline in the strength of FSGS across life stages in regeneration sites has been reported in the conifer P. jezoensis (Kitamura et al. 2018) and in the intensively logged tropical tree S. macrophylla (Alcalá et al. 2015). However, our resampling analysis suggests that sample size may influence the power of the test to detect significant FSGS patterns as could be the case for the conserved site S1. From the permutation tests, we observed that the average resampled values of the Sp statistic for both regeneration sites (S2: Sp = 0.022 and S3: Sp = 0.008) were very close to the observed values, but only the 73 % and 46 % of the cases were significant, respectively. Our study of FSGS in a vulnerable tree species faces the limitation of sampling, which can be critical in FSGS analysis (Vekemans & Hardy 2004, Hein et al. 2021). We were unable to include another “conserved” site with a larger number of M. Iltisiana individuals within similar ecological conditions (e.g., humidity, altitude range, slope exposure, and within the LJSS), and although we collected almost all M. iltisiana individuals for site S1, its sample size was half of the samples of site S2 and a third of S3.
Selective logging, which usually targets old mature trees with large diameters, can impact species composition, relative abundance, and age structure in forest ecosystems (Bonnell et al. 2011, Baraloto et al. 2012, Toledo-Aceves et al. 2021). For our three sites, it was evident that species composition, population density, and age structure differed between the conserved and regeneration sites, which reflect their demographic history. Of these, population density is a well-known factor influencing the strength of FSGS (Vekemans & Hardy 2004) and may reflect the lack of significant FSGS at site S1. Our results are likely attributed to demographic thinning, which is a relevant ecological process reported to change the strength and spatial extent of FSGS across life stages in forest trees (Chung et al. 2003, Ueno et al. 2002).
Gene flow does not appear to be restricted within the LJSS as we detected no genetic structure, and genetic diversity was not found to be lower in any life stages. However, knowledge of seed dispersal vector behavior is needed to better understand their contribution to patterns of fine-scale genetic structure in plants (Gelmi-Candusso et al. 2017). The inbreeding coefficient was overall low, though the highest values were observed for seedlings and adults, depending on whether it was corrected for the presence of null alleles. Our results imply that selective logging has had no effect on the genetic diversity of M. iltisiana. Our estimates of genetic diversity for M. iltisiana in the LJSS (uHe = 0.69) were higher than the values reported for a small population of M. iltisiana in Michoacán with microsatellite loci (uHe = 0.50) (Rico & Gutiérrez-Becerril 2019), where the species is currently declining due to habitat loss. In comparison with other genetic studies in neotropical Magnolia based on microsatellites, our estimates are higher than Magnolia pacifica A. Vazquez (Muñiz-Castro et al. 2020), and M. tamaulipana A. Vazquez (García-Montes et al. 2022), but similar to those reported for large populations of M. pedrazae A. Vazquez (Rico & Gutiérrez-Becerril 2019), M. schiedeana Schltdl. (Rico et al. 2023), five species of Magnolia sect. Talauma sensu Figlar and Nooteboom (M. decastroi A. Vazquez, M. lopezobradorii A. Vazquez, M. mexicana DC., M. sinacacolinii A. Vazquez and M. zoquepopolucae A. Vazquez; Aldaba-Núñez et al. 2021), M. lacandonica A. Vazquez, and five Caribbean Magnolia species (M. cubensis subsp. acunae and M. cubensis subsp. cubensis Imkhan, M. hamorii Howard, M. portoricensis Bello and M. splendens Urb.) (Veltjen et al. 2019, Rodríguez et al. 2021). The genetic diversity observed for M. iltisiana in LJSS results from high levels of historical and/or contemporary gene flow by pollen and seed dispersal, a large effective population size, and the outcrossing mating system (Budd et al. 2015, Rico & Gutiérrez-Becerril 2019, Veltjen et al. 2019, Hernández et al. 2020).
In conclusion, our study does not suggest an effect of selective logging on genetic diversity on the contrasted conditions and FSGS pattern only in the earlier stages of the regeneration sites after selective logging in M. iltisiana. It is necessary to conduct more research by sampling more sites under different anthropogenic habitat conditions to obtain more conclusive results. The conservation of M. iltisiana within the Biosphere Reserve is highly relevant for the species conservation and management in the long term as this is the region where the largest population of M. iltisiana persists. Ex-situ management strategies aiming at propagating M. iltisiana in nurseries for restoration purposes should collect seeds at a minimum distance of 100 m to avoid the effects of inbreeding. More FSGS studies on other vulnerable TMCF forest species, while also considering the limitation of sample size, would be needed to further understand regeneration dynamics in sites with a history or under current selective logging events.
Supplementary material
Supplemental data for this article can be accessed here: https://doi.org/10.17129/botsci.3254.

