


 nova página do texto(beta)
 Inglês (pdf)
 Artigo em XML
 Referências do artigo
 Enviar este artigo por email
 Citado por SciELO
  Similares em
SciELO
Similares em
SciELO 
 Permalink
Species with large geographical distributions frequently exhibit an elevated phenotypic variation among and within populations, produced by two non-exclusive mechanisms: phenotypic plasticity which in short temporal scale allows species to thrive in variable environmental conditions or, by adaptation via genetic differentiation (Schlichting 1986).
The distribution of phenotypic and genetic variation in different spatial scales: regions, among and within populations depends on the species and the analyzed trait (Bucharova et al. 2017). The magnitude of genetic variation, its spatial distribution and partitioning among and within populations is of great relevance for the maintenance, survival and evolutionary potential of any species (Venable & Búrquez 1989).
The structure of genetic variation may differ among analyzed traits, depending if these are subject to natural selection or not and how selection varies spatially (Olsson & Ågren 2002). Differentiation among populations can be driven essentially by natural selection or genetic drift. Natural selection operates in populations where its individuals present phenotypic differences and such differences are heritable and have an adaptive value. Conversely, genetic drift produces random genetic changes, independent of selective pressures given environmental local conditions (Schmid & Guillaume 2017).
Climate is considered a key factor that conditions the geographic distribution and phenotypic-genetic variation of plant species, since it can act directly on physiological, growth and reproductive processes or indirectly through ecological interactions (Shao & Halpin 1995). Several studies have demonstrated the covariation of phenotypic traits with rainfall and temperature (Solís-Neffa 2010, Nooryazdan et al. 2013, Moles et al. 2014) and insolation (De Frenne et al. 2013). These three environmental factors and its measures of variation correlate with latitude, in a more or less orderly manner (De Frenne et al. 2013). Variation of climate factors is relevant since it may produce phenotypic differentiation due to plasticity or genetic variation among populations and ultimately being subject to selection and adaptation (Akman et al. 2020).
In wild plant species as Capsicum annuum var. glabriusculum, components of phenotypic variation within and among populations, as well as its genetic variation, are key elements that allow a species to confront changing environmental adversities and expand geographically (Rice & Mack 1991, Hernández-Verdugo et al. 2008).
Capsicum annuum var. glabriusculum plants, are climbing woody vines, herbaceous or shrubby forms. Its fruits are small, red and pungent, consumed and dispersed by birds. Capsicum annuum var. glabriusculum is widely distributed in Mexico, its populations are found on undisturbed sites in the tropical dry forest, along roads, orchards and abandoned crop fields (Hernández-Verdugo, 2018).
These wild populations are regarded as a valuable genetic resource, because they constitute a genetic reservoir with potential to mitigate the effects of environmental adversities in its cultivated forms (Hernández-Verdugo et al. 1998, Retes-Manjarrez et al. 2018). In the Northwest of Mexico, studies with isoenzymes (Hernández-Verdugo et al. 2001), RAPDs (Oyama et al. 2006) and microsatellites (Pacheco-Olvera et al. 2012) indicated an elevated level of genetic variation among and within populations. López-España et al. (2016) in uniform greenhouse conditions, detected that leaf traits presented the largest amount of phenotypic variation followed by reproductive and vegetative traits. In field conditions, Hernández-Verdugo et al. (2012) and in a greenhouse experiment López-España et al. (2016), found that phenotypic variation correlated to climate factors of sampled sites in northwest Mexico.
Hernández-Verdugo et al. (2008) detected that the largest proportion of hierarchical phenotypic variation of Capsicum annuum var. glabriusculum distributed mainly within families, then among families and finally among populations, then the main portion of genetic variation was detected within families then among families (within populations) in sampled sites of Northwest Mexico. Here we enlarge this analysis by increasing the number of populations in the Northwest and adding populations from regions of Mexico with contrasting environmental conditions. Hence, in this study, we analyzed the phenotypic and genetic variation of 24 populations of Capsicum annuum var. glabriusculum collected from three regions of Mexico in a controlled greenhouse environment. The main objectives were: I) estimate the levels of phenotypic and genetic variation and its hierarchical distribution among regions, among populations (nested within regions), within populations (among families) and within families, II) estimate the covariation of phenotypic variation produced in uniform greenhouse conditions with climate variation of the sampled sites. It is important to recall that differences of phenotypic variation under controlled uniform conditions of a greenhouse are mainly due to genetic differences.
Materials and methods
Vegetal Material and Sampling Sites. Ripe fruits were collected from 6 to 22 plants with a mean of 14.4 plants in 24 populations of Capsicum annuum var. glabriusculum from three regions in Mexico, distributed in a latitudinal gradient within 15°49’ N to 29°34’ N (± 1,600 km) and over 2,000 km longitudinally (-88°48’ W to -110°07’ W). In the Northwest region, populations were in the states of Sonora and Sinaloa, in the Southeast region in Yucatán and Tabasco and in the state of Oaxaca for the South, along its coastal line (Figure 1). Populations were gathered in their respective regions based on climate, geographic and environmental similarities (Table 1).
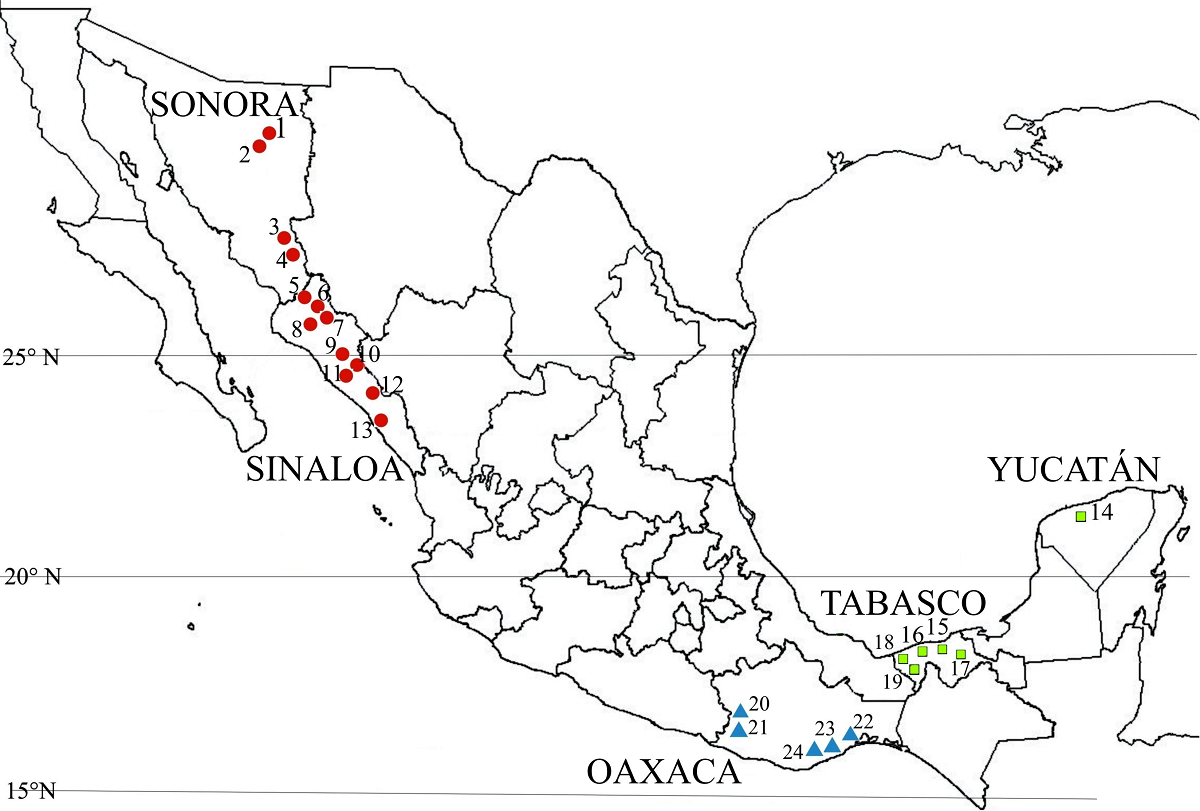
Figure 1 Sampling sites of Capsicum annuum var. glabriusculum populations in three regions of Mexico. Regions: Northwest (●), Southeast (■), South (▼).
Table 1 Geographic, climate data and type of habitat of populations of Capsicum annuum var. glabriusculum of three regions of Mexico. Lower rows denote regression coefficients and sign of climate factors and latitude. Abbreviations as in main text. TF = thorn forest, TDF = tropical dry forest, AC = abandoned cropfield, TRF = tropical forest, HG = house backyard.
| Population | Lat. | Long. | TMax | CV | MAT | CV | TMin | CV | TR | PP | PCI | AI | Ins | CV | Habitat |
|---|---|---|---|---|---|---|---|---|---|---|---|---|---|---|---|
| 1 Montosa | 29°34 | -109°58’ | 41.4 | 11.5 | 21.7 | 30.5 | 4.0 | 82.1 | 18.2 | 559.9 | 17.8 | 0.057 | 368.3 | 23.6 | TF |
| 2 Mazocahui | 29°31’ | -110°07’ | 41.3 | 10.8 | 21.3 | 31.8 | 1.3 | 86.5 | 20.4 | 557.8 | 17.5 | 0.056 | 368.5 | 23.5 | TF |
| 3 Presa Oviachic | 27°49’ | -109°53’ | 42.8 | 9.4 | 24.7 | 22.4 | 7.0 | 84.0 | 18.5 | 418.5 | 19.5 | 0.083 | 375.8 | 21.8 | TDF |
| 4 Cedros | 27°44’ | -109°18’ | 42.6 | 7.6 | 23.6 | 22.8 | 4.8 | 52.2 | 20.2 | 762.2 | 19.1 | 0.044 | 374.0 | 21.8 | TDF |
| 5 Buyubampo | 26°37’ | -108°39’ | 44.0 | 5.3 | 24.4 | 18.1 | 5.2 | 95.7 | 17.2 | 567.4 | 19.3 | 0.061 | 377.4 | 20.7 | TDF |
| 6 El Mahone | 26°30’ | -108°34’ | 43.6 | 6.3 | 25.2 | 18.7 | 7.0 | 81.4 | 17.3 | 623.2 | 20.1 | 0.056 | 377.7 | 20.6 | TDF |
| 7 Yecorato | 26°26’ | -108°12’ | 44.2 | 4.8 | 24.2 | 19.4 | 3.6 | 42.1 | 21.4 | 835.3 | 18.2 | 0.041 | 377.9 | 20.5 | TDF |
| 8 Lo de Vega | 26°11’ | -108°36’ | 41.1 | 7.7 | 23.6 | 21.3 | 3.6 | 36.9 | 19.0 | 644.0 | 20.2 | 0.052 | 378.7 | 20.3 | TDF |
| 9 El Pozo | 24°55’ | -107°15’ | 39.6 | 6.6 | 26.0 | 14.8 | 6.4 | 55.4 | 13.9 | 686.3 | 23.3 | 0.052 | 382.3 | 19.1 | TDF |
| 10 Sanalona | 24°47’ | -107°07’ | 41.3 | 4.4 | 24.8 | 16.6 | 7.4 | 85.8 | 17.5 | 853.8 | 20.6 | 0.041 | 382.6 | 18.9 | TDF |
| 11 Alcoyonqui | 24°43’ | -107°12’ | 41.2 | 4.5 | 24.9 | 18.0 | 8.0 | 66.5 | 17.0 | 850.0 | 20.8 | 0.041 | 382.8 | 18.9 | TDF |
| 12 Cosalá | 24°24’ | -106°36’ | 42.5 | 3.8 | 24.6 | 14.6 | 8.2 | 72.5 | 16.3 | 1083.7 | 18.1 | 0.032 | 383.7 | 18.6 | TDF |
| 13 El Roble | 23°55’ | -106°53’ | 39.7 | 5.3 | 23.6 | 17.6 | 8.7 | 73.2 | 12.2 | 650.5 | 18.8 | 0.052 | 384.9 | 18.2 | AC |
| 14 Temax | 21°08’ | -88°50’ | 40.5 | 6.0 | 27.0 | 7.4 | 7.4 | 75.2 | 16.3 | 1590.2 | 11.9 | 0.023 | 391.9 | 15.7 | AC |
| 15 Oriente | 18°21’ | -93°11’ | 41.1 | 8.5 | 26.5 | 8.6 | 11.5 | 47.3 | 9.77 | 1786.9 | 11.2 | 0.020 | 398.2 | 13.3 | TRF |
| 16 Madero | 18°20’ | 93°12’ | 40.1 | 5.6 | 26.8 | 8.7 | 13.6 | 23.5 | 10.7 | 2062.0 | 11.7 | 0.018 | 398.2 | 13.2 | TRF |
| 17 Tucta | 18°11’ | 92°59’ | 41.2 | 8.1 | 26.8 | 8.1 | 14.8 | 22.0 | 10.9 | 1778.6 | 10.9 | 0.021 | 398.5 | 13.1 | TRF |
| 18 Ejido Moté | 18°02’ | 93°12’ | 38.2 | 5.0 | 26.5 | 8.7 | 15.3 | 26.4 | 10.5 | 1889.7 | 10.7 | 0.019 | 398.8 | 12.3 | HG |
| 19 Rancho Habanero | 17°57’ | 93°18’ | 40.0 | 4.9 | 26.6 | 8.1 | 13.7 | 21.8 | 10.2 | 1942.3 | 10.9 | 0.019 | 399.0 | 12.9 | HG |
| 20 Calderón | 16°16’ | 98°06’ | 42.9 | 7.1 | 27.2 | 4.4 | 11.4 | 16.5 | 16.4 | 1474.4 | 19.3 | 0.025 | 402.2 | 11.5 | TDF |
| 21 Cerro Colorado | 16°15’ | 98°04’ | 36.8 | 4.2 | 26.2 | 2.0 | 8.1 | 3.6 | 15.1 | 1591.3 | 16.9 | 0.023 | 402.3 | 11.5 | AC |
| 22Majagual | 16°05’ | 95°23’ | 34.5 | 4.2 | 26.4 | 4.4 | 18.2 | 9.3 | 6.8 | 920.0 | 18.8 | 0.040 | 402.6 | 11.4 | TF |
| 23 Zaachila | 15°58’ | 95°32’ | 40.3 | 2.2 | 27.7 | 2.4 | 14.2 | 12.0 | 12.9 | 1069.0 | 16.5 | 0.035 | 402.8 | 11.3 | TDF |
| 24 La Parcela | 15°49’ | 96°00’ | 37.0 | 5.6 | 26.5 | 10.4 | 13.2 | 9.0 | 17.6 | 741.2 | 15.4 | 0.049 | 402.1 | 11.1 | TDF |
| R2 | 0.397 | 0.238 | 0.743 | 0.878 | 0.761 | 0.677 | 0.498 | 0.514 | 0.314 | 0.513 | 0.994 | 0.998 | |||
| P | 0.001 | 0.015 | 0.000 | 0.000 | 0.000 | 0.000 | 0.000 | 0.000 | 0.004 | 0.000 | 0.000 | 0.000 | |||
| Sign | + | + | - | + | - | + | + | - | + | + | - | + |
Information regarding climate factors (Table 1) was obtained from the smn.conagua.mx webpage. Maximum (TMax), mean (MAT) and minimum (TMin) temperatures are shown in °C. Temperature range (TR) was estimated as the mean of monthly differences between maximum minus minimum temperatures. Annual rainfall (PP) is recorded in mm. Rainfall variability was estimated as the Precipitation Concentration Index (PCI) (Oliver 1980), that describes rainfall seasonality based on the amount of monthly data, large values describe an elevated amount of rainfall in fewer months. De Martonne aridity index (AI) integrates mean temperature and annual rainfall, in this study we employed each population inverse, so each value describes higher aridity conditions. Insolation (Ins) was measured in W × m2 × d-1 from data available at giss.nasa.gov/model1E/ar5plots/srlicat.html. Measures of variation for temperatures and insolation were estimated as the coefficients of variation (CV) from monthly data.
All climate factors and its measures of variation were significantly correlated to latitude, means of maximum temperature, CVs of mean and minimum temperatures, PCI and CV of insolation correlated positively. Mean and minimum temperatures, annual rainfall and insolation correlated negatively with latitude (Table 1).
Experimental Design. Seeds were treated with 1,000 ppm gibberellic acid for 24 h 30 days after fruit collection, then put to germinate in polystyrene trays in Peat-Moss substrate. Three daughter seedlings were randomly chosen from each plant collected on field seven days after germination. Seedlings were transplanted to 30 L plastic bags filled with 10 kg of alluvial soil. Bags were placed 30 cm apart, in burrows separated from each other 1.3 m. Plants were irrigated with a drip system. Light was regulated with a mesh that allowed 50 % of direct sunlight. A total of 1038 total plants were placed and measured in a fully randomized design.
Measured Traits. The following phenotypic traits were measured seven months after transplant:
Vegetative traits.- 1) stem diameter (SD) in mm, 2) plant height (HT) in cm.
Foliar traits.- from three leaves in each plant, we estimated: 3) chlorophyll content (CLO) with a SPAD Chlorophyll Meter, Konica-Minolta, 4) leaf length (LL) in mm, 5) leaf width (LW) in mm; from these two measurements we estimated 6) leaf shape (LS) as the ratio LL/LW; 7) leaf area (LA) in cm2 with a Li-Cor 3100 Leaf Area Meter, Nebraska, United States. Measured leaves were dried at 65-70 °C for 48 h to estimate 8) specific leaf area (SLA). Leaf size traits (LL, LW, LS and LA) are highly correlated. However, variation of LW tends to be less pronounced due to restriction produced by the development of leaves venation network (Shi et al. 2021). Also, González et al. (2010) detected a genetic background in the different pathways of leaf length and leaf width development and hence leaf shape in A. thaliana; so here, we advocate to explore potential genetic differentiated responses of foliar size and shape traits.
Reproductive traits.- 9) Days to flowering (FLO), 10) total number of fruits per plant (F×P). From five fruits randomly chosen from each plant we measured 11) fruit length (FL) in mm, 12) fruit width (FW) in mm; from these two traits we estimated 13) fruit shape (FS) as the ratio FL/FW. 14) fruit weight (FM) in mg, 15) number of seeds per fruit (SN), 16) total seed weight per fruit (STM) in mg, 17) seed weight average (SMA) in mg and 18) total number of seeds per plant (TSN).
Statistical Analysis. In species with high levels of autogamy as Capsicum annuum var. glabriusculum phenotypic variation within families can be attributed mainly to environmental effects. Variation among families (within populations) has a genetic basis as a part of total variation among populations (Venable & Búrquez 1989, Hernández-Verdugo et al. 2008). To assess phenotypic and genetic variation, we performed a nested analysis of variance to determine the distribution of the relative quantities of phenotypic variation among regions, populations within regions, families within populations, variation within families was estimated as the residual of the ANOVA. Regions, populations and families were considered as random factors, these analyses were executed in JMP v. 11 (JMP®). A one-way ANOVA was performed to determine differences among regions. To evaluate phenotypic differentiation among traits we estimated the coefficient of variation (CV) for the measured traits. The dimensionless character of CV allows for an easy comparison of the magnitude of phenotypic variation among types of traits, regions and populations.
In order to discern the phenotypic differentiation of traits among regions and populations simultaneously, we executed analyses of principal components and hierarchical clustering. These procedures were performed on SPSS v. 22 (IBM®).
Climate Data. A multivariate analysis was performed to differentiate climate at regional and population levels. Then, a univariate approach was executed to detect patterns of covariation between climate factors and phenotypic variation. Finally, we executed a linear regression analysis between principal components 1 of climate factors and phenotypic variation.
RESULTS
The nested analysis of variance showed that in average, 17.6 % of phenotypic variation was distributed among regions, 21.3 % among populations, 11.1 % among families (within populations) and 49.8 % within families (Table 2). Among regions, all phenotypic traits showed statistical differences, with the exceptions of leaf width, number of seeds per fruit, seed weight per fruit and number of seeds per plant. Differences of the amount of phenotypic variation among regions oscillated between 0 % in the number of seeds per plant to 79 % in days to flowering.
Table 2 Percentages of phenotypic variation of Capsicum annuum var. glabriusculum estimated among regions (VAR), among populations (VAP), among families (VAF) and within families (VWF) as residuals, measured in 24 populations from three regions in Mexico. Total genetic variation (TGV) = VAR+VAP+VAF. Genetic variation among regions (GVR) = VAR/VAR+VAP+VAF. Genetic variation among populations (GVP) = VAP/VAR+VAP+VAF. Genetic variation among families (GVF) = VAF/VAR+VAP+VAF.
| Trait | VAR | VAP | VAF | VWF | TGV | GVR | GVP | GVF |
|---|---|---|---|---|---|---|---|---|
| Stem diameter | 10.0** | 6.7** | 4.1 ns | 79.2 | 20.8 | 48.1 | 32.2 | 19.7 |
| Plant height | 7.4** | 6.3** | 8.2** | 78.2 | 21.9 | 33.8 | 28.8 | 37.4 |
| Chlorophyll content | 27.0** | 7.1** | 15.3** | 50.7 | 49.4 | 54.6 | 14.4 | 31.0 |
| Leaf length | 41.7** | 6.0** | 9.2** | 43.1 | 56.9 | 73.3 | 10.5 | 16.2 |
| Leaf width | 7.2 ns | 12.4** | 15.0** | 65.3 | 34.6 | 20.9 | 35.8 | 43.3 |
| Leaf shape | 44.3** | 6.7** | 7.4** | 41.5 | 58.4 | 75.9 | 11.5 | 12.7 |
| Leaf area | 15.6* | 11.6** | 12.4** | 60.5 | 39.6 | 39.4 | 29.3 | 31.3 |
| Specific leaf area | 23.6** | 9.0** | 12.1** | 55.3 | 44.7 | 52.8 | 20.1 | 27.1 |
| Days to flowering | 79.0** | 9.1** | 9.7** | 2.2 | 97.8 | 80.8 | 9.3 | 9.9 |
| Number of fruits × plant | 1.6 ns | 82.0** | 10.5** | 5.9 | 94.1 | 1.7 | 87.1 | 11.2 |
| Fruit length | 4.2* | 32.6** | 11.6** | 51.6 | 48.4 | 8.7 | 67.4 | 24.0 |
| Fruit width | 6.9* | 16.5** | 10.8** | 65.8 | 34.2 | 20.2 | 48.2 | 31.6 |
| Fruit shape | 25.6** | 34.2** | 7.2** | 33.0 | 67.0 | 38.2 | 51.0 | 10.7 |
| Fruit weight | 6.3* | 5.9** | 14.9** | 72.9 | 27.1 | 23.2 | 21.8 | 55.0 |
| Number of seeds × fruit | 3.4 ns | 26.5** | 11.5** | 58.8 | 41.4 | 8.2 | 64.0 | 27.8 |
| Seed weight × fruit | 7.2 ns | 18.1** | 15.4** | 59.3 | 40.7 | 17.7 | 44.5 | 37.8 |
| Seed weight mean | 6.3 ns | 16.8** | 10.3** | 66.7 | 33.4 | 18.9 | 50.3 | 30.8 |
| Number of seeds × plant | 0.0 ns | 76.5** | 15.2** | 8.3 | 91.7 | 0.00 | 83.4 | 16.6 |
| Average | 17.6 | 21.3 | 11.1 | 49.8 | 50.1 | 34.2 | 39.4 | 26.3 |
*P < 0.05, ** P < 0.01, ns = non-significant
Among populations, all traits showed significant differences (Table 2). The relative amount of phenotypic variation occurred within 5.9 % in fruit weight to 82.0 % in number of fruits per plant and 76.5 % in number of seeds per plant. Among families (within populations), all traits with the exceptions of stem diameter showed significant differences Seed weight per fruit, chlorophyll content number of seeds per plant, leaf width and fruit weight showed the highest values in phenotypic variation, stem diameter was the lowest value. Variation within families was elevated for most traits, only days to flowering, number of fruits per plant and number of seeds per plant displayed values below 10 %. Variation within families oscillated from 33 % in fruit shape to 79 % in stem diameter.
From the total phenotypic variation estimated, 50.1 % presented a genetic basis; from this, 34.2 % was distributed among regions, 39.4 % among populations and 26.3 % within populations. Days to flowering, number of fruits per plant and number of seeds per plant showed total genetic values above 90 %, whilst stem diameter and plant height showed values below 22 %; genetic variance among regions was highest for days to flowering, leaf shape and leaf length and lowest for number of fruits per plant. Genetic variance among populations was elevated for number of fruits and seeds per plant and the lowest values were shown by leaf length and days to flowering. In genetic variation within populations (among families), the values for fruit weight were the highest (55 %) and days to flowering the lowest (9.9 %) (Table 2).
Phenotypic Differentiation among Regions. The one-way ANOVA for regions indicated that all traits were different regionally (Table 3). Northwest region presented elevated values for specific leaf area, fruit width and weight, number of seeds per fruit, seed weight per fruit and seed weight mean. Southeast region showed the highest values for stem diameter, chlorophyll content, leaf length, width, shape area and most elongated fruits. In the south, the highest means of plant height, days to flowering, number of fruits per plant and number of seeds per plant occurred; contrastingly, also the lowest value for seed weight mean. A MANOVA test for regions showed significant differences: F (36, 2036) = 122.77, P < 0.0005; Wilks Λ = 0.099. There were no differences in the amount of phenotypic variation among regions depicted by CVs and a non-parametric ANOVA: χ2 (2) = 0.177, P < 0.916. Reproductive traits were more variable than vegetative and foliar traits.
Table 3 Means of phenotypic traits and CVs of Capsicum annuum var. glabriusculum from three regions of Mexico, superscripts denote Tukey test mean differences (P < 0.05) a > b > c.
| Traits | Northwest | Southeast | South | Average CV |
|---|---|---|---|---|
| Stem diameter | 7.4b (27.6) | 8.7a (29.4) | 7.8b (23.7) | 26.9 |
| Plant height | 81.3b (27.3) | 89.1a (26.2) | 93.7a (20.1) | 24.5 |
| Chlorophyll content | 37.4c (13.9) | 44.4a (15.8) | 42.6b (14.0) | 14.6 |
| Leaf length | 58.1b (25.5) | 83.1a (32.8) | 58.8b (27.7) | 28.7 |
| Leaf width | 38.9b (26.0) | 43.3a (33.5) | 37.8b (29.8) | 29.8 |
| Leaf shape | 1.5 (13.5) | 1.9a (18.8) | 1.6b (17.8) | 16.7 |
| Leaf area | 11.3b (49.3) | 14.6a (62.2) | 9.6c (48.2) | 53.2 |
| Specific leaf area | 304.9a (30.4) | 210.6c (29.6) | 217.3b (33.4) | 31.1 |
| Days to flowering | 172.9c (7.18) | 193.7b (4.12) | 217.3a (3.93) | 5.08 |
| Number of fruits × plant | 37.1b (67.4) | 23.8c (53.6) | 49.4a (77.7) | 66.2 |
| Fruit length | 6.4c (23.4) | 7.6a (22.2) | 6.9b (41.2) | 28.9 |
| Fruit width | 5.77a (20.3) | 5.1c (17.4) | 5.2b (16.1) | 17.9 |
| Fruit shape | 1.1c (14.3) | 1.5a (22.8) | 1.3b (34.0) | 23.7 |
| Fruit weight | 63.5ª (56.0) | 50.2b (41.2) | 46.8c (56.4) | 51.2 |
| Number of seeds × fruit | 9.6a (57.7) | 7.6b (60.0) | 7.8b (58.0) | 58.6 |
| Seed weight × fruit | 33.8a (56.3) | 26.4a (55.1) | 24.1b (49.3) | 53.6 |
| Seed weight mean | 3.7a (29.2) | 3.7a (23.8) | 3.2b (25.4) | 26.1 |
| Number of seeds × plant | 182.2b (69.4) | 119.30c (53.4) | 246.9a (77.8) | 66.9 |
| Average CV | 34.15 | 33.44 | 36.36 |
The multivariate analysis denoted that the first four components above 80 % of total variation (Table 4). Principal component 1 (PC1), defined 41.3 % and was determined by days to flowering, chlorophyll content, plant height, fruit shape, leaf length and width with positive sign; by fruit and seed traits and specific leaf area negatively. PC2 explained 16.3 % of total variation, defined positively by leaf traits, stem diameter and plant height, negatively by fruit, seed traits and specific leaf area. PC3 explained 12.8 % of variation, determined in its positive side by fruit, seed traits, negatively by specific leaf area and seed weight mean. PC4, illustrated 11.5 % of variation, in its positive sector we found fruit length and shape, chlorophyll content, stem diameter, days to flowering and plant height. In the negative sector the main loading was specific leaf area.
Table 4 Results of principal component analysis of phenotypic traits of Capsicum annuum var. glabriusculum of 24 populations from three regions in Mexico. Loads above 0.300 in boldface.
| PC1 | PC2 | PC3 | PC4 | |
|---|---|---|---|---|
| % of variance | 41.3 | 16.3 | 12.8 | 11.5 |
| % of accumulated variance | --- | 57.6 | 70.4 | 81.9 |
| Stem diameter | 0.297 | 0.830 | 0.046 | 0.451 |
| Plant height | 0.591 | 0.545 | 0.182 | 0.353 |
| Chlorophyll content | 0.737 | 0.419 | 0.276 | 0.649 |
| Leaf length | 0.393 | 0.849 | -0.103 | 0.539 |
| Leaf width | 0.285 | 0.909 | -0.045 | -0.076 |
| Leaf shape | 0.354 | 0.508 | -0.076 | 0.819 |
| Leaf area | 0.276 | 0.924 | -0.180 | 0.143 |
| Specific leaf area | -0.435 | -0.353 | -0.413 | -0.641 |
| Days to flowering | 0.780 | 0.079 | 0.240 | 0.492 |
| Number of fruits × plant | -0.187 | -0.223 | 0.905 | -0.207 |
| Fruit length | 0.010 | 0.066 | -0.119 | 0.855 |
| Fruit width | -0.891 | -0.167 | 0.056 | -0.158 |
| Fruit shape | 0.465 | 0.143 | -0.105 | 0.883 |
| Fruit weight | -0.974 | -0.236 | -0.066 | -0.236 |
| Number of seeds × fruit | -0.745 | -0.492 | 0.376 | -0.187 |
| Seed weight × fruit | -0.913 | -0.308 | 0.250 | -0.236 |
| Seed weight mean | -0.212 | -0.611 | -0.433 | -0.196 |
| Number of seeds × plant | -0.176 | -0.218 | 0.913 | -0.187 |
Each region and its populations were differentiated in the bidimensional multivariate space of principal components 1 and 2 (Figure 2). In the positive section of PC1 the populations of the Southeast and South regions were found, associated to elevated values of late flowering, plant height, chlorophyll content, large leaves and elongated fruits and leaves; in the negative section we found the Northwestern populations, associated to large means of fruit weight and width, seed weight per fruit and specific leaf area. In PC2, the positive section clustered Southeastern populations with the exception of Temax (14), linked to large vegetative and foliar traits, the negative section grouped South and Northwest populations, correlated to large means of reproductive traits.
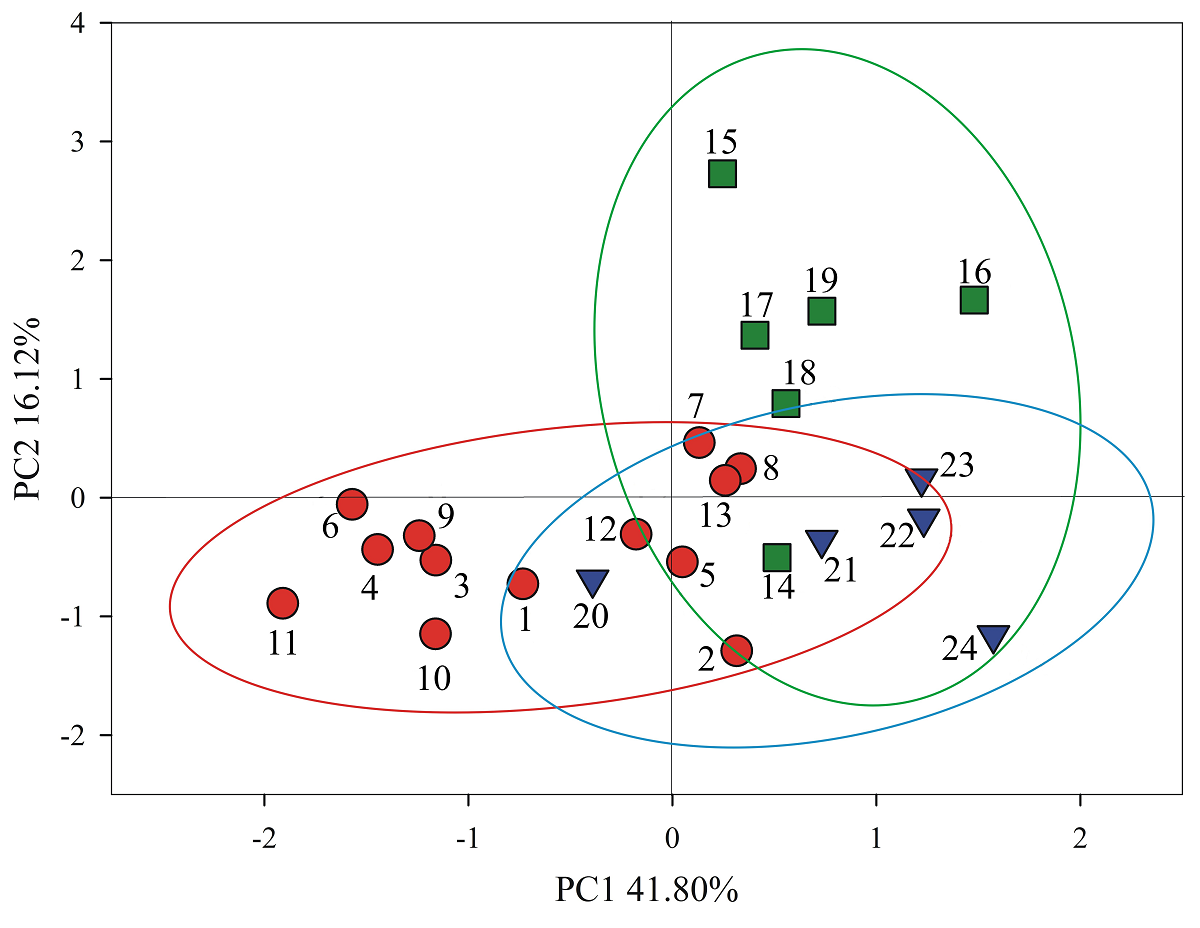
Figure 2 Phenotypic differentiation of 24 populations of Capsicum annuum var. glabriusculum from three regions in Mexico in the bidimensional space of principal components 1 and 2. Northwest (●), Southeast (■), South (▼). Populations listed as in Table 1.
The dendrogram differentiated regions and its populations within two large clusters (Figure 3). The first cluster (1) was divided in two groups, the first group (1A) included all Northwest populations and Calderón (20) from the South; in the second group (1B), Majagual (22), Zaachila (23) and La Parcela (24) from South region were assembled. The second large cluster (2) is also divided in two groups; the first group (2A), included 5 populations of the Southeast, the second group (2B) is composed by Temax (14) and Cerro Colorado (21) from the South region.
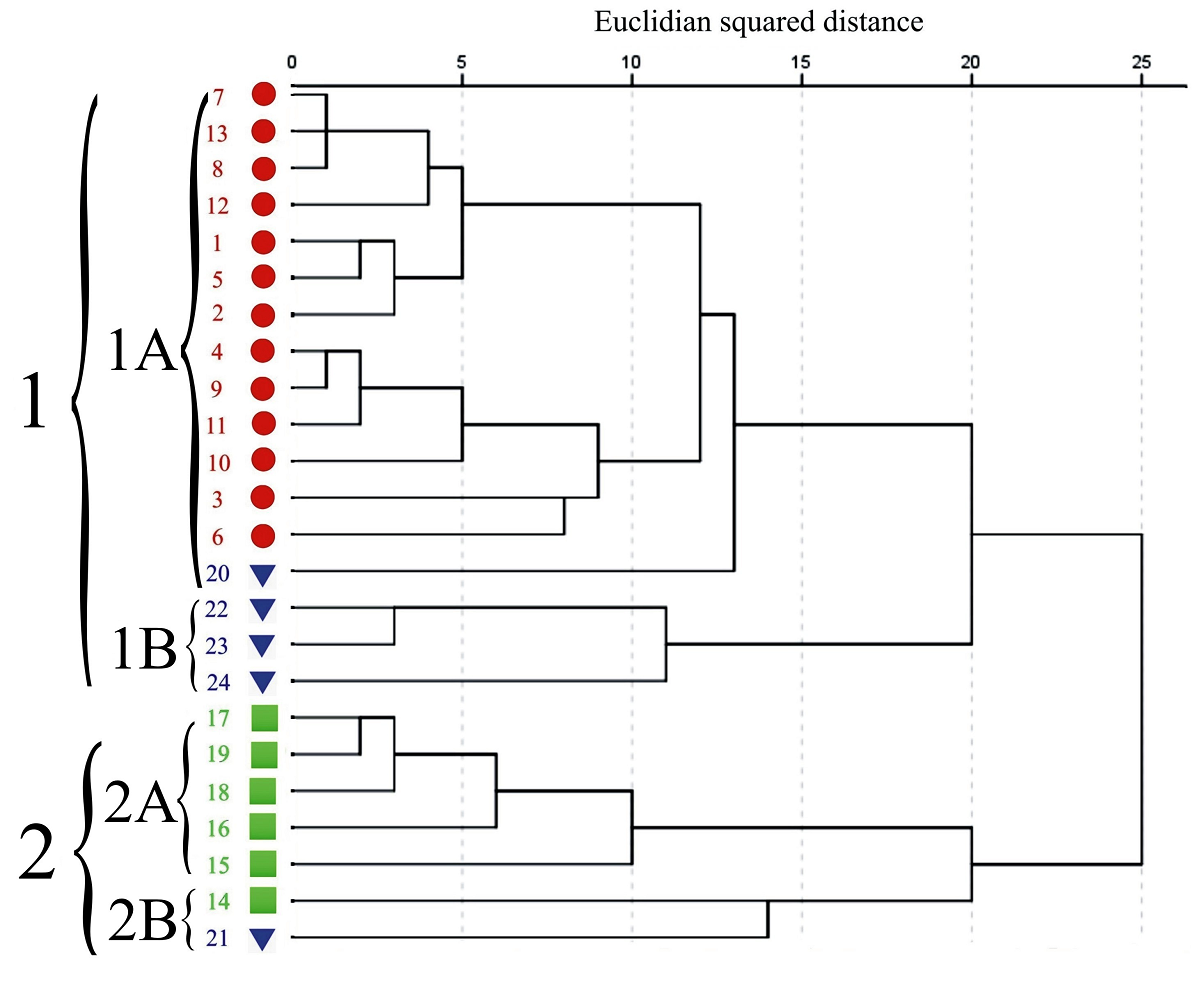
Figure 3 Dendrogram of phenotypic traits means of 24 populations of Capsicum annuum var. glabriusculum from three regions in Mexico. Northwest (●), Southeast (■), South (▼). Populations listed as in Table 1.
Climate Variation. The principal component analysis explains in its first two components over 78 % of the total climatic variation (Table 5). PC1 defined 66.9 % of variation and was built in its positive side by CVs of insolation, temperatures, aridity index, means of maximum temperature, temperature range and PCI; in its negative side we found, means of insolation, rainfall, minimum and mean temperatures. PC2 above 11 % of variation, here positive loadings were means of rainfall, insolation and temperatures; negative loadings were PCI, aridity index, temperature range, CVs of insolation, mean and minimum temperatures.
Table 5 Results of principal component analysis of climate factor of Capsicum annuum var. glabriusculum of 24 populations from three regions in Mexico. Loads above 0.300 in boldface.
| PC1 | PC2 | |
|---|---|---|
| % of variance | 66.97 | 11.42 |
| % of accumulated variance | --- | 78.39 |
| Maximum temperature | 0.689 | -0.166 |
| Maximum temperature CV | 0.672 | 0.024 |
| Mean temperature | -0.874 | 0.529 |
| Mean temperature CV | 0.940 | -0.534 |
| Minimum temperature | -0.902 | 0.476 |
| Minimum temperature CV | 0.792 | -0.476 |
| Temperature range | 0.756 | -0.545 |
| Annual rainfall | -0.594 | 0.940 |
| Precipitation Concentration Index | 0.377 | -0.834 |
| Aridity Index | 0.652 | -0.834 |
| Insolation | -0.949 | 0.606 |
| Insolation CV | 0.945 | -0.603 |
Regions and populations were differentiated in the bi-dimensional space of principal components 1 and 2 (Figure 4). The positive sector of PC1 aggregated all the Northwest populations minus El Roble (13) and included Temax (14) from the Southeast region, this sector was associated to means of maximum temperature, temperature range, PCI, aridity index and CVs of insolation and temperatures. In the negative sector of PC1, the populations of the Southeast and South regions were clustered, defined by means of insolation, rainfall and minimum temperature. PC2 assembled in the positive side the Southeast populations plus Calderon (20) and Zaachila (23) from the South, correlated to means of temperatures, rainfall and insolation. In the negative sector we found Northwest populations besides Cerro Colorado (21), Majagual (22) and La Parcela (24) from the south, linked to temperature range, PCI, aridity index, temperature and insolation CVs.
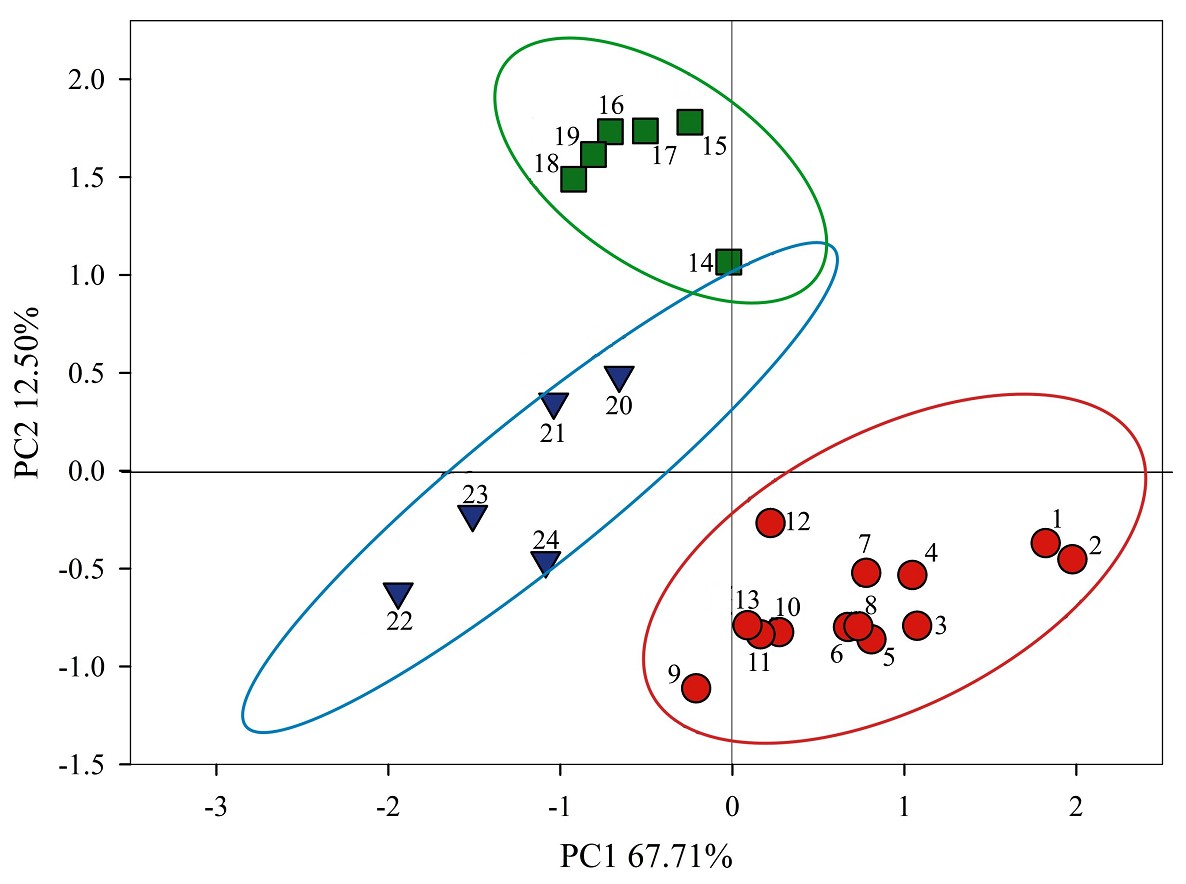
Figure 4 Climate differentiation of 24 populations of Capsicum annuum var. glabriusculum from three regions in Mexico in the bidimensional space of principal components 1 and 2. Northwest (●), Southeast (■), South (▼). Populations listed as in Table 1.
The analysis of linear regressions between climate factors and phenotypic means (Table 6) showed that PCI was the climate factor that generated the most elevated number of significant correlations with phenotypic means. On the contrary, CV of maximum temperature only produced one significant result. By traits, chlorophyll content, specific leaf area and days to flowering were the traits that developed the largest number of significant results; contrastingly, fruits per plant, seed mean weight and number of seeds per plant did not generate any significant result.
Table 6 Significant linear regression coefficients (R2) between latitude, climate factors and population phenotypic trait means of 24 Capsicum annuum var. glabriusculum plants from three regions in Mexico. *P < 0.05, **P < 0.01, empty cells: non-significant results. Abbreviations as listed in Table 1 and main text.
| Latitude | TMax | CV | MAT | CV | TMin | CV | TR | PP | PCI | AI | Ins | CV | |
|---|---|---|---|---|---|---|---|---|---|---|---|---|---|
| SD | -0.24* | --- | --- | 0.24** | -0.22** | 0.33** | -0.20* | -0.62** | 0.45** | -0.42** | -0.32** | 0.25** | -0.24** |
| HT | -0.53** | --- | --- | 0.38** | -0.48** | 0.42** | -0.56** | -0.37** | 0.33** | -0.20* | -0.31** | 0.52** | -0.53** |
| CLO | -0.53** | -0.18* | --- | 0.43** | -0.51** | 0.31** | -0.38** | -0.25** | 0.55** | -0.55** | -0.53** | 0.53** | -0.53** |
| LL | -0.22* | --- | --- | 0.23* | -0.22* | 0.24* | --- | -0.62** | 0.71* | -0.66** | -0.47** | 0.25* | -0.23* |
| LW | --- | --- | --- | --- | -0.06* | --- | --- | -0.28* | 0.23* | -0.22* | --- | --- | --- |
| LS | -0.31** | --- | --- | 0.32** | -0.30** | 0.25* | --- | -0.50** | 0.75** | -0.67** | -0.52** | 0.32** | -0.31** |
| LA | --- | --- | --- | --- | --- | --- | --- | -0.33** | 0.30** | -0.33** | -0.17* | --- | --- |
| SLA | 0.56** | 0.23* | --- | -0.51** | 0.51** | -0.48** | 0.31** | 0.35** | -0.46** | 0.35** | 0.49** | -0.54** | 0.56** |
| FLO | -0.80** | -0.46** | -0.19* | 0.44** | -0.60** | 0.42** | -0.56** | --- | 0.23* | -0.19* | -0.24* | 0.77** | -0.79** |
| FxP | --- | --- | --- | --- | --- | --- | --- | --- | --- | --- | --- | --- | --- |
| FL | --- | --- | --- | --- | -0.19* | --- | --- | --- | 0.24* | --- | -0.21* | --- | --- |
| FW | --- | --- | --- | --- | --- | --- | --- | --- | --- | 0.33** | --- | --- | --- |
| FS | -0.24* | -0.21* | --- | 0.18* | -0.28** | --- | --- | --- | 0.40** | -0.34** | -0.31** | 0.25* | -0.24* |
| FM | 0.34** | 0.25* | --- | --- | 0.20** | -0.18* | 0.33** | --- | -0.17* | 0.35** | --- | -0.32* | 0.33** |
| SN | --- | 0.19* | --- | --- | --- | --- | --- | 0.17* | --- | 0.28** | 0.18* | --- | --- |
| STM | 0.25* | 0.19* | --- | --- | --- | --- | 0.19* | --- | -0.17* | 0.31** | --- | -0.22* | 0.25* |
| SMA | --- | --- | --- | --- | --- | --- | --- | --- | --- | --- | --- | --- | --- |
| TSN | --- | --- | --- | --- | --- | --- | --- | --- | --- | --- | --- | --- | --- |
The analysis of regression between principal components 1 of climate factors and phenotypic variation (Figure 5), explained above 40 % of the covariation, with high statistical significance (P < 0.001).
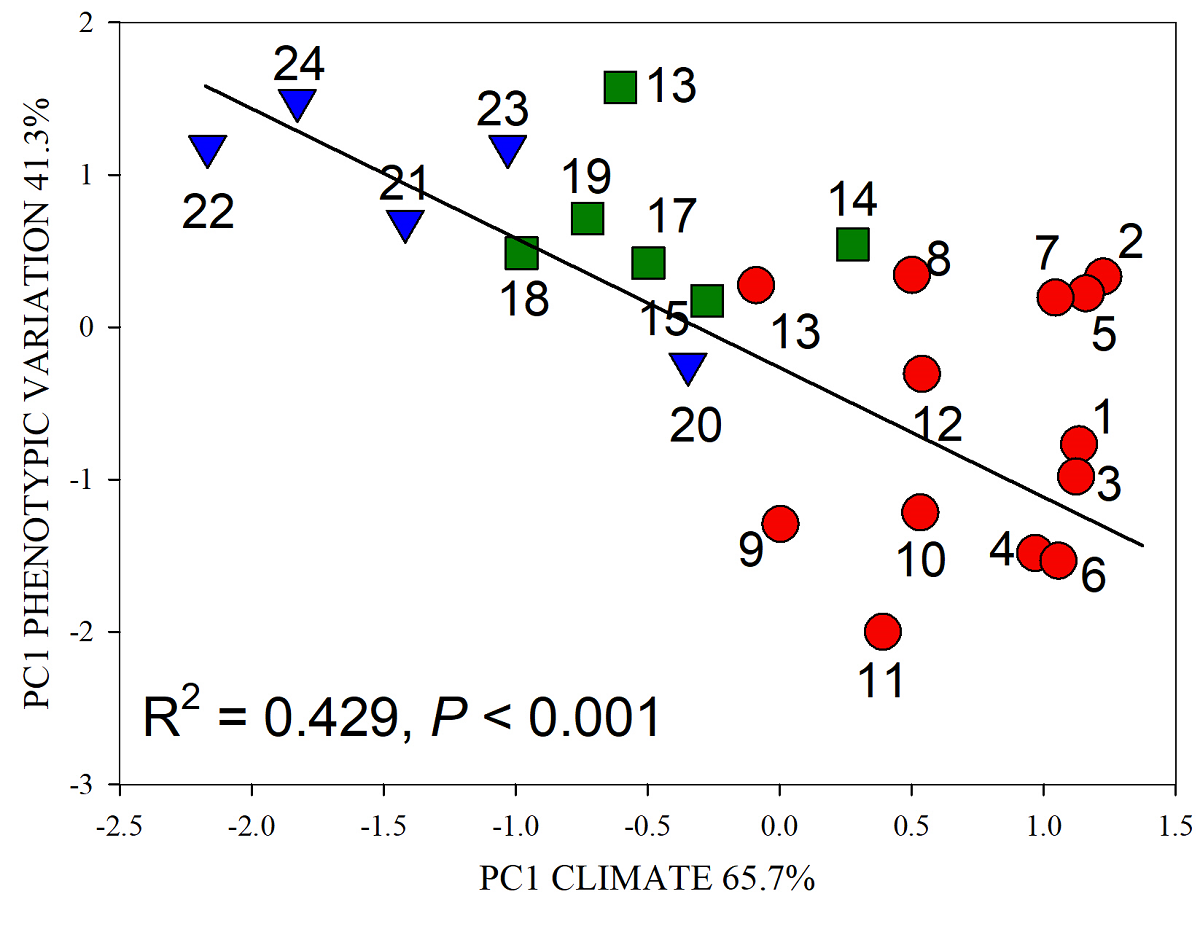
Figure 5 Regression analysis between principal components of climate (independent variable) and principal component phenotypic variation (dependent variable) of Capsicum annuum var. glabriusculm populations from regions Northwest (●), Southeast (■), South (▼) in Mexico. Populations listed as in Table 1.
DISCUSSION
Distribution of Phenotypic and Genetic Variation. Since plants in this experiment were grown in controlled conditions in a greenhouse, phenotypic differences among regions and populations are due to genetic differentiation. The pattern of phenotypic variation found here matches the results of Yoko et al. (2020) in Geum triflorum. Specifically for Capsicum annuum var. glabriusculum, results are similar to those of Hernández-Verdugo et al. (2008) where the largest portion of phenotypic variation is found within families. Here, phenotypic distribution within families can be attributed mainly to environmental variation; however, since C. annuum var. glabriusculum plants are not genetically identical (clones), differences among individuals within a family cannot be separated from the effects of environmental variation (Hernández-Verdugo et al. 2008).
From the total phenotypic variation observed, 50.1 % had a genetic basis, pointing that Capsicum annuum var. glabriusculum traits possess a large genetic basis to cope with environmental variability. Here, the amount of total genetic variation is larger to the amount described by Hernández-Verdugo et al. (2008); traits as days to flowering, number of fruits per plant and number of seeds per plant showed in average values above 90 % of genetic variance, hence these traits could respond rapidly to natural selective pressures (Venable & Búrquez, 1989). Among populations, fruits and seeds traits, linked directly to fitness as number of fruits per plant and number of seeds per fruit, showed the highest means of genetic variance, suggesting that particular local selective pressures produce a great amount of the differentiation of these traits (Rice & Mack, 1991, Hernández-Verdugo et al. 2008). Within populations (among families), over half of the analyzed traits surpassed 25 % of genetic variation, including reproductive traits associated to fitness. However, the amount of genetic variation within families in our study is lower, our results do not match the proportions of genetic variation among-and-within populations described by diverse molecular methods Hernández-Verdugo et al. (2001), Oyama et al. (2006) and Pacheco-Olvera et al. (2012). The discrepancies found in the distribution pattern of genetic variance, may be due to the fact that we performed our analysis in a broader fashion, including regions and a greater number of populations with contrasting environmental conditions. Also, we also performed our analysis in a larger number of traits.
Differentiation among Regions and Populations. Our study outcome matches the previous results described by Hernández-Verdugo (2018) in Northwestern Mexico for phenotypic traits measured in greenhouse-controlled environments and with molecular markers. These results also coincide with studies of isoenzymes by Hamrick & Godt (1997), RAPDs by Bussell (1999) and phenotypic markers by Rice & Mack (1991), who described that highly selfing species (as C. annuum var. glabriusculum) showed significant differences among its populations.
Univariate and multivariate analysis on quantitative traits, allowed us to clarify the phenotypic differentiation. Capsicum annuum var. glabriusculum plants of the Northwest region showed small vegetative and foliar traits, high specific leaf area, obtuse leaves, large and spherical fruits with large amounts of seeds and seed weight per fruit. Plants of the Southeast region displayed large vegetative and foliar traits, elongated leaves, low specific leaf area, smaller elongated fruits with few seeds. South region plants produced intermediate trait means in chlorophyll content, specific leaf area, leaf shape, fruit length, width and shape; lowest values for leaf area and seed mean weight; but conversely the largest means for delayed flowering, fruits per plant and number of seeds per plant. Also, South trait means are intermediate within the regional trait variation spectra in the following way, sharing mean phenotypic values with the Northwest region for stem diameter, leaf length and width; with the Southeast region for plant height, fruit weight, seed number per fruit and seed weight per fruit. Values of phenotypic variation above 20 % were also detected for different species of Capsicum by Ornelas et al. (2021).
The pattern of phenotypic differentiation described above, concurs with the results of Snow & Whigham (1989) in Tipularia discolor, where vegetative growth is negatively correlated to reproductive effort. Our result suggests that natural selection acts independently in the different regions regarding vegetative, foliar and reproductive traits. This pattern of differentiated allocation of resources strategies in each region, could constitute a potential limitation to reach an optimum phenotype in Capsicum annuum var. glabriusculum (Scheiner & Berrigan, 1998).
Climate and Phenotypic Covariation. Given the nature of regional climate and phenotypic differentiation, the analysis of regressions between climate factors with phenotypic means showed that vegetative and foliar size and shape traits plus fruit shape correlated positively to means of temperature, rainfall and insolation and negatively to climate measures of variation. Inversely, specific leaf area and reproductive traits associated positively to measures of climate variation. Multivariate analysis of phenotypic traits and climate factors drew a complete picture of its covariation, depicting that larger reproductive traits, earlier flowering, specific leaf area and smaller plants of Capsicum annuum var. glabriusculum are found in the arid, seasonal and more variable climates of the Northwestern edge of the sampled environmental continuum. In a humid and less variable climate of the Southeast region, we detected larger plants, large elongated leaves, reduced specific leaf area and small reproductive mean traits; Southern regions plants showed intermediate phenotypic mean traits in an intermediate climate scenario.
In our study, stem diameter and plant height correlated negatively to latitude, this pattern coincides with one described by Li et al. (1998) in Arabidopsis thaliana and Olsson & Ågren (2002) in Lythrum salicaria and specifically in Capsicum annuum var. glabriusculum by López-España et al. (2016). In foliar traits, the behavior of chlorophyll content matches the pattern depicted by Li et al. (2018) who pointed a negative correlation of chlorophyll amount and latitude. The pattern of leaf size is similar to the results of Wright et al. (2017), where larger leaves were found in more humid sites. Specific leaf area presented larger values in populations with arid, seasonal and variable environments from the Northwest region, this pattern suggests a conservative vegetative growth strategy for Capsicum annuum var. glabriusculum in the studied transect. According to Xie et al. (2012), high means of specific leaf area explain smaller plant sizes in Gossypium, an analogous pattern detected here.
Capsicum annuum var. glabriusculum plants from Northwest Mexico, flowered earlier, coinciding with the results of Del Pozo et al. (2000) with Medicago polymorpha, where populations in arid sites presented an earlier flowering due to an induced shorter reproductive season given an irregular rainfall season, higher maximum temperature, larger variation of insolation and temperatures. In reference to fruit size variation, in the Southeast and South regions, with a larger mean of annual rainfall and more constant temperatures we detected smaller fruits but more elongated, a similar result described by Sinnott-Armstrong et al. (2018).
Previous studies as those of Jonas & Geber (1999) in Clarkia unguiculata, Hall et al. (2007) for Populus tremuloides, Nooryazdan et al. (2010) for Helianthus and López-España et al. (2016) for C. annuum var. glabrisuculum, where genotypes were collected on field conditions then grown in greenhouse-controlled conditions, when regressed with climate factors of their populations of origin developed clinal trends (monotonic increasing or decreasing trends). These authors indicated that clinal trends can point an adaptive value of regressed traits due to population differentiation driven by local selective pressures that act orderly along the analyzed environmental gradient. Here, we detected that over half of the analyzed traits correlated significantly with at least seven climate factors; this suggest that in the analyzed environmental gradient climate factors can explain a good portion of the phenotypic-genetic variance detected, which in turn might have and adaptive value for the described traits.
We also detected traits that did not show statistical significance in its linear regressions with climate variation, some of these traits were directly associated to fitness, as number of fruits per plant and number of seeds per plant. However, they showed marked phenotypic and genetic differentiation. These patterns of phenotypic differentiation may indicate that other factors distinct from climate may drive phenotypic-genetic differentiation among Capsicum annuum. annuum var. glabriusculum populations, these could include specific biotic factors (Pan et al. 2012) or the particular interplay between biotic and abiotic factors in each population (Hulshof et al. 2013), which eventually might produce particular selection regimes (non-clinal) and lead populations to a local optimum. Other possibility could be genetic drift, since it causes random changes, independent from local selection conditions (Schmid & Guillaume 2017).
However, the results found here may be taken conservatively since produced phenotypic traits were generated upon F1 generation plants, where the expression of recessive alleles (i. e. phenotypic traits) might be hidden by dominant homozygosity. Nevertheless, the large genetic reservoir depicted here among and within populations of Capsicum annuum var. glabriusculum might constitute a potential solution to environmental deterioration if habitat fragmentation does not cut off genetic flow or the rate of environmental change exceeds the wild populations capacity to evolve. So, the detected genetic variation of Capsicum annuum var. glabriusculum is of paramount relevance for its inherent value as a natural genetic resource and as a foundation in the conservation, management and restoration of its populations (Bucharova et al. 2017).
In the climate change scenario, considering the significance of the covariance between the environmental and phenotypic variation of traits linked to fitness, it suggests that Capsicum annuum var. glabriusculum populations could be affected in different proportions by temperature increase and rising irregularities in rainfall patterns. As a potential example, days to flowering could advance its onset in response to increasing temperatures, generating asynchronies with subsequent phenological stages (Parmesan 2006). van Dijk and Hautekèete (2014), found evidence of genetic changes for an earlier flowering in Beta vulgaris, produced probably by rapid micro-evolutionary changes or due to genetic flow through adjacent populations. In recent decades, climate change has been demonstrated as a result of human activities, it has already changed distribution and abundance of species (Hu et al. 2010) and this trend will go on (Anderson et al. 2009).
The current study illustrated that sampled populations of Capsicum annuum var. glabriusculum from the three regions showed a wide phenotypic differentiation and genetic variation. Overall, reproductive traits showed the largest phenotypic variation. A considerable amount of genetic variation preceded the phenotypic variation, most of it occurred among populations, but genetic variation among regions and within populations were also considerable. Amounts of phenotypic and genetic variation varied among traits.
Climate variation explained significantly a large proportion of the phenotypic differentiation across the sampled range. Contrasting patterns in allocation of resources were detected. A shorter and irregular reproductive season due to aridity and marked seasonality in the Northwest region may induce a conservative vegetative and foliar growth; occurring the opposite in the southeast region. South populations developed intermediate mean phenotypic traits. These responses had a strong genetic base, which in turn can provide Capsicum annuum var. glabrisuculum populations a solid support to cope with increasing environmental heterogeneity in the face of climate change and other risks of habitat deterioration. However, genetic differentiation among regions and populations may delineate standards of management of this valuable natural genetic resource.

