


 text new page (beta)
 English (pdf)
 Article in xml format
 Article references
 Send this article by e-mail
 Cited by SciELO
  Similars in
SciELO
Similars in
SciELO 
 Permalink
Geographic distribution is a key attribute of populations and species (Gould & Johnston 1972, Herrera et al. 2006); therefore, it is not surprising that important evolutionary and ecological theories rely on geographic assumptions. For example, the theory of island biogeography (MacArthur & Wilson 2001), isolation by distance (Wright 1943), and the unified neutral theory of biodiversity (Hubbell 2001) all have geographic distance as a key component. Geographic distance between populations not only promotes differentiation by limiting gene flow (Wright 1943) but also by increasing the environmental differences between them (Lee & Mitchell-Olds 2011). Additionally, plant populations that span beyond their natural pollinators’ distribution range might become adapted to a new suite of pollinators (Grant & Grant 1965, Stebbins 1970). In turn, by facilitating environmental distance, limiting gene flow, and exposing plants to different pollen vectors, geographic distance promotes phenotypic variation. Therefore, studying how plant morphology changes across a geographic range improves our understanding of the drivers of morphological diversification both on a macro- and micro-evolutionary scale.
Several studies have shown that flower morphology varies across a large distribution range because of the variation of abiotic factors such as precipitation, temperature, daylight, soil composition, etc., (Galen 2000, Halpern et al. 2010). In various experimentally controlled populations (Elle & Hare 2002, Galen 2000, Halpern et al. 2010), and naturally occurring populations, (Herrera 2005, Lambrecht & Dawson 2007), variation in available water has been shown to alter plant morphology. In particular, plants growing in drought conditions tend to have smaller corollas (Elle & Hare 2002, Lambrecht & Dawson 2007) but in other cases, water scarcity results in trade-offs between female and male reproduction. In the latter scenario, plants that survive drought have larger flowers and low seed mass or vice versa (Galen 2000). On the other hand, the effect of temperature is not uniform across species. Low temperatures have been shown to retard anthesis and reduce flower size in some species (Murcia 1990) while in others, a decrease in temperature is associated with larger floral displays (Shin et al. 2000). In particular, cold air temperature can slow the development of flowers in cape daisy (Pearson et al. 1995), increase flower numbers in satsuma mandarin (Poerwanto & Inoue 1990), and decrease flower size in morning glory (Murcia 1990) and sweet cherry (Zhang et al. 2015).
Geographic distance between populations and species with disjunct distribution has motivated several studies on species delimitation (Ellison et al. 2004, Ramsey et al. 1994). These studies usually characterize the morphological diversity within a species, which sometimes resulted in the creation of a new taxon even when only vegetative characters varied between populations (Ellison et al. 2004, Ramsey et al. 1994). Some studies have explored the geographic basis of flower morphology variation (Hodgins & Barrett 2008, Nattero et al. 2011, Pérez-Barrales et al. 2009) and found that flower morphological divergence is often correlated with geographic distance (Hodgins & Barrett, 2008). But geographic distance does not always promote phenotypic diversity. In some instances, research has failed to find any considerable morphological differences between geographically distant populations (Rech et al. 2018).
Despite the importance of studying geographic distance as a driver of phenotypic divergence, geographic variation in flower morphology has not received sufficient attention in the literature (Johnson 2006). Very few studies have investigated the geographic variation in flower morphology in congeneric species (e.g.,Barrett & Freudenstein 2011), and those that have, focused on one species and used additional species as outgroups.
Climate change increases the year-to-year variation in temperature (Diffenbaugh & Ashfaq 2010) and precipitation (Li et al. 2019), which could have direct effects on flower morphology (Elle & Hare 2002, Lambrecht & Dawson 2007, Murcia 1990). In addition to the detrimental impacts that changing temperature and precipitation have on plant survivability (Galen 2000), a decrease in fitness due to resource allocation is also expected (Halpern et al. 2010). Finally, with the intensification of extreme weather due to climate change (Diffenbaugh & Ashfaq 2010, Li et al. 2019), alterations in adaptive traits that are partially controlled by the environment are expected, and this could disrupt the interaction between flowers and their pollinators (Alqudah et al. 2011, Petanidou et al. 2000). Therefore, it is important to understand how yearly variations in temperature and precipitation affect flower morphology. However, while climate change has been shown to affect phenology (Anderson et al. 2012, Calinger et al. 2013, Franks et al. 2007) increasing concerns about its potential effect on plant-pollinator interactions (Burkle et al. 2013, Polce et al. 2014, Rafferty & Ives 2011) the effect of temperature and precipitation on flower morphology has received little attention.
The goals of this study were to 1) evaluate the effect of geographic location (longitude, latitude, and altitude) and abiotic factors (temperature and precipitation) on flower morphology between populations, 2) understand the geographic patterns of flower morphology variation, and 3) assess how yearly variation in temperature and precipitation affect flower morphology within populations. Five species of Penstemon Schmidel (Plantaginaceae) were considered in this study (P. albidus Nutt, P. fruticosus (Pursh) Greene, P. glandulosus Douglas ex Lindl., P. speciosus Douglas ex Lindl., and P. whippleanus A. Gray). We hypothesized that species with the widest distribution will present larger morphological variation than species with narrow distribution. We also anticipated that an increase in temperature and decrease in precipitation between years would have a detrimental effect on plant reproductive traits. Most of the morphological studies on Penstemon have focused their attention on the differences in flower morphology between species pollinated by birds and those pollinated by insects (Castellanos et al. 2004, Wessinger et al. 2014, Wessinger & Hileman 2016). Very few studies have characterized morphological variations within a species, and those that have are restricted to a few sites (Parachnowitsch & Kessler 2010). Consequently, little is known about floral trait variation across large distributional ranges within species, or between species playing similar pollination syndrome. Because of the variation in its floral characteristics and extended distribution, Penstemon is an excellent system to study geographic variation in flower morphology. The goal of our study is to understand the drivers of morphological divergence between species that share a genetic background but grow in different environmental conditions. Throughout this paper, we focus on the interaction between geographic distance and environmental variation and their effect on flower morphology.
Materials and methods
Studied species. Penstemon was originally divided into six subgenera, but recently, the genus was tentatively reorganized into two subgenera in the Flora of North America (FNA) treatment. For convenience, we will refer to the traditional taxonomy, because it characterized suites of traits that are distinctive. With ca. 270 species, Penstemon is the largest genus of plants endemic to North America. For this study, we selected five species (P. albidus, P. fruticosus, P. glandulosus, P. speciosus, and P. whippleanus); the selection was based on three criteria: 1) wide geographic distribution (Figure 1), 2) diverse floral morphology (Figures 2, 3) representation of species-rich groups (Nold 1999). A detailed description of each species can be found in Supplementary material.
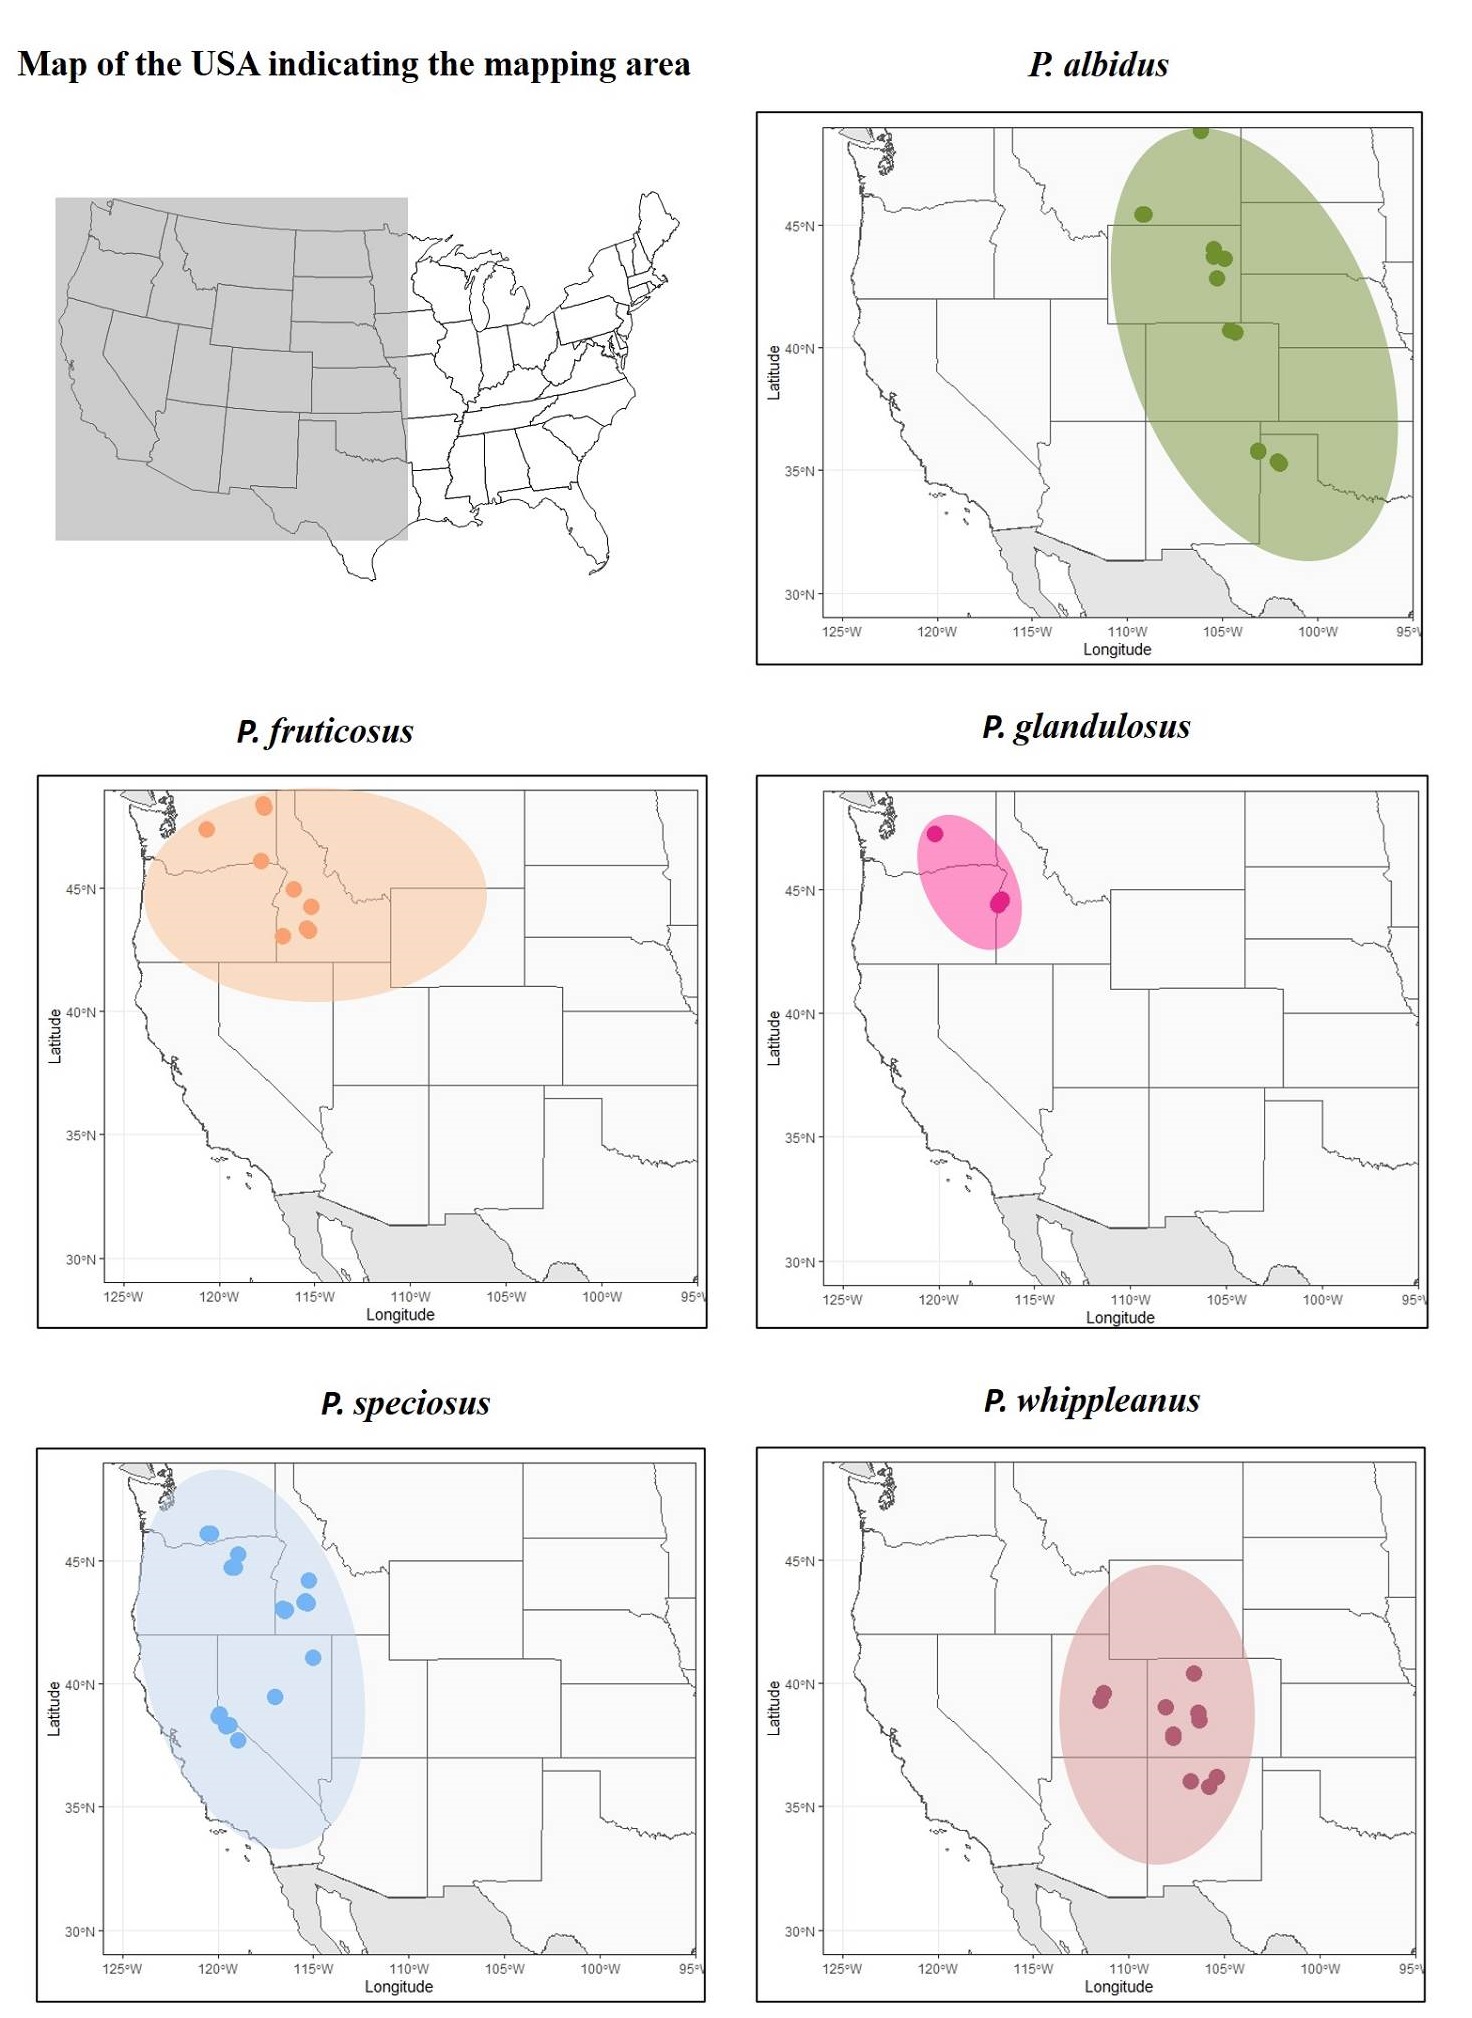
Figure 1 Distribution map of the studied species in the United States of America. The dots represent the sampled locations, and the shaded area represents their natural distribution.

Figure 2 Represents the flower morphology of the five species of Penstemon included in this study. A = P. albidus, B = P. fruticosus, C = P. glandulosus, D = P. speciosus, E-F = P. whippleanus.
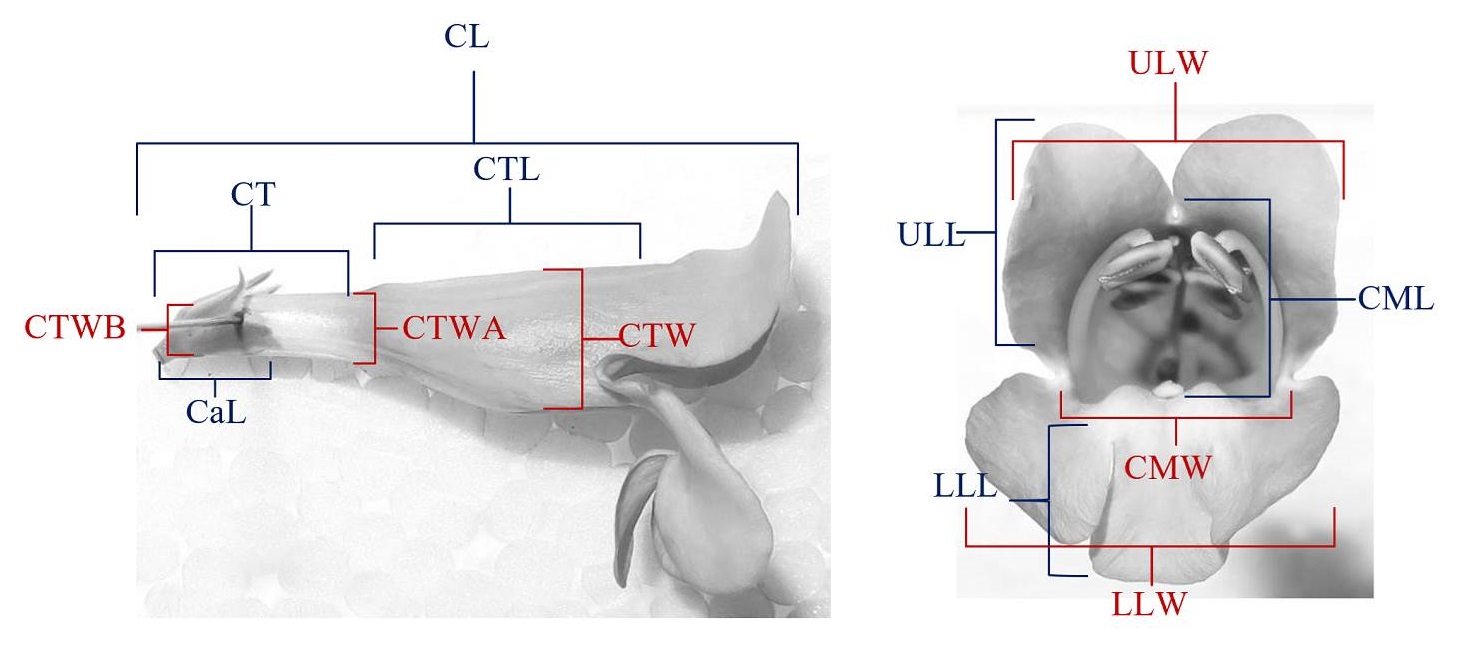
Figure 3 Shows how each measurement of the flower morphology was made. See Table 1 for descriptions of the acronyms.
Sampling and Data collection. Our sampling spanned the complete distribution of all the species in the USA. (Figure 1). To establish collection sites, a list of potential sampling sites was created using two online herbarium datasets, Intermountain Regional Herbarium Network and Consortium of Pacific Northwest Herbaria. The list contained all the herbarium records of specimens collected with flowers; however, we were more successful at finding sites from samples collected from 2000 to 2017. During the summers of 2017 and 2018, five to 10 individuals in each of the 57 sites sampled (Table S1) were selected at random to measure 10 floral traits (Figure 3, Table 1). We refer to these sampling sites as populations. Two environmental variables, annual mean temperature and annual precipitation (from this point forward, temperature and precipitation, respectively), were extracted from the WorldClim database (Fick & Hijmans 2017): Current conditions (~1960-1990)) to characterize ecological differences between populations. The altitude at each population was obtained from a raster file of the USA, elevation (Fick & Hijmans 2017) using the coordinates from each population. For the between-year and within-population comparison, temperature and precipitation values were extracted from NOAA (www.noaa.gov) and corresponded to the 2017 and 2018 average temperature between April and July and the total precipitation in the same months. The selected species flower sometime between May and early July; therefore, the temperature and precipitation between April and July should have the largest impact on flower morphology.
Table 1 Flower traits and the abbreviation used throughout the paper.
| Floral traits | Acronym |
|---|---|
| Corolla length$ | CL |
| Corolla mouth length$ | CML |
| Corolla mouth width | CMW |
| Corolla throat length | CTL |
| Corolla throat width$ | CTW |
| Corolla tube width (apical) $ | CTWA |
| Lower limbs length$ | LLL |
| Lower limbs width$ | LLW |
| Upper limbs length$ | ULL |
| Upper limbs width$ | ULW |
$ variable used in the canonical correlation analysis.
Statistical Analysis. To reduce dimensionality, a principal component analysis (PCA) was carried out for each species on the ten flower attributes measured using the function “prcomp” and the R package “stats‘. From this point forward, we called this analysis, the species-specific PCA. Then, the first PC (PC1) of each species-specific PCA was extracted and used as a response variable in the linear models with the geographic variables as predictors and the variable importance analysis (more details below). We also computed another PCA based on the morphological variables of species/populations sampled in both years (2017 and 2018). We called this analysis the yearly PCA. We did not divide this last analysis by species because the sample size was too small. The first PC (PC1) was then extracted and used as a response variable to evaluate the effect of yearly variation in temperature and precipitation on flower morphology.
In order to understand the geographic patterns of flower morphology variation, we developed a linear model for each species. In these models, the first PC of the species-specific PCA was the dependent variable, longitude, latitude, and altitude were the independent variables, and a population fixed effect was included. We clustered the standard errors based on populations following the natural grouping of our samples and used the function “lm.cluster”, from the R package “miceadds” (Robitzsch & Grund 2021), to estimate the linear model.
Additionally, a set of Mantel tests was computed to complement the linear model, to better understand geographic patterns of floral variation, and to quantify the contribution of each species to the total geographic variation in flower morphology. First, a global Mantel test was computed with all species. Then, one species was extracted from the dataset and another Mantel test was performed. This action was repeated once for each of the five species. The result from the global Mantel test was then compared to the reduced Mantel test to determine the contribution each species has to the total variation in flower morphology. The matrices were built as follows. We created a “morphological matrix”, which included the population mean values of all the floral morphology measured and a “geographic distance matrix” with the pairwise geographic distance between populations in meters. The geographic matrix was created by calculating the geodesic distance between the populations with the function “distGeo” from the R package “geosphere” (Hijmans et al. 2016). The morphological matrix was transformed into a Euclidian distance matrix using the function “dist” from the R package “vegan” (Oksanen et al. 2019). Then, the R package “cultevo” (Stadler 2018) and the function “mantel.test” was used to test the correlation between the geographic distance matrix and the morphological distance matrix. The Spearman method was chosen to compute the correlation coefficient, and the maximum number of permutations to be computed was set to 999,999.
To assess how annual variation in temperature and precipitation affect flower morphology, we developed a similar linear model to the one described above. For this analysis, we used a subset of the data previously described and only included the 12 populations sampled in both years (2017 and 2018). Because this dataset is smaller, we did not split it by species but created one model for the entire dataset. As before, the first PC of the yearly PCA was used as the dependent variable. The independent variables included precipitation and mean temperature from April to July of 2017 and 2018. The year of collection and population of origin were included as fixed effects.
To evaluate the comparative effect of geographic location (longitude, latitude, altitude) and the environment (temperature and precipitation) on flower morphology, a partial least squares (PLS) regression analysis was used. This analysis allows us to determine the most important predictor of species-specific PC1 among the five factors listed above. PLS regression analysis is particularly useful when predictors are correlated (Wehrens & Mevik 2007) and the response variable is sensitive to many of them (Luedeling & Gassner 2012). Five PLS regression analyses (one per species) were carried out using the R package “mdatools” (Kucheryavskiy 2020) and the following specifications: 1) species-specific PC1 was set as the dependent variable, 2) the independent variables were longitude, latitude, altitude, temperature, and precipitation, 3) the number of segments for cross-validation was set to 10, and 4) the threshold for variable importance selection was set to 0.8, following (Wold 1995). All the analyses included in this study were computed using the R software (R Core Team 2020).
In addition, we used canonical correlation analysis to understand the association between the variation in flower morphology and the geographic and climatic variables. This analysis was performed on the dataset containing all the species and observations. Before performing the ordination analysis, we tested whether the variables followed a multinormal distribution using the Shapiro-Wilk test in the R package “mvnormtest” (Jarek 2012). The results indicated that multivariate normality cannot be assumed (P-value < 0.001). Given this and the fact that our sample size was relatively small, we reduced the number of morphological variables from 10 to eight and took caution when interpreting any but the most significant canonical root following Barcikowski & Stevens (1975). To reduce the number of morphological variables, the correlation between them was computed, and variables that were more than 80 % correlated with multiple variables were eliminated from this analysis. The final dataset had 496 observations, eight morphological variables (Table 1), two environmental variables (mean annual temperature and annual precipitation), and three geographic variables (altitude, longitude, latitude). The R packages “CCA” (González & Déjean 2021) and “CCP” (Menzel 2012) were used to perform a canonical correlation analysis and significant tests, respectively, following Anderson & Willis (2003).
Results
We sampled 496 individuals across 57 populations. Twelve populations were sampled in both years (Table 1). The percentage of the variation explained by the species-specific PC1 ranged from 40 to 42 %, except in P. speciosus where PC1 captured 32 % of the variation in flower morphology. Cumulatively, PC1 and PC2 explained 59 % in P. albidus, 59 % for P. fruticosus, 61 % P. glandulosus, 49 % P. speciosus, and 55 % P. speciosus. For three of the species (P. albidus, P. glandulosus, and P. whippleanus) the first PC was dominated by variables that described the width of the corolla, and for the other two species (P. fruticosus and P. speciosus), no particular variable dominated PC1. In these two species, the second PC (PC2) was dominated by one variable, the corolla tube width. Variables that describe the length of the corolla had the highest contribution to PC2 in P. albidus (corolla length) and P. glandulosus (corolla limbs). The corolla throat length and the mouth width dominated PC2 in P. whippleanus. On the other hand, the PCA computed using the 12 populations sampled in both years captured 59 % of the variation in PC1 and an additional 11 % in PC2. Variables associated with the corolla width dominated PC1 and the corolla length dominated PC2.
The regression analysis with the geographic variables as predictors had low R-squared except for P. albidus (R-squared = 0.32) and P. glandulosus (R-squared = 0.61), meaning that for the other species, the geographic variables explained a small percentage of the variation found in PC1 (Table 2). Longitude and latitude were significant predictors (P-value < 0.01) in both species and the altitude was only significant for P. glandulosus. In particular, P. albidus flowers were smaller in the south and increased as one moves north. This south-north divergence was also evident in the PCA plot (Figure S1). Similarly, flower size increased from east to west. In contrast, there was a negative relationship between flower size and longitude and latitude for P. glandulosus. This means that flowers in the southeast were larger than flowers in the northwest. This is in concordance with the geographic distribution of the two varieties (Figure 1). Specifically, var. chelanensis had smaller corolla than var. glandulosus. Results from the PCA plots (Figure S2) corroborated the findings in the regression analysis.
Table 2 Regression coefficient estimates and significance values for the geographic variables
| Species | P. albidus | P. fruticosus | P. glandulosus | P. speciosus | P. whippleanus |
|---|---|---|---|---|---|
| R-squared | 0.32 | 0.21 | 0.62 | 0.12 | 0.17 |
| Intercept | 110.89** | 87.13 | -759.40** | -41.69 | 115.68 |
| Altitude | -1.72 | -4.26 | -4.76** | 0.74 | -9.31 |
| Latitude | 3.92** | -5.72 | -139.41** | -1.06 | -8.13** |
| Longitude | 109.42** | 25.17 | -1206.13** | -35.27** | 9.06 |
| Population | 0.04 | -0.22 | 0.61** | -0.07 | 0.04 |
**P-values < 0.01, *P-values ≤ 0.05
Even though the R-squared values for P. speciosus and P. whippleanus were small (Table 2), the longitude and latitude were identified as significant predictors, respectively. Therefore, we used caution when interpreting these results. The longitude was negatively correlated with PC1 for P. speciosus, which means that flower size increases from east (Idaho and Nevada) to west (California and Washington). The PCA plot (Figure S3) showed a small group of individuals from populations 8, 9, and 10 together, but this association was not based on geographic distance. The rest of the individuals in the plot were scattered, which indicates that flower morphology is not conserved between populations. In P. whippleanus, the latitude was negatively correlated with PC1. This indicates that populations in northern New Mexico had smaller flowers than populations in northern Colorado. The PCA plot (Figure S4) shows no association of individuals by population and indicated a small variation in flower morphology between most populations. Finally, the R-squared value for P. fruticosus was higher than for the previous species, but none of the predictors were statistically significant, which means that there is not enough variation between populations. These results are supported by the PCA plot which shows no association between individuals collected in the same population (Figure S5).
The global Mantel test indicated a strong and significant correlation between the geographic distance and the morphological distance (Mantel statistic r = 0.67, P-value < 0.01). Penstemon albidus was the only species whose exclusion reduced the Mantel statistic (r = 0.60, P-value < 0.01). Removing any other species had no effect or a small but negative effect on the Mantel statistic r (P. fruticosus r = 0.69; P. glandulosus r = 0.68; P. speciosus r = 0.68; and P. whippleanus r = 0.67; P-value < 0.01). These results indicate that P. albidus had the largest contribution to the total geographic variation in flower morphology. Annual fluctuations in temperature and precipitation were not significant predictors of the PC1 based on the 12 populations sampled in 2017 and 2018 (Table 3). The results show that both temperature and precipitation were negatively correlated with PC1, but this relationship was not statistically significant. The year of collection and the interaction between temperature and precipitation showed a positive correlation, but these results were also not significant. Together, these results indicate that the small variation in corolla size detected between years could have been due to chance. Alternatively, the sample size could have been too small to detect a significant effect.
Table 3 Regression coefficient estimates of the variation in precipitation and temperature
| Coefficients | Estimate | Std. Error | t value | P-value |
|---|---|---|---|---|
| Intercept | 85.063 | 56.377 | 1.509 | 0.131 |
| Prec$ | -16.343 | 11.043 | -1.480 | 0.139 |
| Temp$$ | -7.030 | 3.739 | -1.880 | 0.060 |
| Year 2018 | 1.031 | 0.605 | 1.703 | 0.089 |
| Prec$ X Temp$$ | 1.347 | 0.729 | 1.847 | 0.065 |
$ Precipitation and $$ Mean Temperature from April to July of 2017 and 2018
Among the five explanatory variables studied (longitude, latitude, altitude, annual precipitation, and mean annual temperature), PLS regression analysis identified longitude and annual precipitation as the most important variables (Table 4). The variable importance scores across species were twice as high for longitude than for precipitation, except for P. glandulosus where both values were very similar. This means that geographic components were more important at explaining patterns of variation in flower size across populations than environmental ones. These results are consistent with the previous regression analysis (Table 2) that identified either the longitude, latitude, or both as significant predictors of PC1 in four of the five species studied.
Table 4 Variable importance scores
| Altitude | Longitude | Latitude | Prec$ | Temp$$ | |
|---|---|---|---|---|---|
| P. albidus | 0.00 | 2.15** | 0.00 | 0.61 | 0.00 |
| P. fruticosus | 0.00 | 2.04 | 0.00 | 0.91* | 0.00 |
| P. glandulosus | 0.00 | 1.50** | 0.00 | 1.66** | 0.00 |
| P. speciosus | 0.00 | 2.08** | 0.00 | 0.81 | 0.00 |
| P. whippleanus | 0.00 | 2.06 | 0.00 | 0.87 | 0.00 |
$ Annual Precipitation, $$ Annual Mean Temperature, **P-values < 0.01, *P-values ≤ 0.05
The canonical correlation analysis (Tables 5, 6, Figure S6) indicated that all dimensions were statistically significant (Table 5). Dimension 1 had a high canonical correlation (0.90), while dimension 2 had a much lower canonical correlation, but was still high (0.68). The standardized canonical coefficient for the morphological variables (Table 6) revealed that the corolla length influenced most strongly the first dimension (-0.75), while the lower limb length most strongly influenced the second dimension (-0.80). For the environmental and the geographic variables, the longitude influenced most strongly the first dimension (0.91), while the annual mean temperature influenced most strongly the second dimension (-0.77). The relationship between the morphological variables and the environmental and geographic variables is presented in Figure 4. This figure illustrates that latitude is highly correlated with the morphological variables followed by annual precipitation. The rest of the explanatory variables are not highly associated with the morphological variables. Finally, the canonical covariate plot (Figure S6) indicates that species do not form separate groups, but instead, two main clusters can be observed. The first cluster contains species occurring west of the Rocky Mountains (P. futicosus, P. glandulosus, and P. speciosus), and the second cluster contains species in the Rocky Mountains and the Great Plains (P. albidus and P. whippleanus).
Table 5 Tests of canonical dimensions
| Dimension | Corr. | F | df1 | df2 |
|---|---|---|---|---|
| 1** | 0.90 | 42.58 | 40 | 2099.43 |
| 2** | 0.68 | 18.46 | 28 | 1739.3 |
| 3** | 0.40 | 9 | 18 | 1366.62 |
| 4** | 0.28 | 6.94 | 10 | 968 |
| 5** | 0.23 | 6.85 | 4 | 485 |
**P-values < 0.01
Table 6 Standardized canonical coefficients
| Dimension | Dimension | ||||
|---|---|---|---|---|---|
| 1 | 2 | 1 | 2 | ||
| Morphological variables | Environmental and geographic variables | ||||
| CL | -0.75 | -0.22 | Annual Mean Temperature | 0.38 | -0.77 |
| CML | 0.11 | 0.19 | Annual Precipitation | -0.02 | 0.12 |
| CTW | -0.14 | 0.62 | Longitude | 0.91 | -0.05 |
| CTWA | 0.06 | -0.27 | Latitude | 0.18 | -0.13 |
| LLL | 0.10 | 0.70 | Altitude | 0.49 | 0.16 |
| LLW | 0.07 | -0.80 | |||
| ULL | -0.18 | -0.16 | |||
| ULW | -0.24 | -0.24 | |||

Discussion
Morphological differences between distant populations could be the result of limited gene flow, environmental plasticity, or local adaptation (Johnson 2006). In general, geographic variables had a strong influence on flower morphology (Tables 2, 4, 5, 6, Figure 4), but this relationship was not homogeneous across species. Two species presented a south-north increasing trend in flower size (P. albidus and P. whippleanus) while two species (P. glandulosus and P. speciosus) exhibited an east-west increasing trend in flower size. The longitude, latitude, and/or altitude estimates were statistically significant in all but one species (Table 2). Additionally, the PLS regression showed that longitude was the most important variable in four of the five studied species (Table 4), but the canonical correlation analysis pointed to latitude as being highly correlated with morphological variables (Figure 4). Finally, Mantel tests showed a strong and significant correlation between geographic distance and morphological distance.
More prominently, differences in flower morphology increase significantly with geographic distance in two of the studied species (P. albidus and P. glandulosus; Table 2). There is no varietal division in P. albidus, but the species has one of the widest distributions in the genus, ranging from Texas and Oklahoma to Montana (Nold 1999). All analyses conducted using the morphological variables revealed a strong relationship between flower morphology and geographic variables (Tables 2, 4, 5, 6). Particularly, Mantel tests showed that P. albidus had the largest contribution to the total geographic variation in flower morphology among all species. In addition, due to the large latitudinal range occupied by P. albidus, some populations experience as large as a one-month difference in flowering time. This means that geographic distance probably promoted isolation-by-distance (Wright 1943) and isolation-by-phenology (Hall & Willis 2006) in P. albidus.
On the other hand, P. glandulosus has two varieties with a disjunct distribution, with one variety occurring in a humid environment in Idaho, and another variety occurring in an arid environment in Washington (Strickler 1997). This distribution has probably facilitated the morphological divergence we observed, and it is also the basis for the current taxonomic division of the species into two varieties. Our analysis indicated that flowers in the northwest corresponding to P. glandulosus var. chelanensis are smaller than flowers in the southeast corresponding to P. glandulosus var. glandulosus. However, Mantel tests indicated that excluding P. glandulosus from the test had a minuscular effect on the Mantel statistic r. This means that factors other than geographic distance are contributing to the pattern of morphological divergence seen in this species.
Local adaptation, which results in limited gene flow, can lead to the same pattern of morphological divergence as we observed in P. albidus and P. glandulosus. However, we do not have enough data to test this hypothesis as it is beyond the scope of the study. Nevertheless, other studies have found a similar relationship between geographic distance and morphological difference as a result of local adaptation. For example, populations of Cattleya liliputana (Pabst) Van den Berg (Orchidaceae) exhibited greater genetic and morphological divergence with increasing geographic distance (Hall & Willis 2006). Likewise, Mimulus guttatus DC. (Phrymaceae) in Oregon showed distinct flowering time in the different environments the species occurs and a greenhouse experiment (Leles et al. 2015).
Environmental plasticity can also lead to morphological divergence between populations. But given that geographic variables were more important than environmental ones in all but one species (Table 4) and that there was no yearly effect on flower morphology (Table 3), that hypothesis is less likely. Other studies on Penstemon have shown that decreased precipitation can affect natural populations. For example, a decrease in population size (Heidel 2007, 2009) increased mortality rate (Mitchell & Shaw 1993) and limited nectar production (Lange et al. 2000). However, we were not able to establish a relationship between flower morphology and precipitation and temperature across years (Table 3).
Geographic distance limits gene flow between populations (Wright 1931, Slatkin 1993), and these genetic differentiations often drive morphological divergence (Johnson 2006). However, other mechanisms, such as pollinator-driven natural selection, can maintain populations morphologically similar despite great geographic distances (Anderson & Johnson 2008, Parachnowitsch & Kessler 2010). Even though the geographic variables are important drivers of morphological divergence, they explained less than 25 % of the variation in flower morphology in three of the species studied (P. fruticosus, P. speciosus, and P. whippleanus; Table 2).
Homogeneity in pollinator assemblage across populations is likely to maintain the flower morphology constant in space (Parachnowitsch & Kessler 2010). Similarly, other studies have shown that pollinators explained most of the variation in flower morphology in geographically separated populations of Zaluzianskya microsiphon (Anderson & Johnson 2008). Penstemon speciosus is thought to be Hymenoptera pollinated and Pseudomasaris wasps are thought to frequently visit P. speciosus (Cooper & Bequaert 1950, Wilson et al. 2004), but to our knowledge, there are no proper pollinator studies on this species. These previous, but preliminary, studies on P. specious pollinators, combined with our results, suggest that pollinator assemblage is similar across P. speciosus populations. But more research is needed in order to confirm this hypothesis. Additionally, little is known about the pollinators that visit P. fruticosus and P. whippleanus flowers. These species have flower morphology consistent with Hymenoptera pollination syndrome (Nold 1999), but to our knowledge, their true pollinators are still unknown.
Alternatively, reduced morphological differences between distant populations could be the result of 1) a high rate of gene flow mediated by long-distance flying pollinators or seed dispersers or 2) recent population divergence. Given that P. fruticosus, P. speciosus, and P. whippleanus have flowers indicative of Hymenoptera pollination syndrome and that seed dispersal in Penstemon is by gravity, animal-mediated gene flow is probably very limited in these species. On the other hand, Penstemon is a young genus with an estimated origin of 3.62 mya (Wolfe et al. 2021) and it constitutes a recent rapid adaptive radiation with more than 280 species described (Wolfe et al. 2021, Wolfe et al. 2006). Today’s distribution of Penstemon and its phylogenetic history is thought to be highly influenced by glaciation cycles in the Pleistocene; therefore, one cannot rule out the hypothesis of recent population divergence as an explanation for phenotypic similarities between distant populations before gathering more data. However, given the complex topography and environmental gradients of the areas inhabited by these species, recent divergence is also unlikely.
Differences in flower morphology between years were not statistically significant and were not explained by changes in temperature and precipitation (Table 3) despite record-high heat and low precipitation in some populations (NOAA www.noaa.gov). This could mean that differences in flower morphology between populations are not plastic but due to limited gene flow between populations. This statement is further supported by the results of the PLS analysis (Table 4), the regression analysis on the geographic variables (Table 2), and the canonical correlation analysis (Figure 4). Alternatively, our sample size could have been too small to establish a solid relationship between flower morphology and yearly variation in temperature and precipitation.
Penstemon is the largest genus of plants endemic to North America with great corolla and anther morphology variation. As a result, it has been the focus of many pollination studies. However, how abiotic factors affect the flower morphology of wild populations has been less explored. In this study, we found that geographically distant populations have divergent flower morphology and that factors such as temperature and precipitation have a small influence on flower morphology variation. In some species, geographic distance alone explained a large portion of the variation in flower morphology, which suggests that an isolation-by-distance pattern of gene flow might exist. In other species, flower morphology did not vary with distance, which suggests that other drivers, such as pollinators, are maintaining flowers homogeneously. Finally, this study shows that geographic variables are important drivers of flower morphology variation in Penstemon.
Supplementary material
Supplemental data for this article can be accessed here: https://doi.org/10.17129/botsci.3084

