


 text in
  English (pdf)
 Article in xml format
 Article references
 Send this article by e-mail
 Cited by SciELO
  Similars in
SciELO
Similars in
SciELO 
 Permalink
Introduction
Currently, avocados (Persea americana Mill.) are among the most economically important crops in Estado de México, supplying the local, national and export markets (Servicio de Información Agroalimentaria y Pesquera [SIAP], 2019). A wide variety of pests are present in this crop, including the stem weevil (Copturus aguacatae), which is native to Mexico.
This pest has only been found in avocado (Persea americana Mill.), among its different varieties (Bravo-Monzón & Espinosa-García, 2008). This pest is an obstruction for the export of the fruit to the United States, because it is classified as a pest of quarantine concern. For this reason, the management of this insect in Mexico is determined in the official Mexican standard NOM-066-FITO-2002, which specifies the phytosanitary management and transport of avocados according to the phytosanitary campaign for regulated avocado pests.
Adults of C. aguacatae are active during the day, moving on branches; however, their tiny size, color and rapid movement make them difficult to observe (GIIIA, 2013). The main symptoms of damage can be observed by the appearance of small white spots of powdery solidity on the branches (Bravo-Monzón & Espinosa-García, 2008). The larvae sweep the branch until they reach the pith, impeding the circulation of water and nutrients, which causes defoliation, flower and fruit abortion (Equihua & Estrada, 2008). Constant monitoring of pest regions is an important method for proper management.
To properly use the information from monitoring, it is necessary to establish a sampling system that generates reliable data to observe the spatial behavior of C. aguacatae and determine its distribution within the orchard. Malathion is currently used to control adults, in addition to pruning and burning of branches for immatures; however, the incidence of this insect persists in a significant degree. Therefore, the objective of this study was to determine the spatial behavior of adult populations of C. aguacatae using geostatistical procedures in avocado plantations.
Materials and methods
Study area and sapling
The study was carried out in 2021 (from January to December) in Temascaltepec and Tenancingo, main avocado producing municipalities in Estado de México. Four plots of 2 ha each were established in each municipality. Each plot was divided into 20 x 20 m quadrats, for a total of 50 quadrats per plot. Twenty-five quadrats were randomly sampled, and four trees were randomly selected from each quadrat for a total of 100 trees per plot, resulting in 400 trees per municipality. It was verified that the plantations were of Hass avocado variety (the trees were 7 years old) and that no agrochemicals were applied for insect control. In these plots, the presence of the pest was confirmed by observing small white dots of powdery consistency on the branches (García et al., 1967). Each tree surveyed was labeled and georeferenced with a Trimble Differential Global Positioning System (DGPS).
Sampling was carried out on the 1st and 15th of each month. For adult sampling, blue plastic bands 60 cm long by 20 cm wide (Gasca-Corona & Equihua-Martínez, 1999) were placed with Spider® plus adhesive. The bands were monitored to count the number of adults captured and then hung for subsequent sampling. A plastic band was installed in the three strata of the tree (low, medium and high) for each cardinal point, giving a total of 12 sticky traps per tree. A statistical exploration of the original data of the C. aguacatae populations was carried out for each sampling. The Kurtosis test and the coefficient of variability were used to corroborate the normality of the data.
Geostatistical analysis
The experimental semivariogram was derived from the population data of adults captured in each sampling using the program Variowin 2.2 (Software for spatial data analysis in 2D, USA) (Journel & Huijbregts, 1978; Isaaks & Srivastava, 1989). Once the experimental semivariogram was developed, and the nugget, plateau and range parameters were established, the adjustment was made to a theoretical semivariogram (spherical, Gaussian or exponential) (Englund & Sparks, 1988) with the same program. After fitting, the model was checked by cross validation through the statistical parameters: mean estimation errors, mean square error and dimensionless mean square error, and it was considered that the variance of the errors was lower than the sample variance (Samper & Carrera, 1996). The level of spatial dependence was also determined by dividing the nugget by the plateau, expressing the result as a percentage.
Map production
Interpolation of values was carried out by ordinary kriging to make unbiased estimates of points that were not sampled. The estimates were represented as a map for each sampling date using the Surfer 16 program (Surface Mapping System, Golden Software Inc., USA). In addition, the percentage of infested surface that the insect presented in each plot was determined, with the purpose of knowing how it behaves in the field and to help, together with the maps developed, to establish more efficient management strategies.
Results and discussion
C. aguacatae populations showed a clustered spatial distribution within the avocado plots in the two municipalities studied. The semivariograms were fitted to spherical and Gaussian models, with the spherical model prevailing in the highest proportion (Table 1).
Table 1. Parameters (plateau range and nugget effect) of the models fitted to the semivariograms of C. aguacatae in the municipalities of Temascaltepec and Tenancingo, Estado de México, associated with avocado.
| Month / Mes | Model / Modelo | Range (m) / Rango (m) |
Plateau / Meseta |
NuggetNugget / Pepita |
Spatial dependence / Nivel de dependencia espacial |
|---|---|---|---|---|---|
| Temascaltepec | |||||
| February 2 / Febrero 2 | Spherical / Esférico | 15.00 | 1.31 | 0 | High / Alto |
| March 1 / Marzo 1 | Gaussian / Gaussiano | 26.60 | 1.30 | 0 | High / Alto |
| May 1 / Mayo 1 | Spherical / Esférico | 31.90 | 1.28 | 0 | High / Alto |
| May 2 / Mayo 2 | Spherical / Esférico | 30.00 | 3.27 | 0 | High / Alto |
| June 1 / Junio 1 | Spherical / Esférico | 37.80 | 4.16 | 0 | High / Alto |
| June 2 / Junio 2 | Spherical / Esférico | 35.20 | 6.23 | 0 | High / Alto |
| July 1 / Julio 1 | Spherical / Esférico | 28.80 | 8.48 | 0 | High / Alto |
| July 2 / Julio 2 | Spherical / Esférico | 32.00 | 5.26 | 0 | High / Alto |
| August 1 / Agosto 1 | Gaussian / Gaussiano | 32.2 | 2.11 | 0 | High / Alto |
| August 2 / Agosto 2 | Gaussian / Gaussiano | 23.68 | 0.72 | 0 | High / Alto |
| Tenancingo | |||||
| January 2 / Enero 2 | Gaussian / Gaussiano | 17.28 | 1.24 | 0 | High / Alto |
| February 1 / Febrero 1 | Spherical / Esférico | 19.84 | 1.32 | 0 | High / Alto |
| February 2 / Febrero 2 | Exponential | 13.25 | 0.60 | 0 | High / Alto |
| May 1 / Mayo 1 | Spherical / Esférico | 32.00 | 1.89 | 0.04 | High / Alto |
| May 2 / Mayo 2 | Spherical / Esférico | 15.50 | 3.97 | 0 | High / Alto |
| June 1 / Junio 1 | Spherical / Esférico | 22.00 | 3.96 | 0 | High / Alto |
| June 2 / Junio 2 | Spherical / Esférico | 32.84 | 5.65 | 0 | High / Alto |
| July 1 / Julio 1 | Gaussian / Gaussiano | 32.00 | 9.27 | 0 | High / Alto |
| July 2 / Julio 2 | Spherical / Esférico | 30.10 | 4.13 | 0 | High / Alto |
| August 1 / Agosto 1 | Gaussian / Gaussiano | 24.83 | 1.91 | 0 | High / Alto |
| August 2 / Agosto 2 | Spherical / Esférico | 17.42 | 0.72 | 0 | High / Alto |
| September 1 / Septiembre 1 | Spherical / Esférico | 15.40 | 0.24 | 0.006 | High / Alto |
| September 2 / Septiembre 2 | Spherical / Esférico | 14.72 | 0.23 | 0 | High / Alto |
| October 1 / Octubre 1 | Gaussian / Gaussiano | 17.16 | 0.11 | 0 | High / Alto |
In all the models fitted in the municipality of Temascaltepec a nugget effect equal to zero was recorded, while in Tenancingo two dates had nugget effect values of 0.04 and 0.006 in the May 1 and September 1 samples, respectively. Having values of zero or very close to zeroI in the nugget effect indicates that the sampling scale used is correct and the sampling error is minimal (Oliver & Webster, 1998). Acosta-Guadarrama et al. (2017) and Maldonado-Zamora et al. (2016), when studying the spatial distribution of thrips in avocado, found values of zero in the fitted models. The range values in Temascaltepec ranged from 15 to 37.80 m, while in Tenancingo these values were from 13.25 to 32.84 m (Table 1). All sampling dates and fitted models had a high level of spatial dependence.
The average population density of C. aguacatae in Temascaltepec ranged from 0.87 in the first sampling in March to 4.42 individuals per tree in the July 1 sampling, while in Tenancingo the values ranged from 0.14 in October to 4.19 individuals per tree in July (Table 2). The highest population densities occurred in June and July. All models of the spatial distribution of the weevil in the studied plots were validated with the statistical parameters of cross-validation (Table 2).
Table 2. Sample mean and values of the cross-validation statistics of the semivariograms from sampling in the municipalities of Temascaltepec and Tenancingo.
| Month / Sampling ⁄ Mes / Muestreo |
Sample mean / Media muestral |
Sample variance / Varianza muestral |
MEE | Variance of errors / Varianza de los errores |
MSE / ECM |
RMSE / ECMA |
|---|---|---|---|---|---|---|
| Temascaltepec | ||||||
| February 2 / Febrero 2 | 1.06 | 1.30 | 0.12ns | 1.15 | 0.12 | 1.10 |
| March 1 / Marzo 1 | 0.87 | 1.36 | 0.10ns | 1.29 | 0.14 | 1.09 |
| May 1 / Mayo 1 | 1.46 | 1.30 | 0.09ns | 1.20 | 0.05 | 1.05 |
| May 2 / Mayo 2 | 2.02 | 2.09 | 0.07ns | 1.77 | 0.11 | 1.09 |
| June 1 / Junio 1 | 3.02 | 4.33 | 0.11ns | 3.28 | 0.07 | 1.10 |
| June 2 / Junio 2 | 3.64 | 6.48 | 0.14ns | 5.47 | 0.13 | 1.11 |
| July 1 / Julio 1 | 4.42 | 8.81 | 0.05ns | 7.02 | 0.09 | 1.14 |
| July 2 / Julio 2 | 3.43 | 5.43 | 0.09ns | 4.11 | 0.14 | 1.12 |
| August 1 / Agosto 1 | 1.95 | 2.10 | 0.11ns | 1.84 | 0.12 | 1.05 |
| August 2 / Agosto 2 | 1.10 | 0.73 | 0.13ns | 0.69 | 0.15 | 1.11 |
| Tenancingo | ||||||
| January 2 / Enero 2 | 0.89 | 1.22 | 0.11ns | 1.01 | 0.13 | 1.05 |
| February 1 / Febrero 1 | 1.10 | 1.42 | 0.10ns | 1.27 | 0.10 | 1.08 |
| February 2 / Febrero 2 | 0.56 | 0.60 | 0.08ns | 0.45 | 0.15 | 1.10 |
| May 1 / Mayo 1 | 2.04 | 1.93 | 0.14ns | 1.25 | 0.09 | 1.14 |
| May 2 / Mayo 2 | 2.49 | 4.02 | 0.05ns | 3.76 | 0.10 | 1.12 |
| June 1 / Junio 1 | 3.18 | 4.04 | 0.10ns | 3.28 | 0.07 | 1.13 |
| June 2 / Junio 2 | 3.41 | 5.97 | 0.13ns | 4.19 | 0.11 | 1.10 |
| July 1 / Julio 1 | 4.19 | 9.30 | 0.06ns | 7.05 | 0.14 | 1.08 |
| July 2 / Julio 2 | 3.13 | 4.17 | 0.12ns | 3.21 | 0.12 | 1.11 |
| August 1 / Agosto 1 | 2.0 | 1.91 | 0.10ns | 1.16 | 0.06 | 1.07 |
| August 2 / Agosto 2 | 0.85 | 0.70 | 0.14ns | 0.58 | 0.09 | 1.11 |
| September 1 / Septiembre 1 | 0.51 | 0.29 | 0.11ns | 0.21 | 0.11 | 1.09 |
| September 2 / Septiembre 2 | 0.35 | 0.22 | 0.13ns | 0.17 | 0.12 | 1.15 |
| October 1 / Octubre 1 | 0.14 | 0.12 | 0.11ns | 0.10 | 0.10 | 1.10 |
MEE = mean of the estimation errors; MSE = mean square error; RMSE = root mean square error; ns = not significant.
Maps designed by ordinary kriging interpolation scanned the weevil infested area and indicate that individuals of this pest are found in specific clusters. In Temascaltepec, the patches with the highest infestation were located in the western Universal Transverse Mercator (UTM) zone of the map, with a tendency towards the northern UTM and southern UTM part of the map (Figure 1). In Tenancingo, the cluster centers were distributed in different parts of the map, with a tendency towards the edges, either UTM north or UTM south, and in some samples, they were located in the UTM east part of the map (May 1), while on July 2 and September 1, the patches were located in the UTM west part of the map (Figure 2).
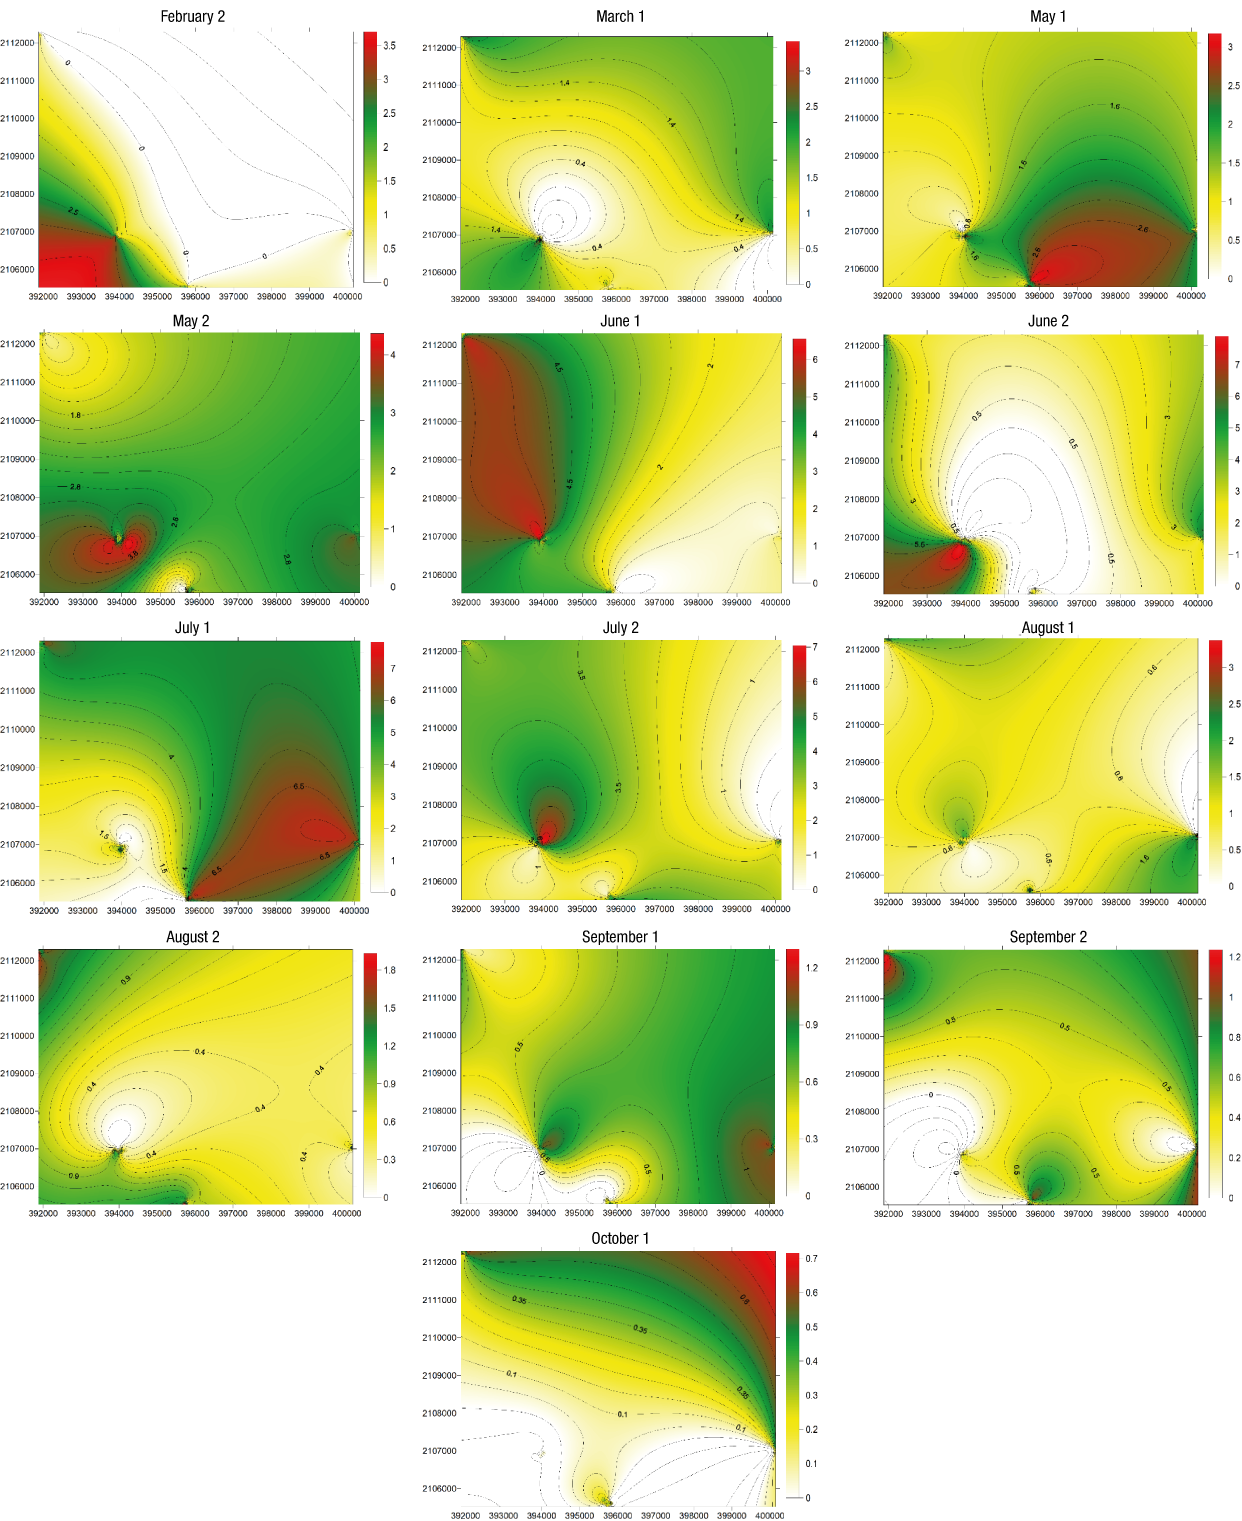
Figure 1. Population densities of C. aguacatae reported in the 2021 surveys in the municipality of Temascaltepec, Estado de México.
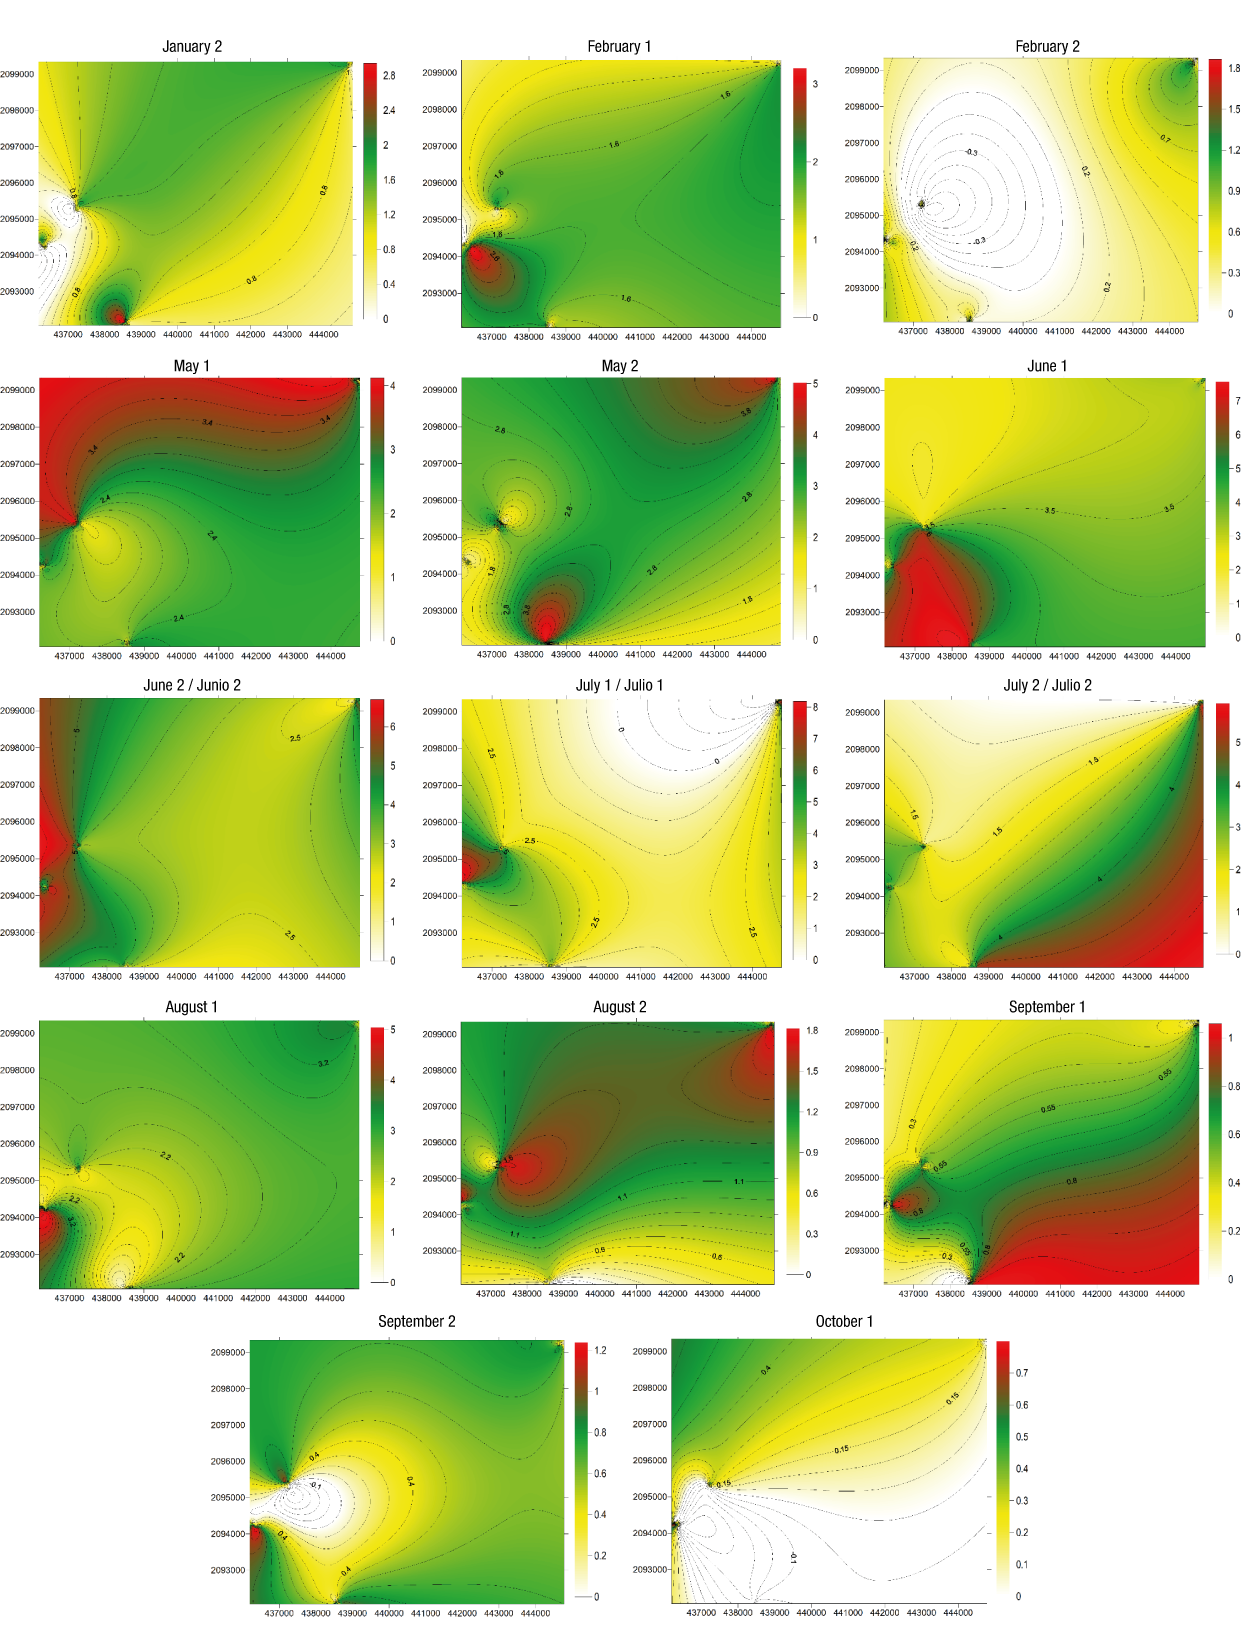
Figure 2. Population densities of C. aguacatae in the 2019 sampling in the municipality of Tenancingo, Estado de México.
In Temascaltepec, different degrees of infestation of C. aguacatae were found (Table 3); the highest percentage was recorded for the first sampling in May (May 1), with 99 % infestation. This means that the pest was distributed in 99 % of the plot area. On the other hand, the lowest percentage was recorded in the second sampling in February (February 2), with 40 % infestation. The other months also had a high infestation, with a range between 70 and 80 %. It is worth mentioning that in January, April, September, October, November and December there was no presence of adults in the plots, so no data are presented for those months. As for Tenancingo, an infestation of 100 % was observed in May and June, and the lowest value was recorded in February 2, with 67 % infestation. In January 1, March, April, October 2, November and December, the insect was not present.
Table 3. Percentage of infested surface area in 2021 in the municipalities of Temascaltepec and Tenancingo, Estado de México.
| Sampling / Muestreos | Infested (%) / Infestado (%) |
|---|---|
| Temascaltepec | |
| February 2 / Febrero 2 | 40 |
| March 1 / Marzo 1 | 82 |
| May 1 / Mayo 1 | 99 |
| May 2 / Mayo 2 | 98 |
| June 1 / Junio 1 | 81 |
| June 2 / Junio 2 | 75 |
| July 1 / Julio 1 | 88 |
| July 2 / Julio 2 | 86 |
| August 1 / Agosto 1 | 85 |
| August 2 / Agosto 2 | 90 |
| Tenancingo | |
| January 2 / Enero 2 | 90 |
| February 1 / Febrero 1 | 99 |
| February 2 / Febrero 2 | 67 |
| May 1 / Mayo 1 | 100 |
| May 2 / Mayo 2 | 100 |
| June 1 / Junio 1 | 100 |
| June 2 / Junio 2 | 100 |
| July 1 / Julio 1 | 79 |
| July 2 / Julio 2 | 92 |
| August 1 / Agosto 1 | 98 |
| August 2 / Agosto 2 | 96 |
| September 1 / Septiembre 1 | 95 |
| September 2 / Septiembre 2 | 89 |
| October 1 / Octubre 1 | 65 |
The highest presence of insects was in June and July, with greater adult emergence. This last stage of development coincides with the rainy season, when there are optimal conditions of humidity and temperature for breeding, allowing the beginning of a new biological cycle. The lower adult activity in certain months could be due to the increase of the insect in larval stage, which is found inside the branches of the tree. Gasca-Corona and Equihua-Martínez (1999) found that weevil adults appear at the beginning of June, with maximum activity between July and September.
It was possible to spatially model the location of the weevil in the study areas, with an cluster structure of this pest. Similar results were reported by de Souza-Silva (2016) on populations of Vatiga (Hemiptera), where they affirm this pest appears in clusters in the cassava crop. Maldonado-Zamora et al. (2017) report that thrips populations on avocado in Estado de México also form clusters in commercial orchards evaluated during 2015.
Geostatistics is a geostatistical tool that facilitates the creation of density maps of the spatial behavior of an organism (Rossi et al., 1992; Ribes et al., 1998). Unlike the estimates of spatial distribution provided by classical statistics, the geostatistical process helps to determine and analyze in greater detail information on the spatial dependence of the variable studied, since this method considers the distribution of the organisms according to their precise spatial location (Samper & Carrera, 1996). The incidence of the pest was represented with density maps elaborated by interpolation with kriging, showing the spatial location of the clustering centers in which the insect was distributed. The elaboration of maps has been used in other studies with different pests, such as thrips in the avocado crop in the state of Michoacán (Solares-Alonso et al., 2012).
The fit to the spherical model, in most of the semivariograms, indicates that within the study area there are areas where there is a higher incidence of the pest, locating the clustering centers with more individuals in specific places. This indicates that infestation starts from a main point and spreads to different areas. The distribution fitted to the Gaussian model reflects that the clustering centers are continuously present in the sampled area, suggesting the presence of different factors influencing the dispersion of the insect (Ramírez-Dávila & Porcayo-Camargo, 2008).
The behavior of the weevil (clusters) is very similar to that reported in other studies. Solano et al. (2008) studied the spatial behavior of the mite Brevipalpus phoenicis in Valencia orange plantations in Colombia. Sciarretta et al. (2008) described the cluster behavior of the lepidopteran Lobesia botrana in grape plots and described a fit to spherical models. Duarte et al. (2015) determined the spatial distribution of the moth Grapholita molesta (Busk) and observed a cluster distribution with fit to Gaussian, exponential and spherical models. In contrast, Carrillo et al. (2004) described that scarabaeid larvae on cultivated plants had no cluster distribution, which may be related to the larvae’s wide polyphagy and low mobility within the soil.
The behavior of the insect in clusters provides information that can be used to optimize sampling methods and carry out management tactics directed towards specific infestation zones. In this way, it is possible to reduce their populations by avoiding widespread applications, which will bring economic savings by using fewer inputs and less impact on the environment. This is consistent with that reported by Rong et al. (2006), who propose the management of Locusta migratoria manilensis Linnaeus in specific infestation areas. Milonas et al. (2016) recommend focusing control on specific areas where Helicoverpa armigera (Hübner) and Pectinophora gossypiella (Saunders) are present in cotton crop.
The distribution of C. aguacatae had a high level of spatial dependence in all fitted models. The high level of spatial dependence resulted from dividing the nugget effect by the plateau, which was lower than 25 %, for all semivariograms. This indicates that clusters found have a very stable behavior over time, which indicates that this insect forms ecological niches that, due to their stability, can be used as a factor to find better management strategies (Ramírez-Dávila et al., 2011). Acosta-Guadarrama et al. (2017), when studying the spatial distribution of thrips in avocado using geostatistics, they found that thrips form a clustered spatial structure with a high level of spatial dependence in all samples.
The maps showed the distribution of C. aguacatae within the study area. It was observed that the pest, in some months, was not distributed in 100% of the area studied, and that its population densities are variable. With the use of these maps, actions can be suggested to growers to carry out an integrated management of the pest, in which different control methods can be employed, such as the use of entomopathogenic fungi (such as Beauveria bassiana or Metarhizium anisopliae), which are commercially available products. Parasitoid insects such as Urosigalphus avocadoae Gibson (Hernández-Fuentes et al., 2009), a hymenopteran with high specificity for larvae, can also be used, which is useful in the management of these populations and can be released in areas where the pest is present. Cultural control can also be used through the use of sanitary pruning of damaged branches. As a last option, chemical control with malathion in applications to the foliage can be considered, which should be carried out in the months when there is greater adult activity.
The relevance of this study lies in the elaboration of maps of insect presence, making it possible to direct control measures (whether chemical, biological or cultural) to specific areas of pest infestation in the orchards under study. This is important, because with the elaboration and use of the maps made from interpolation with ordinary kriging it is possible to significantly reduce the application of chemical products, which leads to a significant reduction of economic costs and pollution of the environment (air, soil and water in the study area). By restructuring the way in which pests are managed, based on the results obtained in this study, it is possible that activities aimed at reducing C. aguacatae populations, carried out by trained technical personnel, will be more efficient and timely (Ramírez-Dávila et al., 2011).
Conclusions
The use of geostatistical methods in the management of C. aguacatae can be very useful for avocado growers because it allows them to know more precisely the spatial distribution of this insect. Once the usefulness of the methods used in this study is understood and implemented, management programs will provide growers with better results in reducing the populations of this insect, with all the positive consequences that such action would bring. The presence of this pest limits the adequate and efficient marketing of avocados from Estado de México.
It was determined that, despite the intensive campaign that has existed since 2014 to try to reduce C. aguacatae populations in the area studied, populations have decreased, but not in the expected proportion; therefore, this is relevant as it is of quarantine significance.

