


 text in
  English (pdf)
 Article in xml format
 Article references
 Send this article by e-mail
 Cited by SciELO
  Similars in
SciELO
Similars in
SciELO 
 Permalink
Introduction
Groundwater is the main water supply source, as between 94 and 98.7 % of the liquid fresh water on the planet is located underground (Lin et al., 2013). The rate of use of this type of water has accelerated (from 1990 to 2010 its consumption doubled), which has led to a drastic reduction in aquifer levels (Oswald-Spring & Sánchez-Cohen, 2011). In this regard, Famiglietti (2014) points out that approximately 30 to 40 % of the total water that supplies more than two billion people in the world, and more than half of the water used for irrigation, is of underground origin.
Groundwater is used for different purposes, including industrial, agricultural and domestic uses, which account for more than half of the annual water consumption for many countries (Shrestha, Bach, & Pandey, 2016) and worsen the situation of aquifers worldwide (Gorelick & Zheng, 2015; Mi, Xiao, Zhang, Yin, & Shen, 2016). As a result, the main aquifers are over-exploited; that is, their extraction level exceeds their recharge level. According to Custodio et al. (2016) and Konikow (2011), from 1900 to 2010 the world population increased by 340 % (1.3 % per year). During this same period, water extraction increased by 630 % (1.8 % per year), resulting in increased water scarcity.
Lack of data on the volume of available water creates uncertainty, as estimates vary considerably; even long-term estimates do not reflect reality. Given this situation and the nil reliability of the data, several studies have been carried out to more accurately demonstrate groundwater depletion, based on gravity measurements with GRACE satellites and satellite imagery (Custodio et al., 2016; Famiglietti, 2014; Forootan et al., 2014; Maliva, 2016; Sishodia, Shukla, Graham, Wani, & Garg, 2016; Van-Loon, Kumar, & Mishra, 2017). In this regard, Konikow (2015) highlights the need for local data from piezometric studies, as well as a comprehensive approach. Also, the hydraulic properties of aquifers, location of groundwater extraction points, recharge areas, and changes associated with aquifers should be considered (Custodio et al., 2016).
In Mexico, overexploitation of aquifers has been increasing since the 1970s, when 32 of the country's 653 aquifers were declared overexploited. In the 1980s, this figure increased to 80, while in 2001 it reached 97, in 2005 it hit 104, and by 2016 it was 105, from which almost 60 % of the groundwater was extracted (Comisión Nacional del Agua [CONAGUA], 2006, 2013, 2016).
The recovery of aquifers largely depends on the recharge derived from the amount of rain that infiltrates into the subsoil, but this only occurs when the soil water content exceeds its field capacity and the surplus becomes recharge (Gong, Pan, & Xu, 2012). Fishman, Siegfried, Raj, Modi, and Lall (2011) argue that water stress can occur in the short term due to a lack of rainfall, which increases the volume of extractions.
According to CONAGUA (2016), 38.9 % of the total volume of water granted under concession for consumptive uses is extracted from aquifers, that is, 33 311 hm³·year-1. Of the total water allocated for agricultural use, 35.9 % is of underground origin, which supplies a third of the total irrigation area. On the other hand, 58.6 % of the total volume of water for public supply and 51.4 % of the water for industry are also of underground origin, and both had a significant increase from 2006 to 2015.
It is important to consider that the above data refer to the volume of water granted under concession; however, there is a lack of data on the volume of water that is actually extracted and the number of wells from which this water is extracted. Furthermore, according to Elsheikh, Zeielabdein, and Babikir (2009), Famiglietti (2014) and Kværner and Snilsberg (2013), this situation is not exclusive to Mexico. Also, it should be taken into account that 58 % of the Mexican territory has arid, semi-arid and hyper-arid land (desert) ecosystems, which receive less than the national rainfall average (Oswald-Spring & Sánchez-Cohen, 2011), a condition that puts at risk the recharge of aquifers and, therefore, their recovery.
Several studies have pointed out the severity of aquifer depletion in Mexico and have addressed the depletion of groundwater from different disciplines, mainly in areas located in the center-north and north of the country. A notable case is found in San Luis Potosí, where 92 % of the total water used comes from underground sources and only 8 % is of surface origin (Contreras-Servín, & Galindo-Mendoza, 2008), while in Mexico City and its metropolitan area, 70 % of the water consumed is of underground origin (Durazo & Farvolden, 1989), slightly less than the percentage extracted in Aguascalientes (72 %) (Peñuela-Arévalo & Carrillo-Rivera, 2013).
The study area corresponds to the Tecamachalco Valley aquifer (TVA) in Puebla, Mexico, which was declared partially overexploited in the 1950s, and in 1980, 95 % of its territory was declared closed (CONAGUA, 2003). Nevertheless, the aquifer continues to be the main source of supply, and 84 % of the total volume granted under concession is for agricultural use. Therefore, the objective was to analyze the temporal variation of the TVA’s static levels during the period from 1997 to 2016 in order to determine the level of depletion from groundwater uses.
Materials and methods
Study area
The TVA has an area of 3 600 km2 and is located in the central zone of the state of Puebla, Mexico. Geographically, it is limited by the parallels 18° 32” 20.1” and 19° 13’ 45.8” and the meridians 97° 14’ 31.7” and 98° 3’ 6.2” (Figure 1). The TVA Management Plan states that 27 municipalities make up the aquifer, even though its geographical boundaries include other municipalities. Currently, this aquifer is overexploited, with a water deficit of 63.3625 Mm3·year-1 (Secretaría del Medio Ambiente y Recursos Naturales [SEMARNAT], 2018) and with an area population of 728 878 inhabitants (Instituto Nacional de Estadística y Geografía [INEGI], 2010) mainly engaged in agriculture.
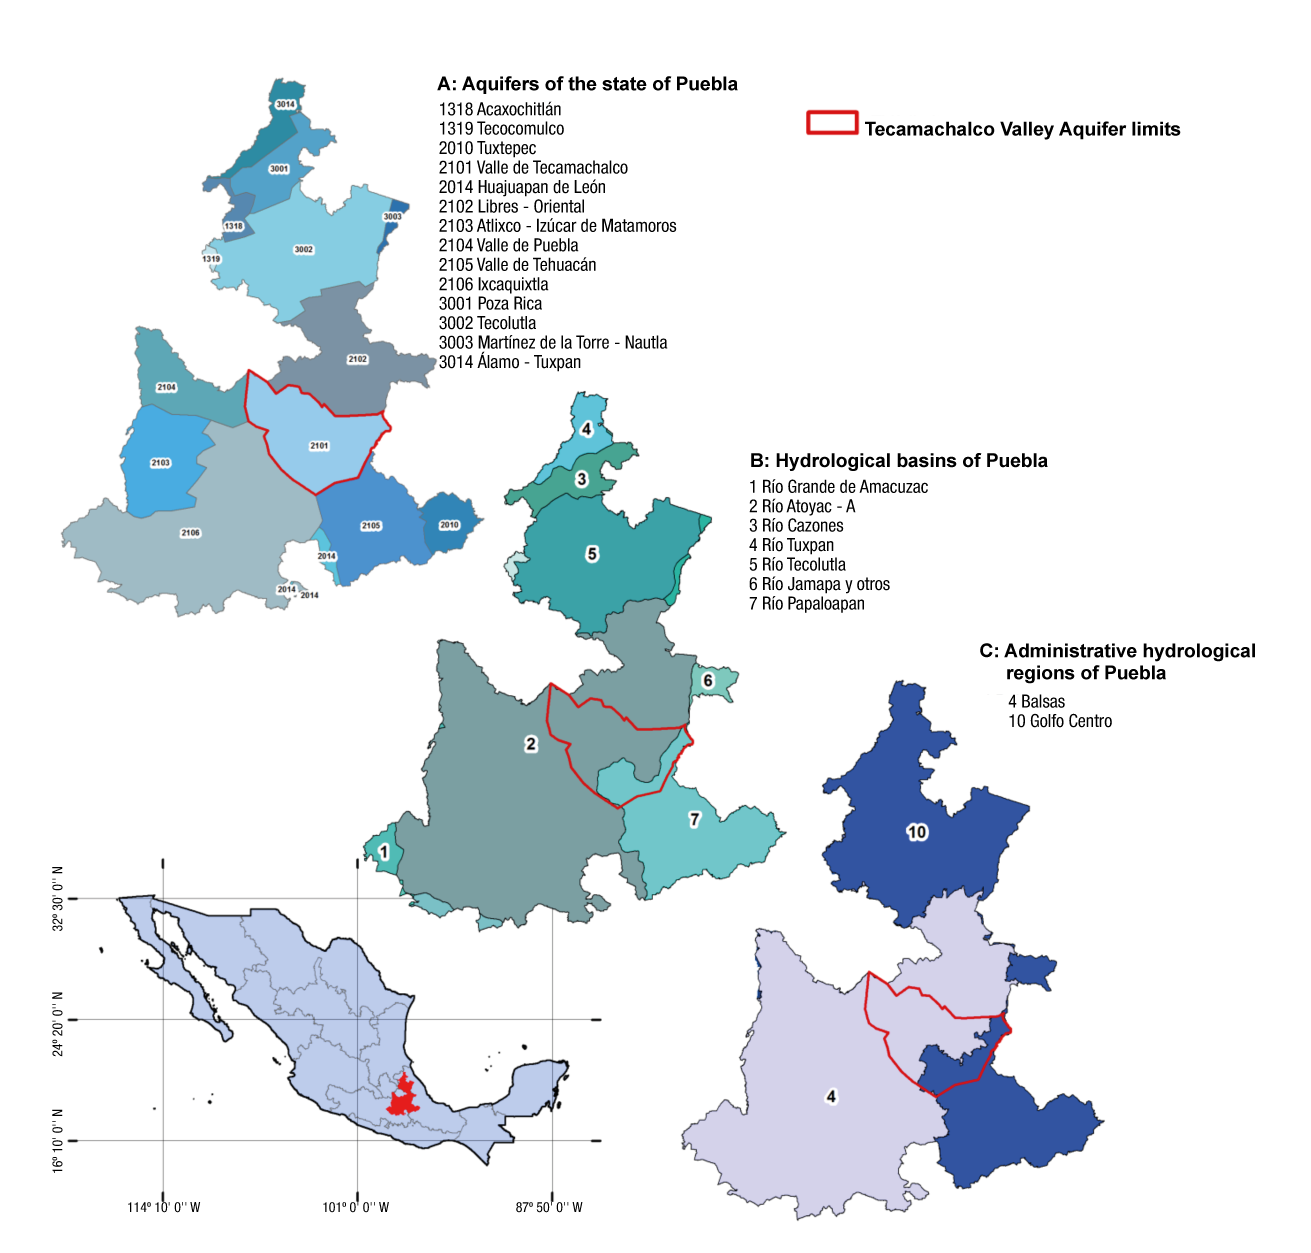
Figure 1 Location of the Tecamachalco Valley aquifer according to its hydrological condition. Source: Comisión Nacional para el Conocimiento y Uso de la Biodiversidad (2012) and GeoComunes (2015), with some modifications.
The TVA encompasses the IV Balsas and X Golfo Centro administrative hydrological regions. The former covers about 90 % of the aquifer and contains the Esperanza, Palmar de Bravo and Tepeaca-Tecamachalco valleys. The latter includes the municipalities of Esperanza, Cañada Morelos, Tlacotepec de Benito Juárez and Yehualtepec (Secretaría de Agricultura y Recursos Hidráulicos [SARH], 1989).
Because of its surface waters, the TVA belongs to Hydrological Region No. 28 (Papaloapan River Basin and Salado River sub-basin), which extends from the Esperanza Valley and the south-western portion of the Tepeaca-Tecamachalco Valley, and to the second Unit of the Valsequillo 030 Irrigation District, until Tehuacán. The first unit of this Irrigation District, like the Palmar de Bravo Valley, is located within the Balsas River Hydrological Region No. 18 (CONAGUA, 2015).
Physiographically, the aquifer area is located at the eastern end of the Trans-Mexican Volcanic Belt and part of the Sierra Madre del Sur. Three main geomorphological units have been identified in the study region: intermountain plains (valleys), mountain ranges and volcanic cones, with elevations ranging from 2 000 m above sea level in the lower parts of Tepeaca-Tecamachalco, to 2 400 m above sea level towards the volcanoes. Folds characterize the limestone rocks, which in turn constitute an elongated mountain range with a northwest-southeast orientation, in the Sierra de Soltepec and Cuesta Blanca (both located in the northern portion of the study area), and divided by the Esperanza and Palmar de Bravo valleys. The Sierra el Monumento delimits the Palmar de Bravo and Tepeaca-Tecamachalco valleys (Comisión Nacional del Agua [CNA], 1999).
The climate in the municipalities of Palmar de Bravo, Esperanza and Cañada Morelos is type BS1Kw(w), semi-dry climate, semi-dry temperate subtype with temperatures between 12 and 18 °C, and average rainfall between 400 and 600 mm·year-1. Towards the center of the aquifer, in Tecamachalco and Quecholac, the climate is type C(wo)(w), temperate sub-humid (groups the less humid subtypes) with average annual temperature from 16 to 18 °C and rainfall of approximately 600 mm·year-1. In the municipalities of Tepeaca, Acajete and Acatzingo, the climate types are C(w1)(w) and C(w2)(w), temperate sub-humid (the former groups the medium-humidity subtypes, and the latter groups the more humid subtypes), with average rainfall of between 600 and 700 mm·year-1. The Pico de Orizaba and La Malinche volcano areas are the coldest, with average temperatures of 12 to 14 °C and average rainfall of 602 to 850 mm·year-1 (INEGI, 2009a, 2009b, 2009c).
Data
Information on the volume of water granted under concession from 1 445 TVA groundwater wells, which are in the Public Registry of Water Rights (REPDA), was used. The data analyzed pertain to the period from 1997 to 2016, were generated by CONAGUA and include the location and different consumptive uses of water such as: agricultural, public-urban, industrial, services, multiple uses, livestock and domestic.
The Tecamachalco Technical Groundwater Committee (COTAS in Spanish) has been monitoring a network of wells since 1997, which has varied from 60 to 71 wells, since sometimes it is not possible to survey all of them or, in some cases, they have been replaced because they no longer operate. These observation wells are used for urban, agricultural, and livestock purposes, and are inspected from September to December.
To define the TVA sub-basins, an Aster 2011 version 2 elevation model was generated, at a spatial resolution of 15 m2, with a 60 km2 intake located in column 2 482 and row 1 246.
The piezometric data from the 2016 groundwater extraction wells were obtained in the field in order to extend the monitoring network to the sub-basins where no data are available. To this end, 154 wells were surveyed, 75 % of which are for agricultural use. Due to the deteriorating conditions of the pumping equipment and the lack of conditioning to carry out the probing, data on static levels were only recorded for 89 wells.
Data analysis and processing
Data handling and processing were done in the XLSTAT statistical program and the Geographic Information System (GIS). The sub-basins were delimited with the GIS spatial analysis Hydrology tool. Based on a digital elevation model (DEM) and contour lines, a drainage point of the basin was determined, for which the perimeter was defined according to the water dividing line, taking the contour or relief lines as a reference. In addition, the basins are delimited by the watershed (an imaginary line that joins the points of maximum relative height value between two adjacent slopes, but of opposite exposure), from the highest part of the basin to its point of emission in the lowest hypsometric zone. The lines that delimit the sub-basins are known as secondary watersheds.
The Mann-Kendall (MK) statistical test (Sang, Wang, & Liu, 2014; Sishodia et al., 2016) was used to test the importance of groundwater trends and hydrological processes. This non-parametric test has been used when data are not normally distributed, but requires the data to be independent (Milan & Trajkovic, 2013). It is also used when there are missing or uncorrelated data (Hamed, 2008; Hasanuzzaman, Song, Han, Zhang, & Hussain, 2017). The purpose of this test is to statistically assess whether there is an upward or downward trend, monotonous or monotonic, of the variable of interest, meaning that the variable increases or decreases constantly over time. In addition, it is useful to identify seasons where changes are significant or of great magnitude, and to quantify these findings (Kisi & Ay, 2014; Zhang, Odeh, & Han, 2009).
This method compares the last measured values with the previous measured value by calculating the MK (S) statistic. In this way, n(n-1)/2 possible pairs of data are compared for n observations (Equation 1). The significance level for the trend of this test is 0.05.
Where S indicates the increasing trend (positive values) or decreasing trend (negative values) over time, y j and y i are the annual values of the data in the time series and the values of sgn(y j -y i ) indicate the following:
The MK test was used with the Thiel-Sen slope (Yue, Pilon, & Cavadias, 2002), commonly referred to as Sen’s slope, and serves to measure the magnitude of the trend. This slope is the median of the slopes obtained from all pairs of data compared and is calculated from the following equation:
where j > i, j = 1 and i = 1… n − 1, n is the total number of observations.
On the other hand, to analyze the behavior of the piezometric levels derived from the TVA groundwater well sounding program and the Tecamachalco COTAS monitoring network, the Kriging geostatistical spatial interpolation method (Equation 3), where the spatial variation of Z values can be deduced from the surrounding values according to the homogeneous functions, was used. The distance or direction between the sampling points reflects a spatial correlation that can be used to explain the variation in the area; to do so, a mathematical function is fitted to a specific number of points, or to all the points, within a given radius, thereby obtaining the output value for each location (Coaguila-Núñez, Tangerino-Hernández, Freitas-da Silva, & Gonçalves-Feitosa, 2013). This method is very useful in surface and underground hydrology studies, as well as soil and geological studies, even though it does not allow the treatment of topographical discontinuities that involve abrupt changes and slope breaks.
Where Z(S i ) is the value measured at location i, λ i is an unknown weighting for the value measured at location i, S 0 is the location of the prediction and N is the amount of measured values.
Finally, a schematic simplification of the aquifer representing its real conditions was made to show the dynamics of the groundwater level from 1997 to 2016.
Results
Background on TVA groundwater levels
The TVA has been declared partially closed since the 1950s; however, there are no historical data that clearly show the dynamics of groundwater depletion or availability in this aquifer (CONAGUA-COTAS, 2002). According to the first geohydrological studies carried out in the 1970s by groundwater flow follows a path from northeast to southeast, and its main recharge areas come from Malinche, the Sierra de Cuesta Blanca, the Sierra de Soltepec and the Sierra del Monumento. In 1973, in the Palmar de Bravo and Esperanza region, 144 groundwater use points were analyzed, with a total extraction of 30.6 hm3·year-1, of which 22.6 hm3·year-1 of 108 points corresponded to Palmar de Bravo, and 8 hm3·year-1 of 36 points were estimated in Esperanza.
In 1974, 501 extraction points (wells, waterwheels and filtering galleries) were recorded in the Palmar de Bravo and Esperanza valleys, and static level depths of between 5 and 90 m were observed in the plains, and of 140 m in the most rugged topographic areas. At that time, 52 hm3·year-1were extracted in the Palmar de Bravo Valley: 17 hm3·year-1 from the filtering galleries and 35 hm3·year-1 from the aquifer. In the Esperanza Valley, an extraction of 11 hm3·year-1was estimated: 2 hm3·year-1 came from filtering galleries and 9 hm3·year-1 from the aquifer (CONAGUA, 2002). The depth of the static groundwater level in 1979, from Cuacnopalan to Acatzingo de Hidalgo, varied from 10 to 30 m, except for Quecholac, where these depths ranged from 40 to 50 m (CONAGUA, 2002); to the west of Cañada Morelos, this level was between 60 and 80 m.
At the end of the 1980s, the static level depth in the Esperanza Valley was between 20 and 50 m, to 10 m north of San Antonio Soledad and to 80 m in the northern zone of the Esperanza municipality. On the same date, the depth of static groundwater levels in the area between Cuacnopalan and Acatzingo increased to 25 and 50 m, with a local maximum of 70 m at the foot of the Sierra Soltepec and towards the town of General Felipe Ángeles, while in Quecholac the depths were 30 m. In the Tepeaca-Tecamachalco area, and up to the area surrounding Tlacotepec de Benito Juárez, the groundwater depth varied between 10 and 50 m, with the exception of the area located to the north of Santiago Acatlán and towards the slopes of the La Malinche volcano, where depths greater than 70 m were found, with a maximum of 130 m in San Agustín Tlaxco, a situation caused by the topography of the terrain. South of Tepanco de López, in the third irrigation unit, depths were 5 to 30 m, which suggested that this part of the aquifer was close to balance or with low overexploitation.
The estimated extraction of groundwater from the TVA was 228 hm3·year-1 in 1988, 283 hm3·year-1 in 1999 and 343 hm3·year-1 in 2002. The average depth of static water levels in 109 wells, reported in 1996, was 33.7 m, and the dynamic level was 48.9 m. According to the 114 pilot wells of the same year, the average static level was 36.4 m and the average instantaneous flow rate was 31 L·s-2, resulting in a specific capacity of 2 L·s-1·m-1 (CONAGUA, 2003). In the same year, Amozoc-Acatzingo, Tepeaca-Hueyotlipan and Atoyatempan-Primera Unidad had an average static level of 47.1 m, based on data from 163 wells, and an average dynamic level of 58 m, pertaining to 249 wells.
For the period between 1974 and 1988, Tecamachalco had a static level drop of -20 m (CONAGUA, 2003), similar to that of the Palmar de Bravo Valley with drops of -10 to -20 m (approximately -1.2 m·year-1). In Tepeaca there were drops of -10 to -30 m, and in Acatzingo de Hidalgo there was a 2 m recovery of the static level. In the 1990s, the TVA groundwater level was monitored through a network of wells, in which the Tecamachalco COTAS conducted an annual survey. The data obtained are analyzed in detail below.
TVA groundwater level dynamics from 1997 to 2016
CONAGUA’s REPDA was created in 1992 from the National Water Act, and in 1994 the TVA sounding program began. In that year, 14 wells were registered with a volume of water granted under concession of 1 592 288 m3. For 2016, the number of wells increased to 1 445, which were mainly for public and agricultural use; this increase was reflected in the volume of water granted under concession, which reached 212 490 006.5 m3; that is, there was a 26 % annual increase (Figure 2). Additionally, Figure 2 shows the consumptive uses of water from the wells; these wells correspond only to those registered in the REPDA, not to the total number of wells that are currently in the area without registration, in process, or clandestinely operated.
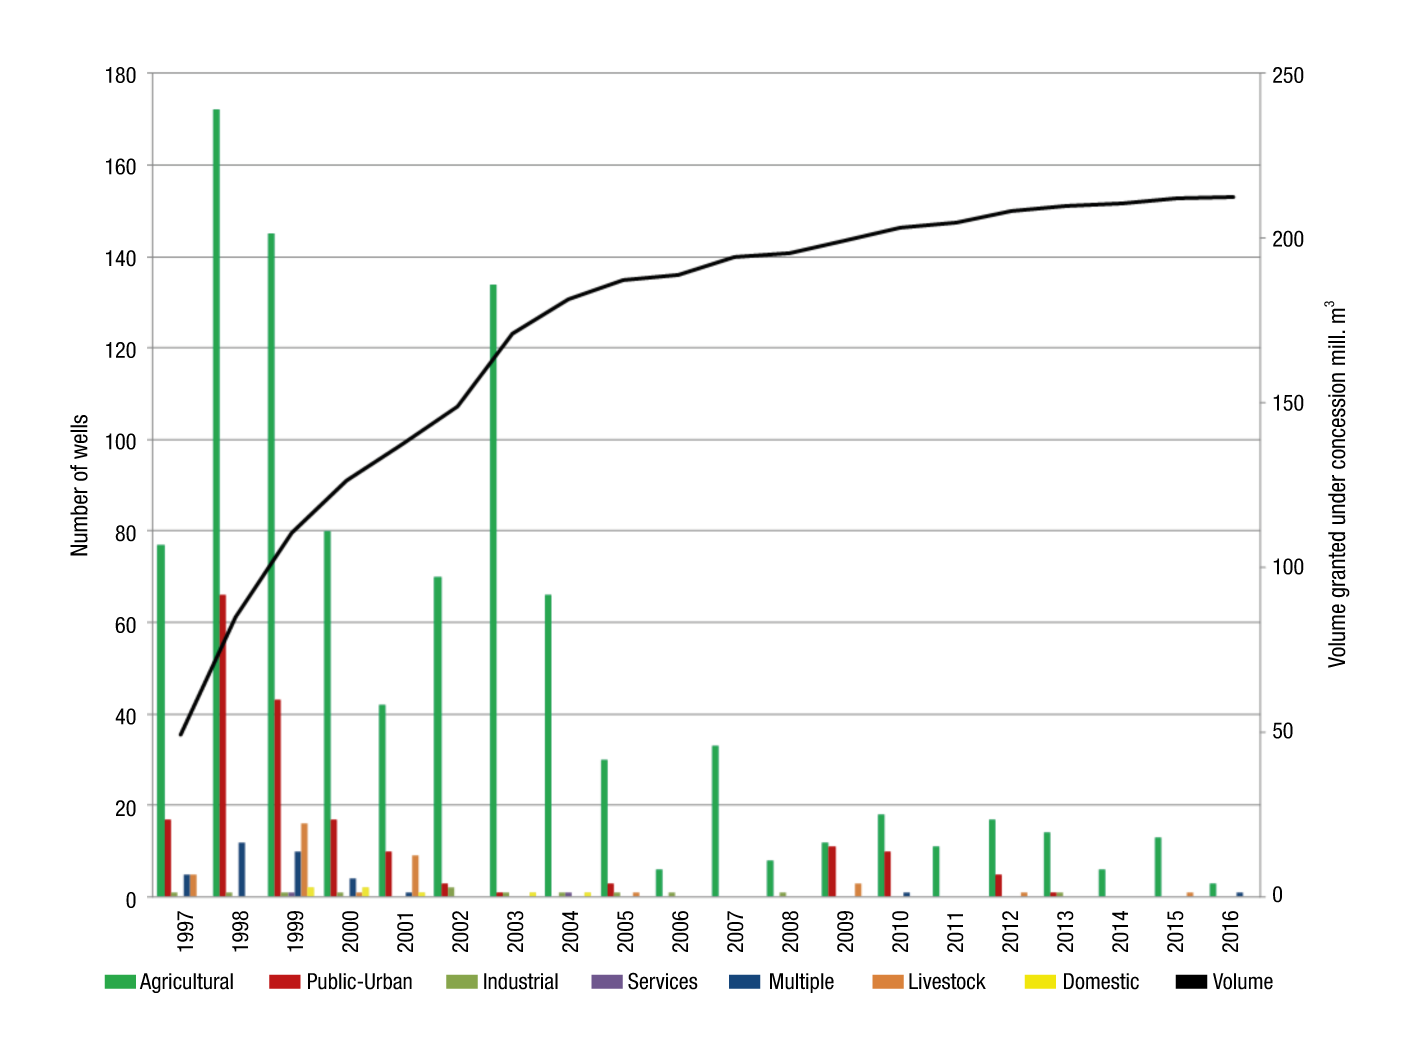
Figure 2 Dynamics of the volume of groundwater in the Tecamachalco Valley aquifer under concession, and number of wells from 1997 to 2016. Data obtained from the Public Registry of Water Rights and the National Water Commission in that period.
The spatial distribution of the monitoring network has enabled showing changes or trends in groundwater level fluctuations in the study area, which was divided into sub-basins to facilitate analysis. As can be seen in Figure 3, more monitoring wells were found in the Tepeaca sub-basin.
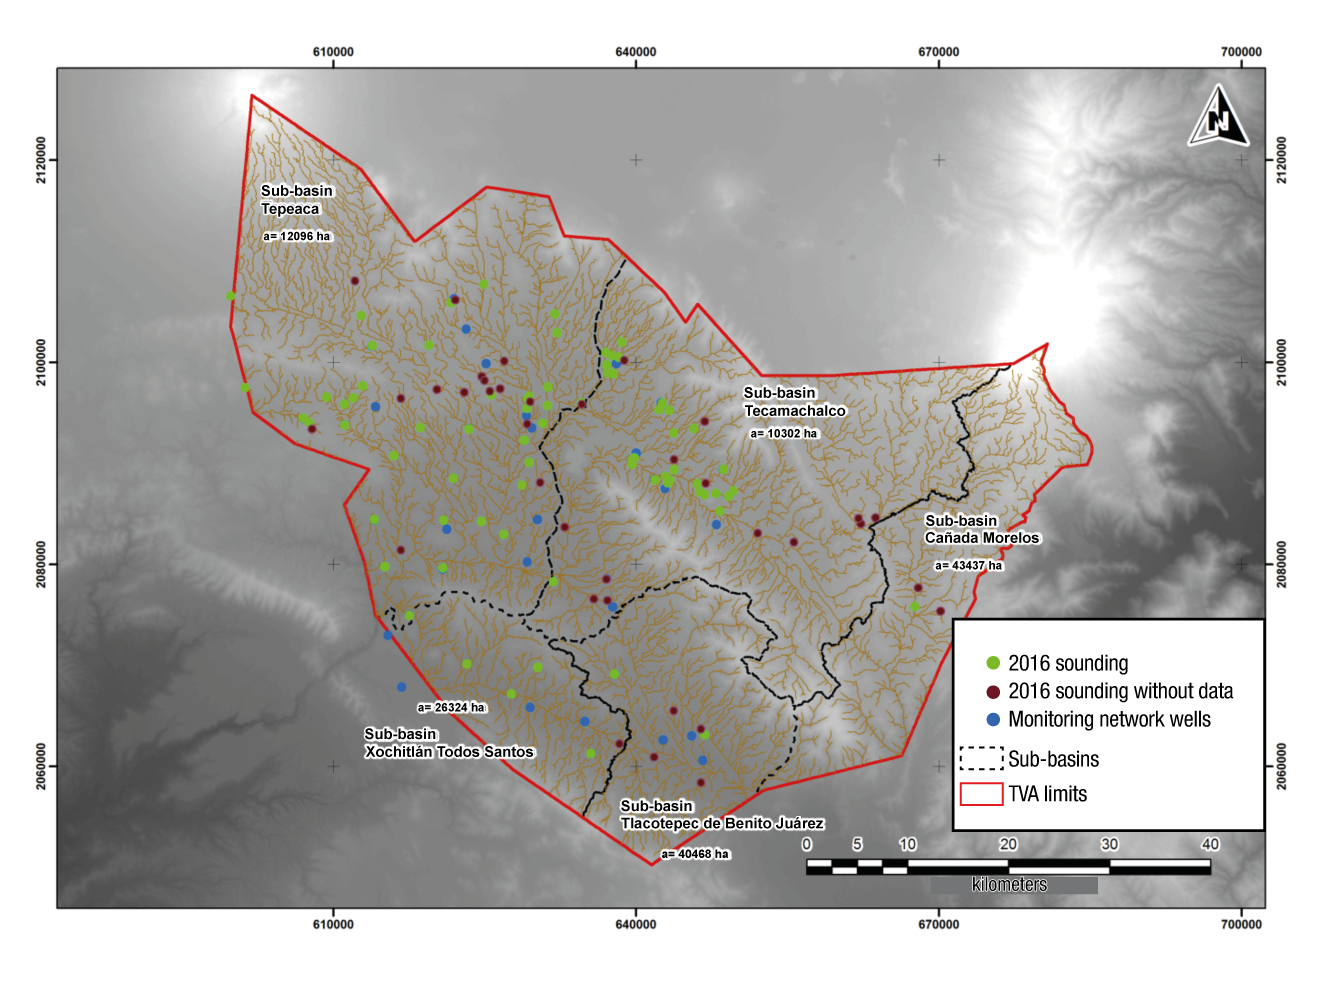
Figure 3 Spatial distribution of groundwater wells by sub-basin: includes the monitoring network and the field sounding conducted in 2016.
From 1997 to 2016, the depth of the static levels of the monitoring network increased, which implied a greater depletion of the wells, with an annual growth rate of 1.45 %. The sub-basin with the smallest increase in static level depth was Tlacotepec (with 0.7 %), followed by Tepeaca (with 1.3 %), Tecamachalco and Xochitlán (both with a 1.9 % rate) (Figure 4). The average depletion in that period was 14 m for the set of wells.
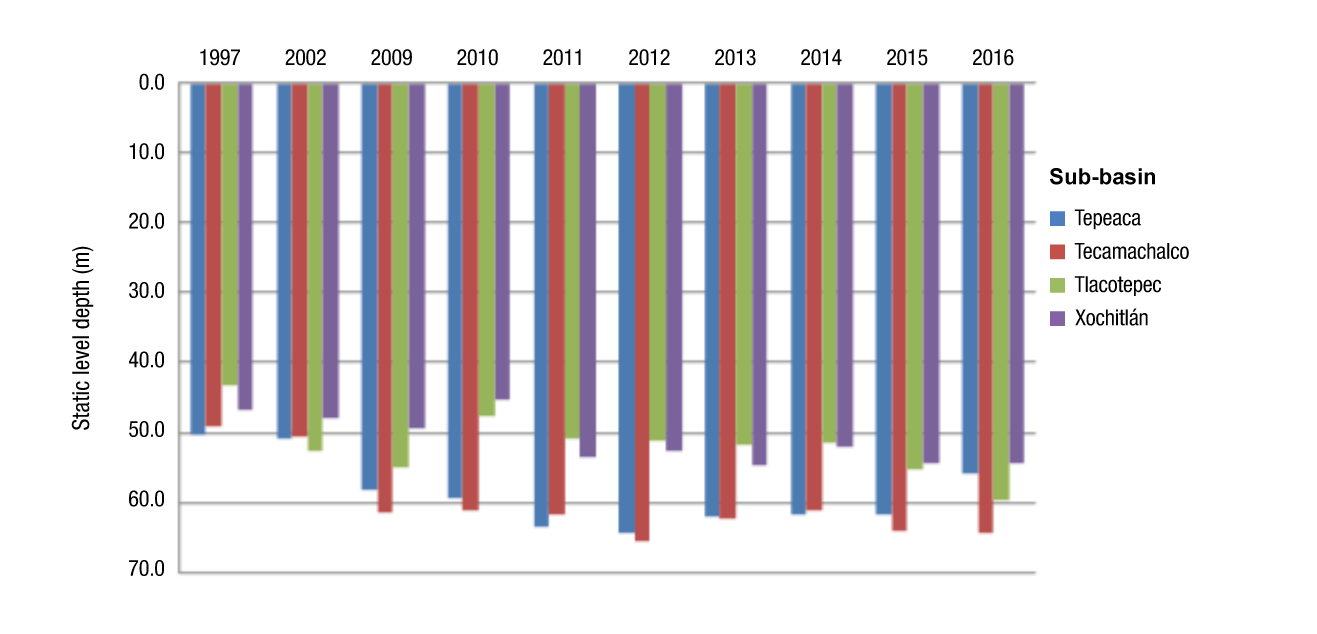
Figure 4 Average annual behavior of static groundwater levels in the Tecamachalco Valley aquifer, from 1997 to 2016. Data obtained from the monitoring network of the Tecamachalco Groundwater Technical Committee.
The results of applying the MK test to the 71 monitored wells showed that 86 % have a decrease in the static water level, indicating an increasing groundwater depth, while 14 % of the wells have an upward trend; that is, a lower depth of the groundwater level, with a recovery trend (Tables 1 and 2).
Table 1 Results of the Mann-Kendall test on the annual chronological series of static groundwater levels in the Tecamachalco Valley aquifer.
| Sub-basin | Kendall Tau | Mann-Kendall (S) | Variance (S) | p-value (unilateral) | Alpha | Sen’s slope |
|---|---|---|---|---|---|---|
| Tepeaca | 0.5 | 18 | 92 | 1.0 | 0.1 | 1.3 |
| Tecamachalco | 0.6 | 22 | 92 | 1.0 | 0.1 | 1.3 |
| Tlacotepec | 0.4 | 14 | 92 | 0.9 | 0.1 | 0.8 |
| Xochitlan | 0.6 | 20 | 92 | 1.0 | 0.1 | 1.1 |
Table 2 Well behavior by sub-basin according to the Mann-Kendall test.
| Sub-basin | No. of wells | Depletion | Percentage | Recovery | Percentage |
|---|---|---|---|---|---|
| Tepeaca | 37 | 32 | 45.1 | 5 | 7.0 |
| Tecamachalco | 18 | 16 | 22.5 | 2 | 2.8 |
| Tlacotepec | 8 | 7 | 9.9 | 1 | 1.4 |
| Xochitlan | 8 | 6 | 8.5 | 2 | 2.8 |
In the digital elevation model (Figure 5), one can see the static level depths, which continue to fall due to the continuous extraction of groundwater from the wells. From 1997 to 2010, there was an average drop of 10 m, mainly in the Tepeaca sub-basin. In this period, the public-urban use wells were the ones that recorded the greatest water table depths. The deepest wells used for agricultural purposes ranged between 80 and 90 m, and the shallowest reached 20 m. On the other hand, in the period from 2010 to 2015 there was a slight recovery in the static level of approximately 5 m (Figure 5).
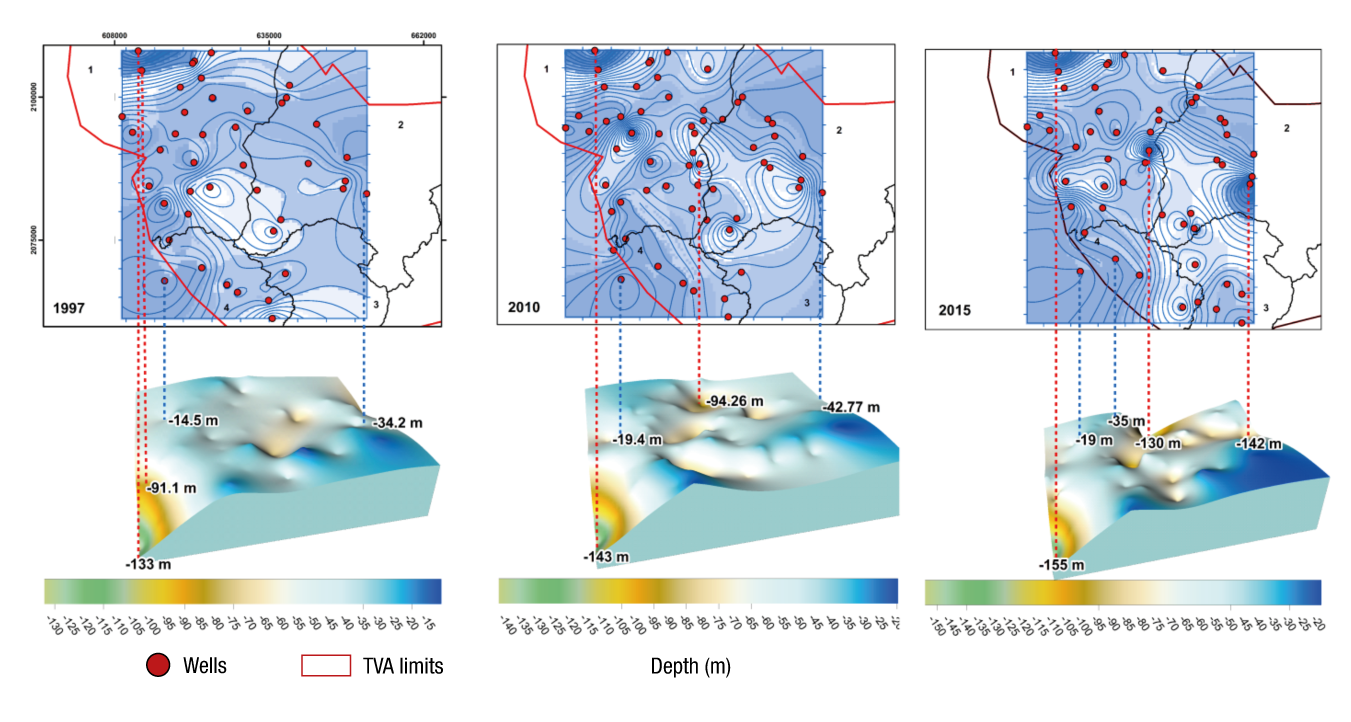
Figure 5 Digital elevation maps interpolated by the Kriging method of the static groundwater levels in the Tecamachalco Valley aquifer from 1997 to 2015.
Figure 6 represents the digital elevation model for 2016 where one can see the area with the deepest static level, which is located in the Tecamachalco sub-basin with wells over 140 m deep in the municipalities of Palmar de Bravo and Huixcolotla. Also shown are shallow wells (13 m) in the Cañada Morelos sub-basin, where the wells are also located near what were previously filtering galleries.
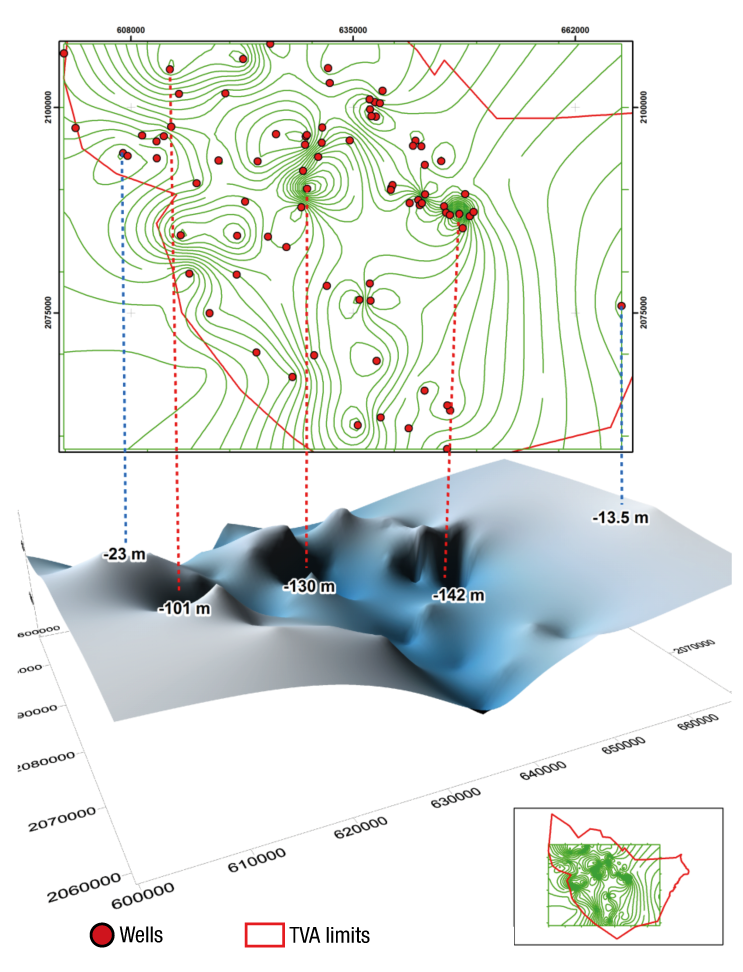
Figure 6 Digital elevation map interpolated by the Kriging method of static groundwater levels in the Tecamachalco Valley aquifer in 2016.
Villarreal (2017) states that if the current use trend of TVA groundwater continues, a deficit of more than 300 % could be reached in the next 50 years, this considering that the availability of the resource does not increase, but tends to decrease in the face of increasing demand (Figure 7).
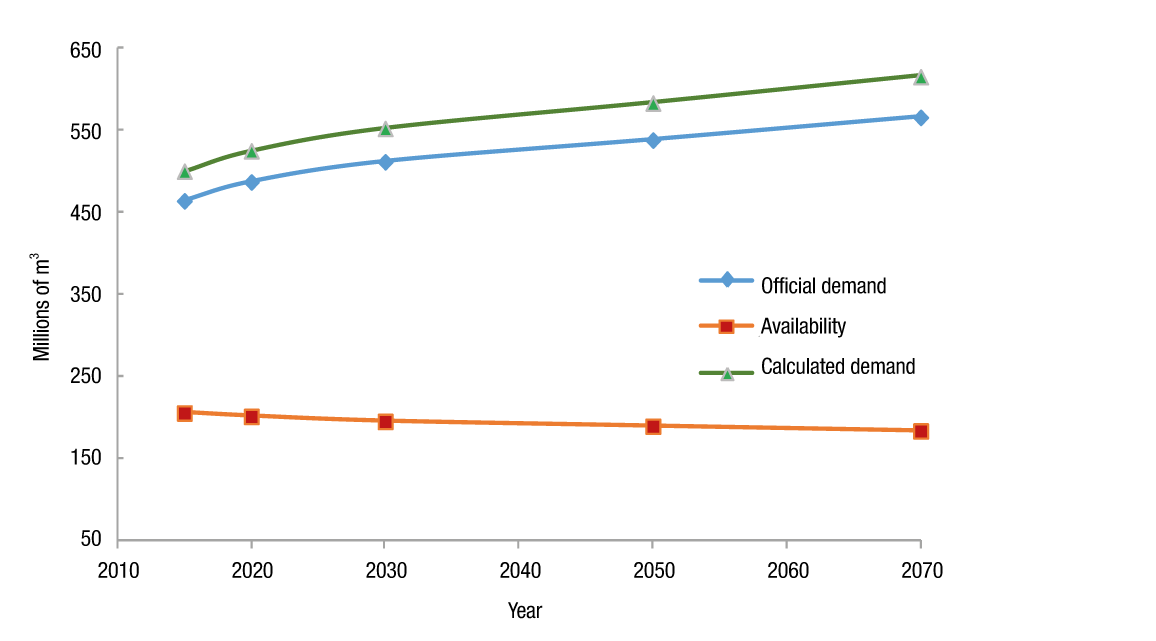
Figure 7 Projection of the Tecamachalco Valley aquifer’s groundwater availability and demand in the 2015-2070 period. Source: Villarreal (2017), with some modifications.
Discussion
According to the region's inhabitants, a few decades ago the water was a few meters deep, a situation that has changed drastically, as there are now wells that have had to be relocated due to their depletion. Similarly, they mention that rainy periods occurred more regularly in the past and that it rained more. Martínez-Austria and Patiño-Gómez (2012) point out that in the TVA various factors such as agricultural production, population growth, industrial activity, rainfall and temperature condition the availability of surface and groundwater.
As regards the dynamics of the piezometric levels of the monitoring wells, the network does not cover the entire aquifer, some of the missing data being from the Cañada Morelos sub-basin. Durazo and Farvolden (1989) indicate that it is not easy to obtain missing data on an aquifer’s level, since in situ measurements are needed to generate models, reliable availability predictions and judicious water allocations. The only way to obtain reasonably accurate information on a basin’s water table is to drill control wells, although this involves time and resources, so the most viable way to obtain this information is to use historical data and indirect observations to describe the original conditions.
In this work, the aquifer’s static levels showed a tendency to increase their depth, with a difference of at least 14 m between 1997 and 2016. This situation reflects the level of depletion of the aquifer in almost 20 years, which is exacerbated by the climatic conditions of the area. In this sense, low rainfall rates imply a greater dependence on groundwater, which increases the level of extraction. In addition, water demands for the various needs of the population could at some time exceed the natural recovery capacity of the aquifer, which would lead to drilling deeper wells. This situation puts the health of those who consume the groundwater at risk, since, according to Esteller, Rodríguez, Cardona, and Padilla-Sánchez (2012), there is a risk that the chemical composition of the water is different: deep brackish water or thermal water rich in trace elements. Sandoval-Montes, Ramos-Leal, and Morán-Ramírez (2016) explain that deep groundwater levels in an aquifer show greater physicochemical evolution, which forces them to be monitored continuously to avoid soil salinization due to its use in irrigating plots. Therefore, knowing the behavior of groundwater, together with regional climate dynamics, becomes a very useful tool, both for integrated water management and for the promotion of aquifer sustainability.
Conclusions
The analysis of the temporal variations of the TVA’s static levels, from 1997 to 2016, allowed us to know the behavior of the aquifer (recovery or depletion) and the activities that generate pressure on it.
Continuing to monitor the evolution of static groundwater levels is essential to identify vulnerable or critical areas. In the case of the TVA, it is important to expand the monitoring network to have more accurate estimates, which should consider its heterogeneity and the water demand of users. In the long term, constant monitoring will make it possible to identify the variability in groundwater levels and to understand the causes of variations in that level.

