


 texto en
  Inglés (pdf)
 Artículo en XML
 Referencias del artículo
 Enviar artículo por email
 Citado por SciELO
  Similares en
SciELO
Similares en
SciELO 
 Permalink
Introduction
Tree total height (H) and diameter at breast height (DBH) are the most commonly used variables in forest management and modelling, and therefore the most widely measured in forest inventories. The basis of growth and yield systems depends on accurate measurements of these variables (Misik, Antal, Kárász, & Tóthmérész, 2016; Sharma, 2016), as they are used in the simulation of tree growth (Mehtätalo, de-Miguel, & Gregoire, 2015); furthermore, H is needed to estimate volume, biomass, carbon content and economic value (Gonzalez-Benecke et al., 2018; MacPhee et al., 2018). The H measurement can be costly and time consuming, so it is taken on a subsample in forest inventory plots, while DBH is easily measured (Adame, del Rio, & Cañellas, 2008). In the sampling plots it is common to measure DBH from all trees and some of them are selected to measure H, then the rest are generally estimated with H-DBH equations (Santos, Terra, Chaer, & Monte, 2018; Sharma, 2016) due to the exhibited correlation between these variables (Calama & Montero, 2004; Zang, Lei, & Zeng, 2016). These equations are often used to minimize costs associated with forest inventories and to reduce problems related to measurement error (MacPhee, Kershaw, Weiskittel, Golding, & Lavigne, 2018).
The H-DBH relationship has been studied with several approaches and types of datasets. Of the main approaches, local or generalized equations have been used in forestry research. A local equation has the form H = f (DBH, ω), while a generalized equation has the form H = f (DBH, BA, HD, ω) with plot or stand variables such as basal area (BA), dominant height (HD) and density (N); in both cases, ω is the parameter vector. In the last two decades, local and generalized equations have been studied in many species, and the most used approach has been nonlinear mixed effects models (Calama & Montero, 2004; Crecente-Campo, Tomé, Soares, & Diéguez-Aranda, 2010; Gómez-García, Diéguez-Aranda, Castedo-Dorado, & Crecente-Campo, 2014; Kearsley et al., 2017; MacPhee et al., 2018; Saunders & Wagner, 2008; Sharma, 2016). In addition, quantile regression, additive generalized model or Dummy variable approaches have been used (Duan, Gao, Wang, & Fu, 2018; Zang et al., 2016). Similarly, in the Mexican research, local and general equations have been reported for species and species groups (Corral-Rivas, Alvarez-Gonzalez, Crecente-Campo, & Corral-Rivas, 2014; Crecente-Campo, Corral-Rivas, Vargas-Larreta, & Wehenkel, 2014; Vargas-Larreta, Castedo-Dorado, Alvarez-Gonzalez, Barrio-Anta, & Cruz-Cobos, 2009). The datasets are often based on H-DBH measurements from forest inventories, measurement and remeasurement plots, or permanent plots. In most studies, generalized equations perform better than local equations; when a local equation is expanded with stand variables, the application may occasionally be complex, because such variables are not always available.
In the development of H-DBH models, they should capture the full range of population variation, and datasets should take this range with an appropriate sampling design and size (MacPhee et al., 2018). In this study, equations of outside-bark DBH as a function of inside-bark DBH were developed and the H-DBH relationship was extended to the H-DBH, H-A and DBH-A relationships by using age (A). Also a prediction and projection equation systems were fitted for Pinus arizonica Engelmann and Pinus durangensis Martinez with Dummy variable approach and using longitudinal measurements of stem analysis data.
Materials and methods
Area of study and data
Data come from 46 and 66 stem analysis trees of P. arizonica (Pa) and P. durangensis (Pd), respectively, collected in 2006 in northwest Durango, Mexico. The forest region of study was the ejido San Diego de Tezains, geographically located at 24° 48′ 16.98′′ - 25° 13′ 47.25′′ LN and 105° 53′ 9.81′′-106° 12′ 52.58′′ LO (Figure 1). The total area is 61 089 ha, of which 28 636 ha are using for timber production (Quiñonez-Barraza, Zhao, De los Santos Posadas, & Corral-Rivas, 2018). The main climate is cold temperate, the average annual temperature varies from 5 to 12 °C and the average annual rainfall is 840 mm (García, 2004; Quiñonez-Barraza et al., 2019). About 85 % of the stands are uneven-age and mixed and they are represented by the genus Pinus, Quercus, Juniperus, Cupressus, Pseudotsuga, Arbutus and Alnus. The stands have been managed according to the continuous cover forestry system with individual selection and natural regeneration, or the rotation forest management system characterized by three or four thinnings and a shelterwood cut (Pukkala & Gadow, 2011; Quiñonez-Barraza et al., 2018). The cutting cycle is 15 years (Quiñonez-Barraza et al., 2018).
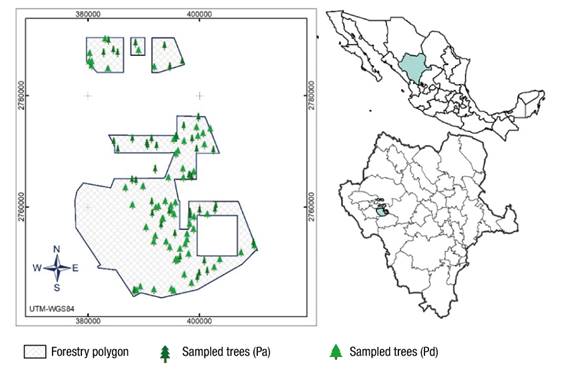
Figure 1 Study area and location of sampled trees from Pinus arizonica (Pa) and Pinus durangensis (Pd) in northwest Durango, Mexico.
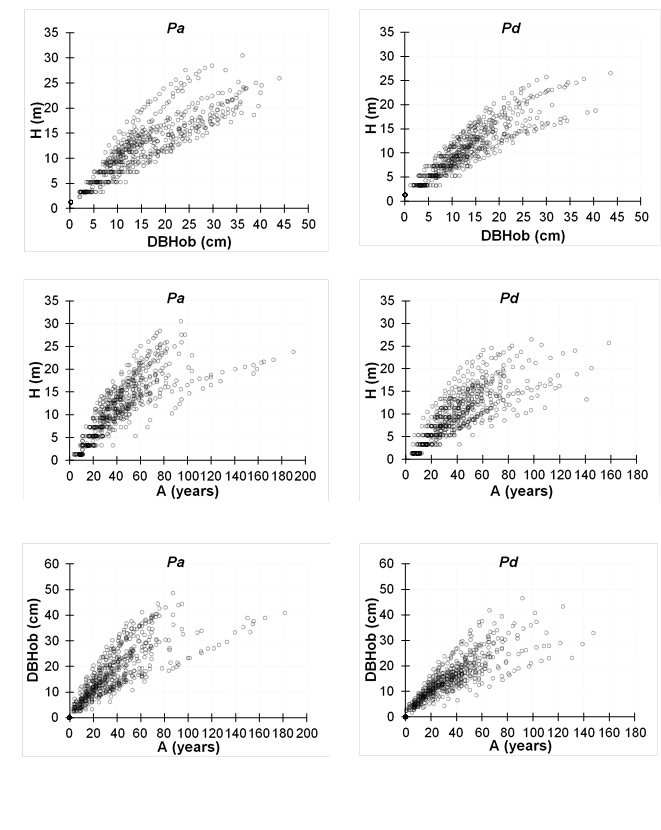
Sampled trees were randomly selected in mixed-species stands to cover canopy types, densities, heights, DBHs, stand structures, ages, and productivity (Figure 1). All trees were cut as close to the ground as possible; each fallen tree was sectioned and measured at 1.3 m, and subsequently every 2 m to the tree top. The DBH, commercial H and number of growth rings were measured in each cross-section. Growth in diameter was examined with the width of the annual growth rings in the DBH cross-section. In the stem analysis trees, 601 and 760 repeated measurements of H-DBH, H-A, and DBH-A were considered for Pa and Pd, respectively. A summary of the individual tree dataset and the measurements of the stem analysis variables for each species is shown in Table 1. Figure 2 illustrates the relationship of outside-bark DBH (DBHob) as a function of inside-bark DBH (DBHib) corresponding to the cross-section at 1.3 m and Figure 3 shows the trends for the H-DBHob, H-A and DBHob-A relationships. The H corresponding to an age for a specific cross section was estimated with the Carmean method (Carmean, 1972; Dyer & Bailey, 1987). With the data from stem analysis, four relationships were tested and modeled for each species: (1) DBHob-DBHib, (2) H-DBHob (H-DBH), (3) H-A in the cross section of the DBH, and (4) DBHob-A (DBH-A) in the cross section of the DBH.
Table 1 Variables of sampled trees (1) and stem analysis (2) of Pinus arizonica and Pinus durangensis in mixed-species stands of Durango, Mexico.
| Data | Variable | Pinus arizonica | Pinus durangensis | ||||||||
|---|---|---|---|---|---|---|---|---|---|---|---|
| n | Min | Max | Mean | SD | n | Min | Max | Mean | S | ||
| 1 | H (m) | 46 | 8.3 | 30.5 | 18.1 | 4.7 | 66 | 8.7 | 26.5 | 16.1 | 4.6 |
| DBH (cm) | 14.0 | 51.0 | 27.2 | 10.3 | 13.0 | 45.0 | 24.6 | 8.9 | |||
| A (years) | 39.0 | 190.0 | 76.7 | 29.8 | 35.0 | 172.0 | 75.2 | 30.7 | |||
| 2 | H (m) | 601 | 1.3 | 30.5 | 11.4 | 6.5 | 760 | 1.3 | 26.5 | 9.9 | 5.7 |
| DBHib (cm) | 0.0 | 44.0 | 14.5 | 9.6 | 0.0 | 43.6 | 12.4 | 8.4 | |||
| DBHob (cm) | 0.0 | 48.7 | 16.3 | 10.7 | 0.0 | 46.5 | 14.2 | 9.1 | |||
| A (years) | 3.0 | 190.0 | 43.1 | 27.8 | 2.0 | 172.0 | 42.5 | 27.6 | |||
| A-DBH (years) | 0.0 | 181.0 | 34.9 | 27.9 | 0.0 | 167.0 | 34.7 | 27.6 | |||
n = number of observations, Min = minimum, Max = maximum, Mean = media, SD = standard deviation, H = height, DBH = diameter at breast height, DBHib = outside-bark DBH, DBHob = inside-bark DBH, A = number of rings on each tree section, A-DBH = age on DBH cross section (i.e., number of rings on 1.3 m cross section).
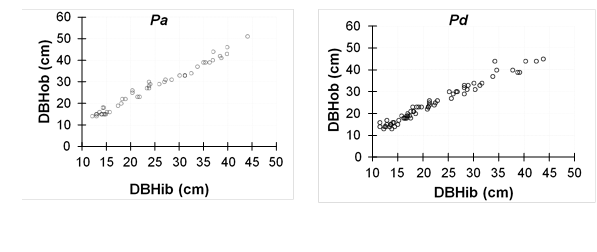
Figure 2 Outside-bark DBH (DBHob) and inside-bark DBH (DBHib) in cross section at 1.3 m for Pinus arizonica (Pa) and Pinus durangensis (Pd).
Systems of equations H-DBH-A
The DBHob was modeled with DBHib as a predictor variable. For this purpose, the potential, linear and exponential equations were used:
where,
DBHob i |
outside-bark DBH (cm) in the tree i |
DBHib i |
inside-bark DBH (cm) in the tree i |
δ 0 and δ 1 |
parameters to be estimated |
e |
Euler number |
ε i |
error in the tree i. |
The potential equation outperformed the others in a preliminary analysis. Therefore, this relationship was used to predict the DBHob for each measurement in the cross section of the DBHib.
H-DBH, H-A and DBH-A relationships
A prediction model based on the Chapman-Richards equation (Richards, 1959) was used to model H-DBH, H-A and DBH-A relationships. The equation with the lower asymptote (Al) is represented in the following equation:
where,
Y ij |
H j (m) o el DBHob j (cm) in the tree i |
X ij |
DBHob j (cm) or the age j (A; years) in the DBH cross section of the tree i |
α 0, α 1 and α 2 |
parameters to be estimated |
e |
Euler number |
ε ij |
error j of tree i. |
In the relations H-DBH and H-A, Al is equal to 1.3 m when DBH or A is equal to zero. In the DBH-A relationship, Al is equal to zero when A is equal to zero.
The generalized algebraic difference equation approach (GADA), proposed by Cieszewski and Bailey (2000), was used as a projection equation. The GADA equation reported by Quiñonez-Barraza et al. (2015) was reparameterized with Al, and the two-state equation is given by:
where,
Y2 ij |
H j in the DBHob j of the tree i in state 2, H j at A j of the tree i in state 2, DBHob j at A j in the tree i in state 2, for the relationships H-DBH, H-A and DBH-A, respectively |
Y1 ij |
H j in the DBHob j in the tree i in state 1, H j at A j in the tree i in state 1, and DBHob j at A j in the tree i in state 1, for the relationships H-DBH, H-A y DBH-A, respectively |
ß 1 , ß 2 and α 1 |
global parameters to be estimated |
In |
natural logarithm |
ε2 ij |
residuals of the height j at the DBHob j in the tree i in state 2, the H j at the A j in the tree i in state 2, and the DBHob j at the A j in the tree i in state 2, for the relations H-DBH, H-A and DBH-A, respectively |
X1 ij and X2 ij |
DBHob j or A j in the tree i in states 1 and 2 |
In this case, the parameter α 1 is compatible with the prediction equation for all relationships, and Y2 ij = 1.3 when DBHob2 ij = 0, Y2 ij = 1.3 when A2 ij = 0, and Y2 ij = 0 when A2 ij = 0 for the relationships H-DBH, H-A and DBH-A, respectively.
Variance-Covariance matrix
In the variance-covariance matrix, a data arrangement was used in the repetitive measurements of DBH or A (j). Y ij y X ij denote the measurement j (j = 1, 2, …m) in the tree i (i = 1, 2, …n), Y i = (Y i1 , Y i2 , …Y im )T and X i = (X i1 , X i2 , …X im )T the growth series i for a measurement of DBHib j or A j given, respectively. The average H and DBHob (ε) and the variance-covariance matrix (Σ) for n trees, given the DBH and A, were expressed according to Wang, Kane, and Zhao (2017):
Under the apparently unrelated regression method (SUR), the system of prediction and projection equations for the H-DBH relationship can assume the following variance-covariance matrix:
where I is the order identity matrix L × L and
Fitting and evaluation of the equations
The DBHob-DBHib equations were fitted by ordinary least squares (OLS) in the SAS/ETS® Model procedure (SAS Institute Inc., 2015). The Dummy variables approach (DVA) described by Cieszewski, Harrison, and Martin (2000) was used to simultaneously fit the prediction and projection equations. This method has been used in the H-A relationship with common and tree-specific parameters in site index equations (Diéguez-Aranda, Burkhart, & Amateis, 2006; García-Espinoza et al., 2019; Wang, Borders, & Zhao, 2008). In this case, for the projection equations, the initial mean values of H and DBH (Y ij ) and DBH or A (X ij ) were used as specific parameters according to the concept of base age invariant site index equations, described by Bailey and Clutter (1974); the specific parameters explain the variation between each tree (Ni & Zhang, 2007).
The dummy variables for declaring the specific parameters were represented
according to Wang et al. (2008), as
Results and discussion
The preliminarily adjusted equations modeled the DBHob as a function of the DBHib for each species and the potential was better for both species. The results of this equation allowed the modeling of H-DBH and DBH-A relationships with repetitive measurements of DBHib measured in the DBH cross section. Table 2 shows the estimated parameters and the statistics of fitting of the potential, linear and exponential equations. The values of R 2 with the potential equation were 0.9804 and 0.9664 for Pa and Pd, respectively. The linear equation was similar to the potential, but the intercept parameter was significantly equal to zero (α = 0.05) for Pa, while the exponential equation showed the poorest fitting.
Table 2 Estimated parameters and statistical of fitting of the equations to model the outside-bark diameter at breast height (DBHob) for Pinus arizonica (Pa) and Pinus durangensis (Pd).
| Equation | Species | Parameter | Estimator | EE | t | P-t | R2 | RMSE (cm) | AIC | E (cm) |
|---|---|---|---|---|---|---|---|---|---|---|
| Power | Pa |
|
1.2050 | 0.0896 | 13.45 | <0.0001 | 0.9804 | 1.4263 | 38.67 | −0.0045 |
|
|
0.9774 | 0.0216 | 45.26 | <0.0001 | ||||||
| Pd |
|
1.3913 | 0.1068 | 13.03 | <0.0001 | 0.9664 | 1.6172 | 69.46 | −0.0203 | |
|
|
0.9297 | 0.0223 | 41.73 | <0.0001 | ||||||
| Linear | Pa |
|
0.5511 | 0.6261 | 0.89 | 0.3801 | 0.9804 | 1.4608 | 29.26 | 8.07×10⁻¹⁶ |
|
|
1.0962 | 0.0228 | 48.07 | <0.0001 | ||||||
| Pd |
|
1.6404 | 0.5936 | 2.76 | 0.0075 | 0.9653 | 1.6697 | 71.63 | −2.28×10⁻¹⁵ | |
|
|
1.0390 | 0.0208 | 49.86 | <0.0001 | ||||||
| Exponential | Pa |
|
10.4381 | 0.3670 | 28.45 | <0.0001 | 0.9589 | 2.1186 | 78.34 | −0.0509 |
|
|
0.0370 | 0.0012 | 32.10 | <0.0001 | ||||||
| Pd |
|
10.8086 | 0.3952 | 27.35 | <0.0001 | 0.9226 | 2.4949 | 124.65 | −0.0804 | |
|
|
0.0352 | 0.0011 | 33.30 | <0.0001 |
EE = asymptotic standard error; t = value of Student t; P-t = value of the probability associated with Student t; R2 = adjusted coefficient of determination; RMSE = root of the mean square of the error; AIC = Akaike's information criterion; E = mean bias.
The application of the H-DBH or DBH-A equations should use measurements of the DBHob, because it is usually measured in forest inventories and used to predict H, which reduces the problems associated with measurement error (MacPhee et al., 2018; Misik et al., 2016). If DBH measurements are derived from stem analysis data, each DBHib measurement should be transformed to DBHob. Then, the H-DBH relationship can be established to predict H, which is one of the most important characteristics in forest structure (Mehtätalo et al., 2015; Wang et al., 2017). The H and DBH variables can be predicted and projected as functions of the A of the DBH cross section and used in the characterization of stand productivity (Duan et al., 2018; Fu et al., 2018). The estimated parameters in the three relationships studied are listed in Table 3. All parameters, both common and specific, were significantly different from zero at a significance level of 5 %.
Table 3 Estimated parameters and asymptotic standard errors (in brackets) of the prediction and projection equations for Pinus arizonica (Pa) and Pinus durangensis (Pd).
| Species | Estimated Parameters | |||||||||
|---|---|---|---|---|---|---|---|---|---|---|
|
|
|
|
|
|
|
|
|
|
||
| H-DBH | ||||||||||
| Pa | 6.0109 | −1.4374 | 24.2726 | 0.0550 | 1.4969 | 0.9005 | 0.7853 | 1.1178 | 0.9204 | |
| (1.0712) | (0.5944) | (0.7958) | (0.0037) | (0.0635) | (0.0238) | (0.0207) | (0.0173) | (0.0132) | ||
| Pd | 4.9970 | −0.9132 | 24.3283 | 0.0577 | 1.7079 | 0.8263 | 0.7371 | 1.1023 | 0.9059 | |
| (0.6662) | (0.3592) | (0.7731) | (0.0034) | (0.0638) | (0.0247) | (0.0231) | (0.0161) | (0.0128) | ||
| H-A | ||||||||||
| Pa | 6.5262 | −3.0063 | 25.5167 | 0.0168 | 0.8620 | 0.7201 | 0.8214 | 1.0095 | 0.8357 | |
| (1.1825) | (1.1358) | (0.8633) | (0.0014) | (0.0365) | (0.0246) | (0.0116) | (0.0199) | (0.0178) | ||
| Pd | 9.2037 | −5.7387 | 25.7530 | 0.0111 | 0.7635 | 0.7090 | 0.8112 | 1.0530 | 0.8718 | |
| (2.4757) | (2.5125) | (1.1230) | (0.0011) | (0.0269) | (0.0234) | (0.0109) | (0.0171) | (0.0141) | ||
| DBH-A | ||||||||||
| Pa | 7.8807 | −4.1804 | 49.9506 | 0.0110 | 0.9388 | 0.9640 | 0.8556 | 1.0589 | 0.9479 | |
| (1.5484) | (1.6879) | (2.7101) | (0.0012) | (0.0364) | (0.0149) | (0.0155) | (0.0096) | (0.0085) | ||
| Pd | 7.9283 | −3.9876 | 70.3490 | 0.0033 | 0.7142 | 0.9313 | 0.8572 | 1.1172 | 0.9534 | |
| (0.1416) | (0.1487) | (10.9112) | (0.0009) | (0.0194) | (0.0164) | (0.0147) | (0.0079) | (0.0069) | ||
H = height, DBH = normal diameter, A = age. ρ1 and ρ2 are the parameters of the corCAR2 model for the projection equation, while ρ3 and ρ4 correspond to the prediction equation.
Fitting statistics such as R2, RMSE, AIC and E are shown in Table 4. The variance-covariance matrices for the prediction and projection equations, for each relationship and species, and the descriptive statistics for the specific adjusted parameters are found in Appendix B1. For the H-DBH relationship, the prediction model had R2 values of 0.8210 and 0.8521 and RMSE values of 2.7238 m and 2.1717 m, for Pa and Pd, respectively. The projection equation showed better results than the prediction equation. The R2 values were 0.9611 and 0.9595, while the RMSE values were 1.2212 m and 1.0865 m, for Pa and Pd, respectively. In the H-A equations, the results were similar among species; the R2 values were 0.7710 and 0.7086 with the prediction equation and 0.9505 and 0.9435 with the projection equation for Pa and Pd, respectively. In the DBH-A relationship, the prediction equation showed R2 values of 0.7338 and 0.7200, while the projection equation had values of 0.9669 and 0.9560 for Pa and Pd, respectively.
Table 4 Fitting statistics of the prediction and projection equations for Pinus arizonica (Pa) and Pinus durangensis (Pd).
| Species | Model | Fitting Statistics | ||||
|---|---|---|---|---|---|---|
| k | R2 | RMSE | AIC | E | ||
| H-DBH | ||||||
| Pa | Prediction | 5 | 0.8210 | 2.7238 | 1 216 | 0.1969 |
| Projection | 50 | 0.9611 | 1.2212 | 342 | 0.0365 | |
| Pd | Prediction | 5 | 0.8521 | 2.1717 | 1 190 | 0.2346 |
| Projection | 70 | 0.9595 | 1.0865 | 268 | 0.1668 | |
| H-A | ||||||
| Pa | Prediction | 5 | 0.7710 | 3.0961 | 1 362 | 0.3411 |
| Projection | 50 | 0.9505 | 1.3776 | 487 | 0.2631 | |
| Pd | Prediction | 5 | 0.7086 | 3.0527 | 1 704 | 0.4403 |
| Projection | 70 | 0.9435 | 1.2835 | 521 | 0.2531 | |
| DBH-A | ||||||
| Pa | Prediction | 5 | 0.7338 | 5.4510 | 2 058 | 0.8642 |
| Projection | 50 | 0.9669 | 1.8731 | 849 | 0.2017 | |
| Pd | Prediction | 5 | 0.7200 | 4.7917 | 2 389 | 0.7969 |
| Projection | 70 | 0.9560 | 1.8142 | 1 047 | 0.2378 | |
H = height, DBH = diameter at breast height, A = age. k = number of parameters in the equation, R2 = adjusted coefficient of determination, RMSE = root mean square error (H, m; DBH, cm), AIC = Akaike's information criterion, E = average bias (H, m; DBH, cm).
The DVA ensured common and tree-specific parameters in the projection equations. This procedure is similar to the non-linear mixed effect model (NLMEM) approach for the H-A relationship. The DVA also considers a specific or random parameter for each tree (Diéguez-Aranda et al., 2006; Wang et al., 2008). The H-DBH, H-A and DBH-A relationships were fitted as equation systems of prediction and projection with the compatible growth rate parameter (α1). The projection equations presented specific parameters for each tree (summary information is found in Appendix B2). The GADA equation used (Quiñonez-Barraza et al., 2015) allowed the projection of exogenous variables with common and tree-specific parameters for the established relationships.
The values of SEE and E and the relative ones (RSEE and RE) for the prediction and projection equations by relative H classes, in the relations H-DBH and H-A, are showed in Table 5, and by relative DBH classes for DBH-A are shown in Table 6. Pa had higher values of SEE and E than Pd for all data and by relative classes of H or DBH. The largest values of SEE and E were observed in the first relative classes of H and DBH for both species.
Table 5 Fitting statistics on H-DBH (Height-Diameter at breast height) and H-A (Height-Age) relationships by H class for Pinus arizonica (Pa) and Pinus durangensis (Pd).
| Relative H (%) | n | Prediction | Projection | ||||||
|---|---|---|---|---|---|---|---|---|---|
| SEE (m) | RSEE (%) | E (m) | RE (%) | SEE (m) | RSEE (%) | E (m) | RE (%) | ||
| H-DBH (Pa) | |||||||||
| 0-30 | 126 | 1.247 | 40.41 | -0.531 | -17.21 | 0.850 | 27.53 | -0.042 | -1.37 |
| 30-40 | 40 | 2.396 | 35.20 | -0.948 | -13.93 | 1.330 | 19.53 | -0.105 | -1.54 |
| 40-50 | 44 | 2.613 | 30.64 | -0.817 | -9.58 | 1.586 | 18.60 | -0.033 | -0.39 |
| 50-60 | 49 | 2.681 | 26.68 | -0.595 | -5.92 | 1.367 | 13.60 | 0.164 | 1.63 |
| 60-70 | 67 | 2.786 | 23.01 | -0.041 | -0.34 | 1.353 | 11.17 | 0.427 | 3.52 |
| 70-80 | 85 | 3.028 | 22.06 | 0.069 | 0.50 | 1.352 | 9.85 | 0.416 | 3.04 |
| 80-90 | 116 | 3.381 | 20.30 | 0.728 | 4.37 | 1.260 | 7.56 | 0.307 | 1.84 |
| 90-100 | 74 | 3.814 | 19.80 | 1.409 | 7.32 | 1.378 | 7.15 | 0.294 | 1.53 |
| Total | 601 | 2.735 | 23.95 | 0.036 | 0.32 | 1.275 | 11.17 | 0.197 | 1.72 |
| H-DBH (Pd) | |||||||||
| 0-30 | 159 | 0.982 | 34.49 | -0.187 | -6.59 | 0.739 | 25.98 | -0.029 | -1.01 |
| 30-40 | 50 | 1.693 | 27.98 | 0.091 | 1.51 | 1.317 | 21.75 | 0.306 | 5.05 |
| 40-50 | 64 | 1.933 | 25.82 | 0.007 | 0.09 | 1.331 | 17.77 | 0.347 | 4.63 |
| 50-60 | 69 | 2.239 | 24.15 | 0.002 | 0.02 | 1.203 | 12.98 | 0.366 | 3.95 |
| 60-70 | 91 | 2.257 | 21.31 | 0.326 | 3.07 | 1.247 | 11.77 | 0.555 | 5.24 |
| 70-80 | 111 | 2.472 | 20.06 | 0.217 | 1.76 | 1.073 | 8.71 | 0.365 | 2.96 |
| 80-90 | 129 | 2.790 | 18.95 | 0.351 | 2.38 | 1.060 | 7.20 | 0.184 | 1.25 |
| 90-100 | 87 | 2.953 | 17.44 | 0.603 | 3.56 | 1.320 | 7.80 | 0.062 | 0.37 |
| Total | 760 | 2.179 | 21.85 | 0.167 | 1.67 | 1.140 | 11.44 | 0.235 | 2.35 |
| H-A (Pa) | |||||||||
| 0-30 | 126 | 2.064 | 66.87 | -0.101 | -3.26 | 1.473 | 47.70 | 0.368 | 11.94 |
| 30-40 | 40 | 2.462 | 36.17 | -0.645 | -9.48 | 1.514 | 22.24 | 0.113 | 1.66 |
| 40-50 | 44 | 2.582 | 30.27 | -0.199 | -2.34 | 1.655 | 19.40 | 0.410 | 4.81 |
| 50-60 | 49 | 3.086 | 30.71 | -0.270 | -2.68 | 1.548 | 15.41 | 0.363 | 3.61 |
| 60-70 | 67 | 3.117 | 25.75 | 0.197 | 1.63 | 1.440 | 11.89 | 0.437 | 3.61 |
| 70-80 | 85 | 3.179 | 23.17 | 0.540 | 3.94 | 1.406 | 10.25 | 0.519 | 3.78 |
| 80-90 | 116 | 3.686 | 22.12 | 0.971 | 5.83 | 1.163 | 6.98 | 0.170 | 1.02 |
| 90-100 | 74 | 4.243 | 22.03 | 1.268 | 6.58 | 1.469 | 7.62 | -0.295 | -1.53 |
| Total | 601 | 3.094 | 27.09 | 0.341 | 2.99 | 1.439 | 12.60 | 0.263 | 2.30 |
| H-A (Pd) | |||||||||
| 0-30 | 159 | 1.670 | 58.68 | 0.185 | 6.49 | 1.381 | 48.53 | 0.640 | 22.48 |
| 30-40 | 50 | 1.940 | 32.05 | -0.268 | -4.42 | 1.401 | 23.14 | 0.332 | 5.49 |
| 40-50 | 64 | 2.488 | 33.23 | -0.401 | -5.36 | 1.475 | 19.70 | 0.297 | 3.97 |
| 50-60 | 69 | 2.777 | 29.95 | 0.014 | 0.16 | 1.501 | 16.20 | 0.436 | 4.71 |
| 60-70 | 91 | 3.153 | 29.75 | 0.108 | 1.02 | 1.326 | 12.51 | 0.345 | 3.26 |
| 70-80 | 111 | 3.478 | 28.24 | 0.408 | 3.31 | 1.227 | 9.96 | 0.201 | 1.63 |
| 80-90 | 129 | 3.875 | 26.32 | 1.085 | 7.37 | 1.116 | 7.58 | 0.060 | 0.41 |
| 90-100 | 87 | 4.241 | 25.05 | 1.705 | 10.07 | 1.270 | 7.50 | -0.420 | -2.48 |
| Total | 760 | 3.059 | 30.68 | 0.440 | 4.42 | 1.347 | 13.51 | 0.253 | 2.54 |
n = number of observations, SEE = standard error of the estimate, E = bias, RSEE = standard error of the relative estimate, RE = relative average bias.
Table 6 Fitting statistics on DBH-A (Diameter at breast height-Age) relationships by DBH class for Pinus arizonica (Pa) and Pinus durangensis (Pd).
| Relative DBH (%) | n | Prediction | Projection | ||||||
|---|---|---|---|---|---|---|---|---|---|
| SEE (cm) | RSEE (%) | E (cm) | RE (%) | SEE (cm) | RSEE (%) | E (cm) | RE (%) | ||
| DBH-A (Pa) | |||||||||
| 0-20 | 88 | 1.932 | 89.42 | -0.233 | -10.79 | 1.914 | 88.55 | -0.488 | -22.58 |
| 20-30 | 45 | 2.365 | 34.12 | 0.086 | 1.24 | 1.956 | 28.22 | -0.043 | -0.61 |
| 30-40 | 47 | 3.944 | 36.35 | 0.104 | 0.96 | 2.411 | 22.23 | -0.174 | -1.61 |
| 40-50 | 49 | 4.664 | 35.54 | 0.418 | 3.18 | 2.184 | 16.64 | 0.214 | 1.63 |
| 50-60 | 72 | 5.288 | 33.96 | 0.203 | 1.30 | 1.999 | 12.84 | 0.207 | 1.33 |
| 60-70 | 74 | 5.866 | 31.65 | 0.416 | 2.25 | 1.590 | 8.58 | 0.232 | 1.25 |
| 70-80 | 85 | 6.377 | 29.45 | 1.634 | 7.55 | 1.491 | 6.89 | 0.495 | 2.29 |
| 80-90 | 72 | 7.449 | 28.38 | 2.621 | 9.98 | 1.466 | 5.59 | 0.624 | 2.38 |
| 90-100 | 69 | 8.201 | 29.22 | 1.996 | 7.11 | 2.528 | 9.01 | 0.647 | 2.30 |
| Total | 601 | 5.518 | 33.79 | 0.864 | 5.29 | 1.945 | 11.91 | 0.202 | 1.23 |
| DBH-A (Pd) | |||||||||
| 0-20 | 118 | 1.526 | 79.45 | -0.291 | -15.17 | 1.088 | 56.67 | -0.173 | -9.01 |
| 20-30 | 57 | 3.071 | 45.12 | -0.645 | -9.48 | 1.934 | 28.42 | -0.514 | -7.55 |
| 30-40 | 65 | 3.783 | 38.59 | -0.248 | -2.53 | 2.130 | 21.73 | -0.218 | -2.22 |
| 40-50 | 72 | 3.959 | 32.02 | 0.178 | 1.44 | 1.616 | 13.07 | -0.078 | -0.63 |
| 50-60 | 82 | 4.744 | 32.12 | 0.318 | 2.15 | 1.893 | 12.81 | -0.099 | -0.67 |
| 60-70 | 92 | 5.164 | 30.16 | 1.431 | 8.36 | 1.644 | 9.60 | 0.347 | 2.03 |
| 70-80 | 99 | 6.309 | 33.07 | 0.960 | 5.03 | 1.788 | 9.37 | 0.480 | 2.52 |
| 80-90 | 93 | 5.718 | 27.01 | 2.173 | 10.26 | 2.022 | 9.55 | 1.045 | 4.94 |
| 90-100 | 82 | 7.311 | 30.28 | 2.747 | 11.38 | 2.684 | 11.12 | 0.996 | 4.13 |
| Total | 760 | 4.801 | 33.89 | 0.797 | 5.63 | 1.904 | 13.44 | 0.238 | 1.68 |
n = number of observations, SEE = standard error of the estimate, E = bias, RSEE = standard error of the relative estimate, RE = relative average bias.
The percentages of gain in R 2 values between the projection and prediction equations were 14.6 % and 11.2 % and the percentages of reduction in RMSE of 123.0 % and 99.9 % for Pa and Pd, respectively. In contrast, Vargas-Larreta et al. (2009) reported gains in R2 of 1.2 % and 2.4 % and reductions in RMSE of 3.72 % and 6.09 % for Pinus cooperi C. E. Blanco between the NLMEM and OLS procedures, respectively, with the generalized equation based on the Chapman-Richards equation and the inclusion of the quadratic mean diameter. Corral-Rivas et al. (2014) determined R2 gains of 14 % and 2 % and RMSE reductions of 33 % and 5.2 % with NLMEM and OLS between generalized and local models based on the Chapman-Richards equation, respectively, for the genus Pinus. Similarly, Crecente-Campo et al. (2014) indicated an RMSE reduction of 14.9 % between general and local equations fitted by OLS for all species combined, as well as a 7.5 % reduction between a general and local model fitted by NLMEM. Therefore, the local equations developed in this study perform better than the equations reported for the mixed and uneven-aged forests of Durango, Mexico. The H-DBH relationship fitted by NLMEM usually considers the variability between stand-stand, plot-plot, or ecoregion-ecoregion (Calama & Montero, 2004; Crecente-Campo et al., 2014; Mehtätalo et al., 2015; Paulo, Tomé, & Tomé, 2011; Rijal, Weiskittel, & Kershaw, 2012); however, in this study, the variability was assumed between tree and tree.
The residual and predicted values for the prediction and projection equations in the H-DBH, H-A, and DBH-A relationships are shown in Figures 4 and 5. In all cases, the graphs showed the residual trajectories for the growth series of each tree.
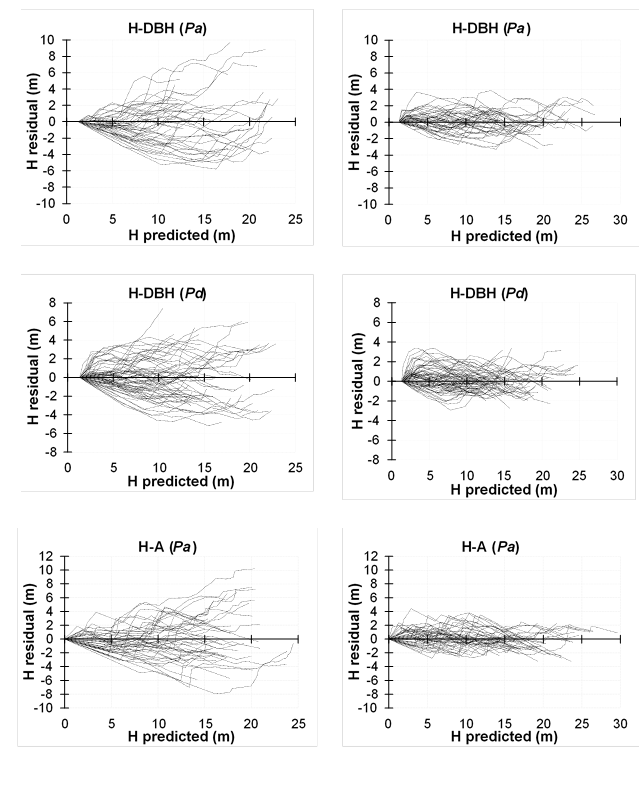
Figure 4 Residual versus predicted values for the H-DBH (Height-Diameter at breast height) and H-A (Height-Age) relationship of the prediction (left) and projection (right) equations for Pinus arizonica (Pa) and Pinus durangensis (Pd).
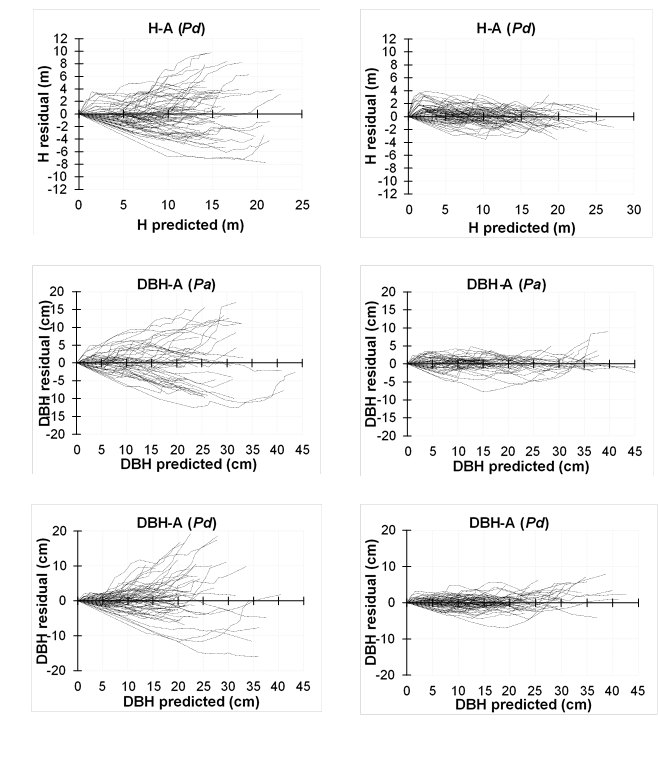
Figure 5 Residual versus predicted values for the H-A (height-age) and DBH-A (Diameter at breast height-Age) relationships of the prediction (left) and projection (right) equations for Pinus arizonica (Pa) and Pinus durangensis (Pd).
The three relations of prediction and projection performed well for Pa and Pd and the inverted equations (Appendix B3) formed a global system of equations. Those inverted equations hold the four criteria cited by Bi, Fox, Li, Lei, and Pang (2012), for the H-DBH relationship and the extended H-A and DBH-A relationships. These criteria are: (1) the H-DBH, H-A, and DBH-A functions are reversible; (2) the inverted functions are continuous and monotonically increasing over a specific range of H and DBH; (3) the DBH is equal to zero when H is equal to DBH in the inverted function, and A in the cross section of the DBH is equal to zero when H or DBH are equal to A in the inverted function; (4) the inverted functions have an inflection point that is consistent with biological expectations.
The DVA approach is similar to NLMEM; common parameters can be compared with fixed parameters and specific parameters with random parameters (Duan et al., 2018; Wang et al., 2008). The H-A, DBH-A and H-DBH relationships may be interpreted as a site productivity index for even-age or uneven-age forests (Duan et al., 2018; Fu et al., 2018; Wang et al., 2017). However, the usefulness of this index as a measure of site quality for uneven-age and mixed-species stands should be questioned and perhaps rejected, since age classes are diverse within and between mixed stands (Duan et al., 2018; Wang, 1998). Consequently, the objectives of this study were to develop and illustrate prediction and projection equation systems for Pa and Pd H-DBH-A relationships growing in natural and mixed stands. Therefore, in the H-DBH relationship, the theoretical assumption described by Fang and Bailey (1998) was guaranteed in the prediction and projection equations, in which the DBH of a tree should be equal to zero, when the H is equal to 1.3 m. This theoretical assumption was followed for the H-A relationship; the A of a tree in the DBH cross section was zero when the H was equal to 1.3 m. On the other hand, for the DBH-A relationship; the A of the tree was zero when the DBH was zero as well. In all cases, the A of the trees was taken as the number of rings in the cross section corresponding to the DBH. Thus, individual tree local equations can be applied to predict the variables of interest in a wide range of DBHs and Hs measurements, and in a variety of ecological conditions and silvicultural treatments (Gonzalez-Benecke et al., 2018). Additionally, a generalized equation may improve these applications in diverse stand-specific characteristics (Gonzalez-Benecke et al., 2014).
The least-squares procedure proposed by Wang et al. (2008) could be used to predict the specific parameter for an H or DBH from a new growth series in the projection equation, similar to the search for random parameters in the NLMEM procedure (Crecente-Campo et al., 2014). The stem analysis data guaranteed criterion 3 noted by Bi et al. (2012) for the Al parameter in both the prediction and projection equations and the corresponding inverted equations. In cases where the dataset does not cover this property; the lower asymptote should be guaranteed with the addition of the minimum measurement of DBH or A on the right side of the equation.
Conclusions
In this study, the H-DBH-A (Height-Diameter at breast height-Age) relationships were introduced as systems of independent prediction and projection equations for the species Pinus arizonica and Pinus durangensis. The developed equations allowed the prediction and projection of Hs and DBHs as a function of endogenous variables. With the inverted equations, a global system of equations was integrated when the measured variables were the DBHob (inside-bark diameter at breast height) and A (Age). The apparently unrelated regression method allowed the adjustment of the H-DBH, H-A and DBH-A relationships as prediction and projection equations with the focus on Dummy Variables Approach and common and specific parameters. In such a context, equation systems can be used as a powerful biometric tool in forest management or as input variables in growth and yield models; furthermore, they can maximize the cost effectiveness of timber volumes in the mixed-species forests of Durango, Mexico.

