


 text in
  English (pdf)
 Article in xml format
 Article references
 Send this article by e-mail
 Cited by SciELO
  Similars in
SciELO
Similars in
SciELO 
 Permalink
Introduction
One of the established premises in forest management, particularly in timber harvesting, is that activities carried out in a forest stand should lead to an increase in residual trees, which is not often the case (Powers, Pregitzer, Palik, & Webster, 2009). In Mexico, of the total area under forest management, approximately 50 % was under selective methods in 2001 (Comisión Nacional Forestal [CONAFOR], 2001). Unfortunately, updated data at the national level are difficult to obtain. Nevertheless, selective methods have shown deficiencies in their bases or procedures, such as the widespread application of formulas and methods without distinction between diverse ecological conditions or the assumption of an exponential growth of residual trees during the rotation (Hernández-Díaz, Corral-Rivas, Quiñonez-Chávez, Bacon-Sobbe, & Vargas-Larreta., 2008; Torres-Rojo, 2000).
Competition as a limiting factor for radial tree growth has been a topic of interest for decades (Cambrón-Sandoval, Suzán-Azpiri, Vargas-Hernández, Sánchez-Vargas, & Sáenz-Romero, 2013; Looney, D’Amato, Fraver, Palik, & Reinikainen, 2016; Tomé & Burkhart, 1989). Several authors have evaluated the thinnings applied in even-aged stands and their effects on various tree-size variables (Espinosa, García, & Valeria, 1994; Rodríguez-Ortiz et al., 2011; Kang, Shibuya, & Shin, 2014); however, few studies have delved into the evaluation of uneven-aged stands, mainly due to the complexity of the factors involved in the growth and development processes of the trees (Forget, Nolet, Doyon, Delagrange, & Jardon, 2007).
The present work focused on evaluating the growth of residual trees in mixed and uneven-aged pine stands that have been harvested with selection methods to analyze some of the variables that influence post-harvest growth and the processes that occur as a result of silvicultural activities.
Materials and methods
The study area is located in the municipality of Santa María Lachixío in the state of Oaxaca, Mexico (Figure 1). Sampling was done in two stands dominated by the species Pinus douglasiana Martínez, P. herrerae Martínez, P. lawsonii Roezl ex Gordon, P. leiophylla Schiede ex Schltdl. & Cham., P. oocarpa Schiede ex Schltdl, P. pringlei Shaw, and P. pseudostrobus Lindl. The stands were identified in the management program as II-03 with an area of 43.07 ha and as III-07 with 20.3 ha. The commercial use of the stands was carried out in 2003 with cutting intensities of 27.8 and 33.1 %, respectively. For the purposes of this study, 15 randomly-selected sampling points were established in each stand, considering an internal area of 20 m from the periphery to override the border effect. At each point, the nearest stump was located that presented the authorization mark for timber harvesting in a visible manner and from which there was at least one living individual within a 10-m radius.

Each stump was used as the center of the sampling site from which a circular site with a 10-m radius was delimited, to encompass both residual trees with competitive influence ranging from 0 to 8.5 m, and those without influence (Fraver et al., 2014). All living trees within the sampling site were evaluated, for which two wood cores were obtained with a 6-mm Pressler drill. The tree-size variables diameter at breast height (cm) and height (m) were recorded, and the distance and diameter at breast height of competing trees were determined. To classify a tree as a "competitor," the Bitterlich mobile plot method was used with a basal area factor of 4 (Crecente-Campo, Vázquez-Gómez, Rodríguez-Soalleiro, & Diéguez-Aranda, 2007). The following variables were also recorded at each sampling site: stump geographic coordinates, stump diameter (cm), elevation (m), average slope (degrees), and exposure (azimuth). Subsequently, for each tree evaluated, three distance-dependent competition indices were calculated and used as explanatory growth variables. The indices were as follows:
Daniels, Burkhart, and Clason (1986)
where,
di |
diameter at breast height of the subject tree (cm) |
dj |
diameter at breast height of the competing tree (cm) |
Distij |
distance in horizontal projection between the subject tree and the competing tree (m) |
n |
number of competing trees. |
The wood cores were processed using standard dendrochronology techniques for assembly, sanding and dating; the last-mentioned process was carried out with the WinDENDRO™ program (Regent Instruments Inc., 2009) with support from the COFECHA (Grissino-Mayer, 2001) and Microsoft Excel® programs. From the WinDENDRO™ program, ring width data series were obtained for each sample processed and then used to calculate the increase in basal area (IBA):
The IBA variable is less age-dependent than ring width, which remains stable in mature trees such as those in this study (Biondi, 1999; Martín-Benito, Del Rio, Heinrich, Helle, & Cañellas, 2010).
Growth trends were analyzed using the IBA in the 1993-2002 and 2004-2013 periods; the first period was established as a control or reference of the growth prior to the intervention or timber harvesting, and the second period was established as the growth period that would reflect the effects of such intervention. The period after the harvesting intervention was divided into two five-year periods, so that the growth response in the first years and in the short term (less than 10 years) could be analyzed in greater detail (Jones, Domke, & Thomas, 2009; Kang, Shibuya, & Shin, 2014).
The IBA of each growth ring for the same year is relative to the diameter of the individuals; in order to compare them, we calculated the percentage increase in basal area (PIBA), a variable similar to that used in other studies (Jones & Thomas, 2004; Powers et al., 2009) and standardized and independent of diameter. The PIBA was calculated with the following formula:
where,
C1 |
growth period 1, corresponding to the average IBA of the 10 years prior to the silvicultural intervention (1993-2002). |
C2 |
growth period 2, corresponding to the average IBA for the 10 years following the silvicultural intervention (2004-2013). |
The Kolmogorov-Smirnov normality test did not support the normal distribution of the PIBA data; therefore, the values were transformed into a natural logarithm. To avoid non-existent numbers, mathematically speaking, a value of 100 was added to all data prior to transformation.
Statistical analysis
The variables with the greatest influence on radial growth were identified with the stepwise selection method (Hocking, 1976) in the SAS program (Statistical Analysis Systems Institute, 2014). This method uses a critical value of α = 0.15 by default for the discrimination of significant variables; the variables inputted for significance verification were diameter at breast height, height, stump distance, age, competition indices, stump diameter and elevation.
The variables selected with the stepwise method were used to model the natural logarithm of the PIBA (Ln_PIBA) by means of multiple linear regression, for which a model with the following structure was used:
where,
β |
Intersection parameter |
α |
parameter of variable “X” |
x |
model variable |
n |
variable number |
ɛ |
model error. |
The categorical (species and exposure) and site (slope) variables were subjected to a one-factor analysis of variance. Subsequently, for the categorical variables, a Tukey-Kramer comparison of means test (P ≤ 0.05) was performed because the data are unbalanced in the groups, while the slope variable was analyzed with regression, because it is a continuous variable and because of the trends shown. Data processing and analysis were carried out with the SAS program (2014).
Results
Radial growth at individual tree level
Two samples were collected from each of the 204 individuals considered as subject trees in the 30 sampling sites; however, samples from seven trees could not be properly dated due to excess resin and lack of contrast in the rings, and three trees were less than 24 years old and therefore did not provide information from the 1993-2002 period. Due to the above, the final sample was 194 subject trees (Table 1).
Table 1 Summary of sample size by species and their tree-size characteristics.
| Species | Sample | Diameter at breast height (cm) | Height (m) |
|---|---|---|---|
| Pinus douglasiana | 49 | 37.6 ± 13.96 | 27.9 ± 6.99 |
| Pinus herrerae | 52 | 35.7 ± 16.97 | 26.3 ± 8.64 |
| Pinus lawsonii | 37 | 31.1 ± 10.63 | 23.7 ± 6.52 |
| Pinus leiophylla | 2 | 40.5 ± 4.55 | 35.5 ± 3.43 |
| Pinus oocarpa | 1 | 50.0 | 29.6 |
| Pinus pringlei | 20 | 35.3 ± 18.88 | 26.0 ± 8.89 |
| Pinus pseudostrobus | 33 | 36.2 ± 13.80 | 27.1 ± 8.66 |
| Total | 194 | 35.5 | 26.4 |
± standard deviation of the mean
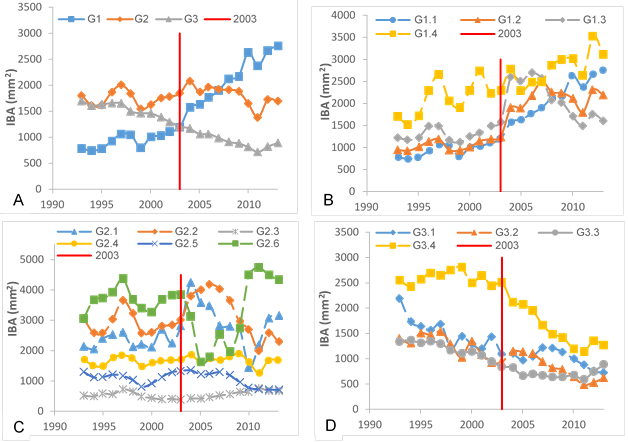
Since species was not an important variable (not significant with P > 0.05) to explain the Ln_PIBA, as detailed in the section on site variables, subsequent analyses were performed for the total set of samples. Thus, three types of growth response or groups were obtained as a result of Tukey comparison of means tests (α = 0.05) conducted for each subject tree. For this purpose, the average growth (IBA) of the 10 years after harvesting was contrasted with the average growth of the previous decade and the trends found were: significantly higher (G1), non-significant (G2) and significantly lower (G3) (Table 2). In the G1 group, the post-harvest period IBA was higher than the previous period IBA; i.e., there was an increase in growth. In the G2 group, the IBA is the same before and after harvest, so there were no changes in growth. In the G3 group, the post-harvest IBA is lower than the previous period IBA, i.e., the growth rate decreased. The annual IBA value of the individuals belonging to each group was averaged in the 1993-2013 assessment period, in order to determine the growth trend (Figure 2A).
Table 2 Groups and subgroups of Pinus species trees, according to growth patterns in the basal area for two five-year periods after harvest.
| Group | Subgroup | Five-year period 1* | Five-year period 2* | Individuals | Proportion (%) | PIBA |
|---|---|---|---|---|---|---|
| G1 | G1.1 | 1 | 1 | 9 | 5 | 248 |
| G1 | G1.2 | 1 | 0 | 50 | 26 | 145 |
| G1 | G1.3 | 1 | -1 | 18 | 9 | 73 |
| G1 | G1.4 | 0 | 0 | 6 | 3 | 47 |
| Subtotal | --- | --- | 83 | 43 | 133 | |
| G2 | G2.1 | 1 | 0 | 3 | 2 | 27 |
| G2 | G2.2 | 1 | -1 | 9 | 5 | 12 |
| G2 | G2.3 | 0 | 1 | 4 | 2 | 22 |
| G2 | G2.4 | 0 | 0 | 45 | 23 | 3 |
| G2 | G2.5 | 0 | -1 | 11 | 6 | -7 |
| G2 | G2.6 | -1 | 1 | 2 | 1 | -13 |
| Subtotal | --- | --- | 74 | 38 | 4 | |
| G3 | G3.1 | 0 | 0 | 5 | 3 | -36 |
| G3 | G3.2 | 0 | -1 | 7 | 4 | -36 |
| G3 | G3.3 | -1 | 0 | 18 | 9 | -46 |
| G3 | G3.4 | -1 | -1 | 7 | 4 | -46 |
| Subtotal | --- | --- | 37 | 19 | -43 | |
| Total | 194 | 100 | 71 | |||
* The numbers represent the difference from the previous group: 1 = significant positive growth, 0 = non-significant growth, and -1 = significant negative growth; PIBA = percentage increase in basal area.
Subsequently, the individuals belonging to each group (G1, G2 and G3) were analyzed again for two five-year post-harvest periods (2004-2008 and 2009-2013), comparing them with the immediate previous period respectively. The growth behavior of individuals within each group was called subgroups. Statistically significant increasing values were characterized with the value of 1. In addition, there are individuals that did not show significant growth; that is, they presented constant growth before and after the analyzed periods and were characterized with 0. Finally, others presented negative growth; that is, their growth was significantly lower in the period analyzed compared to that of the previous period and were characterized as -1. The combination of growth trends (1, 0, -1) of individuals in each group in five-year period 1 (2004-2008) with five-year period 2 (2009-2013) yielded 14 subgroups (Table 3).
Table 3 Estimated parameters and linear regression statistics of the significant variables in the growth of Pinus residual trees, selected with the stepwise procedure.
| Variable | Estimated parameters (α) | Standard error | Pr > F |
|---|---|---|---|
| Intercept | 7.56019 | 1.24559 | <.0001 |
| Stump diameter (X1) | 0.00915 | 0.00257 | 0.0005 |
| Distance to stump (X2) | -0.03267 | 0.01567 | 0.03840 |
| Hegyi competition index (X3) | -0.18319 | 0.04653 | 0.0001 |
| Diameter at breast height (X4) | -0.01326 | 0.00338 | 0.0001 |
| Elevation (X5) | -0.00085381 | 0.00049929 | 0.0889 |
model: Ln_PIBA = α + α1x1 + α2x2 + α3x3 + α4x4 + α5x5 + ε. α = 0.05; adjusted R2 = 0.156.
There were five subgroups with a value of 1 in the first five-year period (three in the G1 group and two in the G2 one) representing 45.9 % (n = 89) of the total sample; six subgroups presented 0 in the first five-year post-harvest period and represent 40.2 % (n = 78) of the total sample; finally, only three subgroups showed a value of -1 and represent 13.29 % (n = 27) of the total sample (Table 2).
The growth of the four G1 subgroups is presented in Figure 2B. Subgroup G1.1 increased its growth in both five-year periods, although the pre-harvest growth was the lowest of all subgroups. Subgroup G1.2 has the highest number of individuals of the total number of samples with 26 % (Table 2) and presents a positive growth behavior in the first five-year period and not significant in the second one. In subgroup G1.3 there is a response to growth that lasts approximately four years, but in the fifth year it shows a reduction. Finally, subgroup G1.4 shows irregular growth, although constant in both five-year periods.
Subgroups included in group G2 are shown in Figure 2C. Group G2.4 represents 23 % of the total samples and is the one with the highest representation in group G2 (Table 2). Subgroups G2.1 and G2.2 increased their growth during the first four or five years after harvest and then the rate decreased. Subgroup G2.6, although composed of only two individuals, showed a significant decrease in growth in the first five-year post-harvest period, from which it does not recover until the sixth year. The rest of the growth subgroups showed a relatively stable growth trend before and after the intervention.
Group G3 subgroups are presented in Figure 2D; it can be seen that the general pattern of this set is a decrease in growth. Subgroup G3.2 increased growth in the first three years after the intervention, although it was not statistically significant (P > 0.05). On the other hand, subgroup G3.4 was differentiated from the rest by high IBA values in the pre-harvest period, which are lost in subsequent years until reaching similar values to the rest of the subgroups.
Variable selection and regression
Nine variables were used to perform the stepwise selection process in the SAS program; five of them were important to explain the growth response of residual trees, which were used to develop a multiple linear regression model (Table 3). The regression results showed that elevation is the only non-significant variable.
It can be seen that, although the multiple regression model provided results that allow discerning the influence of each variable on the PIBA, the percentage of total variability that this model explains is low (R2 = 0.16). Therefore, a graphic analysis of the most important variables in the general model was made individually.
Figure 3 presents the behavior of the PIBA logarithm with respect to the four most important variables to explain the growth response. The four graphs show the regression line of each of the variables (dotted line), the regression equation, the coefficient of determination (R2) and the zero growth line (PIBA = 0) that is located on the logarithm scale with a value of 4.605.
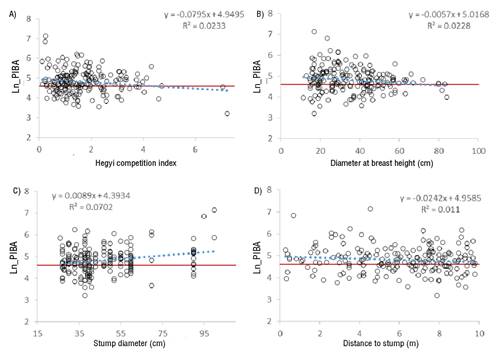
Figure 3 Linear regression of the most important variables in the growth response of the residual Pinus trees, after the selection cutting.
In this study, stump diameter was the most important variable to explain the growth response to the cutting (Figure 3C), followed by the Hegyi competition index (Figure 3A) and diameter at breast height (Figure 3B). In the case of the Hegyi index, the regression line intersects that of zero growth at a value of approximately 4.3, indicating that, at this level of competition, the residual trees no longer respond to release by selection cutting.
The relationship between Ln_PIBA and diameter at breast height of the trees shows a negative trend (Figure 3B). The regression line intersects the zero growth line at 72 cm, an average value after which the individual is unlikely to respond to the release of space derived from the cuttings made.
A positive relationship between Ln_PIBA and stump diameter is observed (Figure 3C); in this case, the regression line intersects zero growth at 23.7 cm, a diameter below which the growth space released by a cut specimen is unlikely to have a positive impact on the growth of residual trees.
The distance to the stump is negatively related to Ln_PIBA. The regression line does not intersect the zero growth value within the sampling radius established in the evaluation (10 m); however, it was possible to project the line with the parameters obtained and this intersection could be located at 14.6 m, which is interpreted as the limit distance in which the remaining trees are influenced by the cutting of a competing individual.
Variables at site level
The influence of site exposure on Ln_PIBA was significant (P = 0.014). The effect of SE exposure differs in the growth response (Ln_PIBA), as it was smaller than the rest of the exposures (Figure 4). In the case of the species, the test showed no significant variation in Ln_PIBA (P > 0.1854).
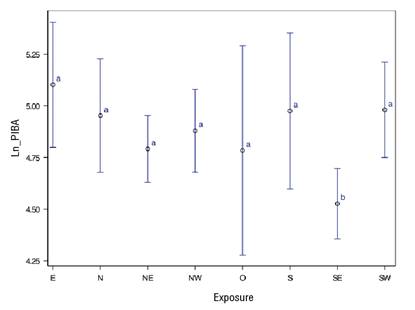
Figure 4 Percentage increase in basal area (Ln_PIBA) in Pinus species with respect to site exposure. Means with different letters indicate significant differences according to the Tukey-Kramer test (P ≤ 0.05).
Figure 5 shows that the decreasing trend of the Ln_PIBA as the slope value increases is notable. There is also a regression line (blue) and a zero growth reference value (red) on the logarithm scale, which do not intersect.
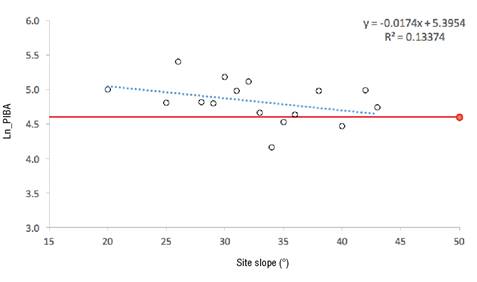
Figure 5 Logarithm regression of the percentage increase in basal area (Ln_PIBA) in Pinus species against average site slope values.
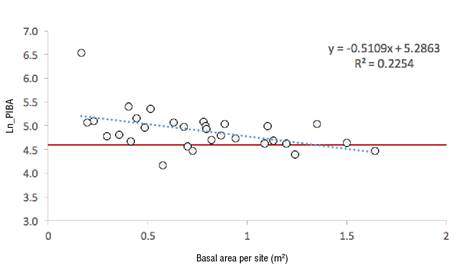
Figure 6 shows the logarithm of the PIBA as a function of the basal area of the site (sum of the basal area of each individual). The regression line intersects the zero growth value at 1.33 m2; after that value, the average site growth is nullified by the remaining competition. The average overall growth of the 30 sites is 71 %.
Discussion
Radial growth at individual tree level
There is a significant post-harvest growth response in 47 % of residual trees; the remaining 53 % shows non-significant growth, which does not necessarily imply that there is no response to treatment, but that in some subgroups such as G1.3 and G2.2, growth occurs in a limited period of only four to five years. This coincides with what was reported by Kang et al. (2014) in a thinning experiment in P. koraiensis Siebold & Zucc. in South Korea, where growth was observed in a period of three to five years after thinning. This suggests that individuals respond positively to the cutting for a limited time and that the effect is possibly terminated by the remaining competition at the site. On the other hand, subgroup G1.2 showed a positive effect on the growth of individuals during a period equal to or greater than 10 years after the intervention (Table 2); the same period was reported for Acer saccharum Marshall and Fagus grandifolia Ehrhart in Canada (Jones et al., 2009). The pre-harvest growth pattern of group G1, significantly lower than that of the other two groups, could be explained mainly by the competition, which implies that the suppressed trees have responded better to the release of space (Figure 2A). The same happened with subgroup G1.2, as the individuals had the lowest pre-harvest growth of the entire group and benefited most from the cuttings made. Although there is no record of similar research, stand-level studies have concluded that growth response is positively related to the intensity of the release (Espinosa et al., 1994; Kariuki, 2008), which coincides with what was found in this work.
The most important variables to explain the PIBA were stump diameter, competition and diameter at breast height. In this respect, Dolezâl, Ishii, Vetrova, Sumida, and Hara (2004) found that competition and size were the most important variables in the genera Betula and Larix. Competition is a factor of great importance for growth, as several authors have demonstrated (Das, 2012; King, Davies, Nur-Supardi, & Tan, 2005; Pedersen, Bollandsås, Gobakken, & Næsset, 2012; Sánchez-Salguero et al., 2015).
The size of the stump and the distance to it are variables that are related to the intensity of the competition exerted by the felled tree and that was exploited by the residual trees at the site. In Mexico, no studies with a methodology similar to the present work have been reported; however, some have evaluated growth as a function of competition and their results are comparable to those of this research, since in both cases areas of influence are determined from the competition of living and felled individuals. The 14.6-m radius of influence found in this study exceeds that reported in other studies with intervals of 5.5 to 6.5 m (von Oheimb et al., 2011), 6.7 to 8.5 m (Fraver et al., 2014) and 7 m in others (Looney et al., 2016). The difference in the results described may be due to the effect of the size (diameter and height) of the individuals evaluated; Fraver et al. (2014) do not provide precise data, although they report that the evaluated trees exceptionally exceed 20 m in height; von Oheimb et al. (2011) report 9.5 cm in diameter and 11.5 m in height, while Looney et al. (2016) report an average diameter of 22.2 ± 15 cm. These measures differ in the individuals evaluated in this study, which had a stump diameter of 48.4 ± 19.7 cm. It is possible that the radius of influence of competition obtained in this work differs from those obtained in the studies mentioned above, due to differences in tree height, as well as discrepancies attributable to the variables used (i.e. stump diameter at 0.3 m contrasted with diameter at breast height at 1.3 m in other works).
The result of the site’s elevation contrasts with the studies of Dang, Jiang, Zhang, and Zhang (2007) and Liu, Liang, Liu, and Camarero (2018), who did find that elevation influenced growth. The discrepancy with the present study can be attributed to the limited interval of evaluated data that has approximately 300 m of difference, against 1 950 and 700 m of altitudinal gradient in the referred studies.
Results by species vary in each study; some coincide with what was obtained in the present work (Das, 2012; Huang, Stadt, Dawson, & Comeau, 2013), while others report significant variations (King et al., 2005), which is possibly related to the physiology of the investigated species.
Site-level growth
The sites showed an average increase in growth of 71 %, which is similar to that reported by Forget et al. (2007), who obtained increases of between 45 and 50 % in stands with a 29 % thinning intensity. Although the increase data are comparable, the present study limits the PIBA to the area evaluated in the 30 sites and not at stand level.
A threshold of 1.3 m2 of residual basal area was identified as the site competition limit (41.3 m2·ha-1), after which the release of competition due to the effect of cutting has no influence on the growth of residual trees. Due to the lack of comparable studies, it is hypothesized that the remaining competition impedes the average development of the residual individuals.
The negative growth results in SE exposure contrast with those of Li et al. (2014), where the southern exposure does benefit it. The difference can be attributed to the latitudinal level, since at 29° N (cited study), solar radiation is received mainly in southern exposure and it is what generates better growth conditions; on the other hand, at 16° N (present study), solar radiation is received at N and S exposures depending on the time of year.
The negative linear relationship between site slope and tree growth (Figure 5) suggests that the site reaches zero growth at an approximately 45º slope. A similar study reported a weak negative parameter (i.e. with a probability value close to the established α value), resulting from the regression between the slope and the average radial growth of Quercus fabri Hance, although for Castanopsis fargesii Franch. it was not significant (von Oheimb et al., 2011). These results are consistent with those reported in the present study. The negative influence of slope on growth is possibly not due to physical condition, but to the edaphoclimatic conditions it generates, since it has been found that an increase in slope is related to a decrease in site quality (Wanshnong, Thakuria, Sangma, Ram, & Bora, 2013).
Conclusions
Only half of the residual trees increased their growth in response to selection cutting; individuals suppressed in pre-harvest benefited the most from space release. Competition was the most influential variable in growth, along with the size of the individual evaluated. This study presents data on trends, limits and thresholds that may be useful in making forest management decisions; for example, starting from the growth response threshold, stand management can be modulated according to water stress and expected climatic changes. The methodology was useful to evaluate the effect of selection cutting, although it is possible to implement improvements in the selection criteria of competing trees and in the choice of competition indices. It is also necessary to establish permanent sampling plots to draw more solid conclusions on the effects of thinning and cutting in the analyzed stands.

