


 text in
  English (pdf)
 Article in xml format
 Article references
 Send this article by e-mail
 Cited by SciELO
  Similars in
SciELO
Similars in
SciELO 
 Permalink
Introduction
According to global projections, by 2050 the proportion of people living in urban areas is expected to be 69.6 % (United Nations, Department of Economic and Social Affairs, Population Division, 2019); that is, two out of three people will live in cities (Marans, 2015). This will bring with it, among other things, an increasing demand for recreational services, such as those for leisure, sports health, and scenic beauty in urban environments (Maas, van Dillen, Verheij, & Groenewegen, 2009; Marans, 2015). However, the provision of green spaces (the source of these recreational services) will not be easy due to limited spaces, budgetary constraints, government policies, and other environmental factors. The availability of sufficient and good quality areas is also restricted by social factors, such as society’s participation in their care and maintenance (Maas et al., 2009).
The relationship between green spaces and the inhabitants' quality of life has been investigated mainly in developed countries (Haslauer, Delmelle, Keul, Blaschke, & Prinz, 2015; Kweon, Marans, & Yi, 2016; Marans, 2015). For the purpose of this study, quality of life is defined as the state of integral satisfaction that is formed when people fulfil their potentialities, which can be subjective (i.e., intimacy and emotional expression) and objective (i.e., wellbeing and health). The integral satisfaction also depends on employment, level of education, income, safety, and other environmental factors (Ardila, 2003). These studies agree that more green spaces generate better health and a lower risk of mortality (Maas, Verheij, Groenewegen, de Vries, & Spreeuwenberg, 2006; Mitchell & Popham, 2007; van den Berg, Maas, Verheij, & Groenewegen, 2010). A sense of belonging is defined as a person's satisfaction at being part of a community (Hombrados-Mendieta & López-Espigares, 2014; Maas et al., 2009). The sense of belonging, also called sense of community, positively influences quality of life and residential satisfaction. It induces greater participation by inhabitants, integration into the interests of the community (by setting certain goals and fulfilling them), and increased awareness of inclusion to solve common problems (Gracia & Herrero, 2006; Hombrados-Mendieta & López-Espigares, 2014).
Climate, human and economic resources, and access to water are factors that significantly affect the proper management of green spaces (de la Barrera, Reyes-Paecke, & Banzhaf, 2016). In this work, an evaluation scheme is proposed that can be useful for determining mechanisms for the management and conservation of green spaces, according to the quality of life and the sense of belonging of the population. The study is particularly important for cities with rapid population growth, with limited resources, and where society is crucial for the care and maintenance of green spaces. One of these cities is Durango, located in the state of the same name, where the management of its green spaces has been a great challenge for the public administration, due to the city’s semi-arid conditions and scarce economic resources. In 2006, the city had 155 spaces catalogued as green spaces, of which 16 were boulevards, four continuous flows, and 135 common-use areas. Currently, 60 % of these spaces have adequate infrastructure for their use, 30 % have deteriorated conditions (few trees), and the remaining 10 % have practically no vegetation. The green spaces of this city provide several ecosystem services including fruits, ornamental plants, and firewood. They also serve as regulatory areas for temperature, humidity, carbon sequestration, noise attenuation, and air purification issues; and finally, they provide cultural services like social integration, scenic beauty, and recreation, which eventually favor opportunities that contribute positively to physical and mental health. However, there is no information on how these spaces have influenced the quality of life or if society is actively involved in their care. In this context, the objectives of this study were to estimate the density of green spaces per inhabitant in the city of Durango, Dgo. and analyze the relationship that exists between green spaces, quality of life, and sense of belonging.
Materials and methods
Study area
The city of Durango is located in the central-southern part of the state of Durango (24° 01’ 05’’ N and 104° 39’ 19’’ W), at 1 880 m of elevation. According to data from INEGI (Instituto Nacional de Estadística y Geografía, 2016), the city’s population in 2016 was estimated at 573 000. The climate is semi-dry temperate with little rainfall in summer and semi-dry sub-humid in winter, with an average annual temperature of 17 °C (Romero-Pérez, Rodríguez-Muñoz, Alpuche-Cruz, & Martín-Domínguez, 2017). Precipitation occurs mostly from June to September (occasionally in December and January) with an annual average of 529 mm. As a result of the low rainfall, much of the water required to sustain the green spaces is obtained from groundwater sources or treated waters, thus contributing to the shortage of water for domestic uses. The study focused on this city, due to the lack of information on the current conditions of its green spaces. Also, it is important to contribute to society and government authorities regarding awareness and management of these sources of ecosystem services in urban areas.
Detection and quantification of green spaces
Green spaces were detected and quantified in two ways. Firstly, a shape file type of the city boundary (generated by INEGI) and the Google Earth® package were used to update the polygons of public green spaces within the urban zone. This information was compared with a list of green spaces, provided by the municipality, which included their name and address. With these information sources and the Quantum GIS, the polygons (perimeters and vertices) were updated and their area (A) estimated. Information from the basic geostatistical areas of the 2010 INEGI Population and Housing Census was also used to estimate the population (P) and the density of green spaces per inhabitant, which is the result of dividing P/A.
Secondly, a high-resolution multispectral image with blue, green, red, and infrared-reflective bands (with a 2 m spatial resolution) was used to estimate private green areas and refine information from public areas. The multispectral information was complemented with a panchromatic image with 0.5 m resolution, taken on August 30, 2015 by the Quickbird satellite through DigitalGlobe™. The multispectral image was processed to determine the normalized difference vegetation index (NDVI), which relates to the presence of vegetation in an area. The NDVI varies from -1 to +1, where the negative limit corresponds to soils with no apparent vegetation and bodies of water. The positive limit corresponds to areas with dense and healthy vegetation or with high photosynthetic activity (Heute et al., 2002). The index assumes that chlorophyll absorbs red (R) light, while the mesophilic part of the leaves reflects infrared (IR) rays. This index is given by the expression NDVI = (IR-R) / (IR+R) (Chuvieco, 2010). By means of a pixel reclassification, the NDVI values were grouped and the area of green spaces and the density of green spaces (DGS) were estimated.
The DGS was estimated by vector analysis and in raster format to ratify and confirm the green space polygons made by INEGI. Given the origin and processing of the base information, the DGS estimation from the raster format was more precise than the vector analysis. In principle, many green spaces included in private properties were not registered in the INEGI database. In addition, some polygons in this format were incomplete or poorly located, so they were corrected and updated with direct visits and Google Earth® images. The inclusion of green spaces in private lots does not contribute equally to the provision of ecosystem services, but their information is necessary. Some of the benefits are for the exclusive use of the owners (such as the provision of fruits, shade, and recreation) and they themselves pay for their maintenance; however, other indirect services such as climate regulation, wildlife habitats, and oxygen production benefit the entire population.
Evaluation of the relationship between green areas, quality of life, and sense of belonging
The theoretical basis of this study was a model for assessing the relationship of the sense of belonging (SB) and the quality of life (QL) with the DGS. Taking up the concepts of Francis, Giles-Corti, Wood, and Knuiman (2012) and Marans (2015), the QL and SB are influenced by individual, social, and environmental factors (Figure 1). Individual factors include income, level of education, and psychological aspects, among others; social factors relate to safety, accessibility, comfort, convenience, laws, and policies; and environmental factors include vegetation, climate, topography, and air quality (Francis et al., 2012; Sallis et al., 2006). This conceptual model was evaluated through residents’ perceptions, identification and measurement of explanatory variables, and statistical analyses between factors and green spaces.

Figure 1 Conceptual model of the relations between quality of life, sense of belonging, and density of green spaces. The dotted line means that there may be an inverse relationship. Model based on Sallis et al. (2006), Francis et al. (2012), and Marans (2015).
Sampling design
A questionnaire was used to determine the perception of the inhabitants of the city of Durango concerning QL, SB, and green spaces. The survey was conducted in 114,290 households. The sample size considered a 95 % confidence level and 10 % error. Using the proportion equation (Rea & Parker, 2014), we estimated a sample size of 96 households that were distributed in several settlements where green spaces existed. In each zone, defined by the density-marginalization combination, up to three green spaces were chosen at random and the participating households were randomly selected. The survey was conducted in the summer-autumn period of 2015. In each household a person (over 18 years old) was invited to participate in the interviews; if he or she refused, then another person from the adjacent house was invited.
The survey included 27 subjective and objective questions that seek to elicit people's opinions; some were based on the 5-point Likert format (Rea & Parker, 2014). The QL questions were compared with those used by the Organization for Economic Cooperation and Development (OECD, 2015); some were accepted and others were discarded due to their macroeconomic application (such as the level of participation in political democracy) or the lack of relationship with green spaces. Some of the questions asked in the survey were: how much peace of mind and security do you feel in the environment where you live? How much of a sense of well-being do you receive from the sight and cleanliness of your area? How much satisfaction do you feel from living at your home? Other questions were linked to the sense of belonging or community, which were related to solidarity, volunteering, permanence, and neighborhood relations (Maya-Jariego, 2004). The questions also included sociodemographic variables, such as income, gender, and level of education, and other physical variables like distance from their home to the nearest green space (Table 1).
Table 1 Descriptive statistics of the survey applied to residents (n = 96) of the city of Durango, Dgo.
| Variable | Min | Max | Average | SD | Asymmetry | Kurtosis |
|---|---|---|---|---|---|---|
| Appreciation of birds and other animalsa | 1 | 5 | 4.07 | 0.95 | -0.96 | 0.78 |
| Appreciation of gardens, flowers, and naturea | 1 | 5 | 4.24 | 0.78 | -0.99 | 1.70 |
| Green space qualitya | 1 | 5 | 3.65 | 1.20 | -0.68 | -0.38 |
| Trust in peoplea | 1 | 5 | 3.71 | 1.18 | -0.83 | -0.04 |
| Willingness to work (h·month-1)b | 1 | 5 | 2.61 | 1.22 | 0.39 | -0.66 |
| Distance from green space (m)b | 1 | 3 | 1.68 | 0.75 | 0.61 | -0.96 |
| Studies completedb | 1 | 5 | 3.17 | 1.13 | -0.16 | -0.97 |
| Ease of activitiesa | 1 | 5 | 3.14 | 1.39 | -0.10 | -1.22 |
| Physical factorsa | 1 | 5 | 3.58 | 1.29 | -0.72 | -0.59 |
| Happinessa | 1 | 5 | 4.2 | 1.02 | -1.49 | 2.13 |
| Frequencyb | 1 | 5 | 2.67 | 1.17 | 0.08 | -1.06 |
| Sight and cleanlinessa | 1 | 5 | 3.34 | 1.23 | -0.31 | -0.78 |
| Monthly incomeb | 1 | 5 | 2.58 | 1.21 | -0.12 | -1.42 |
| Participation and supporta | 1 | 5 | 3.26 | 1.25 | -0.38 | -0.90 |
| Permanencea | 1 | 5 | 3.77 | 1.14 | -1.07 | 0.53 |
| Neighborhood relationsa | 1 | 5 | 3.56 | 1.29 | -0.64 | -0.65 |
| Satisfactiona | 1 | 5 | 4.32 | 0.97 | -1.47 | 1.79 |
| Genderb | 1 | 2 | 1.53 | 0.50 | -0.13 | -2.02 |
| Solidaritya | 1 | 5 | 3.3 | 1.16 | -0.29 | -0.75 |
| Green space density (m2·inhabitant-1)c | 0.7 | 27.1 | 9.91 | 8.93 | 0.91 | -0.57 |
| Time (h)b | 0 | 5 | 1.72 | 1.25 | 0.55 | -0.12 |
| Peace of mind and securitya | 1 | 5 | 3.76 | 1.18 | -0.56 | -0.66 |
| Volunteeringa | 1 | 5 | 2.82 | 1.49 | 0.12 | -1.40 |
Source: Author-made. The table includes variables in Likerta, ordinalb and continuousc formats. The minimums and maximums denote the measurement scale. SD: Standard deviation of the mean.
Most respondents live close to green spaces (less than 300 m), visit them occasionally (once a week), and stay there for less than an hour. There is a slight difference in the gender portion with women making up 47 % of the respondents and men 53 %, most having completed high school. The most common monthly income ranges from MXN 6 000 to 9 000 (300 to 450 USD). In parametric terms, of all variables, "happiness" exhibited certain non-normality problems (asymmetry = -1.5 and kurtosis = 2.1), but no transformation was made.
Statistical analysis
A principal component analysis was performed to reduce the number of variables that could explain the QL and SB. Once the statistical fit parameters were obtained, the set of variables were used to estimate the factorial scores (regression type) and associate them with the DGS. The reason for using DGS as the main indicator was basically because the larger the area, the greater the contribution of cultural and regulatory services. The larger the area, the greater the magnitude and diversity of ecosystem services (de la Barrera et al., 2016). Three working hypotheses were put forward in this analysis:
i). The first model evaluated the relationship between the DGS and QL by the expression DGS = f (QL) or specifically DGS = β 0 + β 1(QL) + ε. The hypothesis was as follows: QL has no influence on the DGS (β 1 = 0).
ii) . The second model evaluated the effect of the DGS on the SB: SB = f (QL) or SB = β 0 + β 1(QL) + ε. The hypothesis was: OL has no influence on the DGS (β 1 = 0).
iii) . The third and last model evaluated the combined effect of SB and QL on the DGS: DGS = f (QL, SB) or DGS = β 0 + β 1(QL) + β 2(SB) + β 3(QL*SB) + ε. In this case, the null hypothesis was that SB, QL, and the SB*QL interaction have no influence on the DGS (β i ≥ 1 = 0).
The reason for establishing the first hypothesis was partially based on the principle of the environmental Kuznets curve, which stipulates that an economically developed and organized society has the resources and the physical and social availability to improve the quality and quantity of natural resources (Chen & Wang, 2013). In general, income is represented as the independent variable, while resource conservation is the dependent one. This hypothesis is congruent with other studies that have evaluated the association between green spaces and quality of life (Maas et al., 2006; Mitchell & Popham, 2007; van den Berg et al., 2010). In the second hypothesis, it was assumed that certain physical characteristics of green spaces, such as easy access, plant diversity, and security, influence the SB (Francis et al., 2012; Karacor & Senik, 2016); however, since there are doubts in the direction of causality (Francis et al., 2012), model 2 was also tested inversely. Finally, the idea of using the QL and SB in model 3 was to observe their effect on the DGS, individually and combined. In this model, the SB functions as a predictor because of the strong association it has with the QL. Hombrados-Mendieta and López-Espigares (2014) indicate that the SB positively influences quality of life and residential satisfaction, and that it is possible that the combination has some influence on the DGS.
In order to simplify the details in the interpretation of the results, the models were fitted linearly and without transformations of the variables. This process was also motivated by the normality exhibited by most of the variables (Table 1). It was also assumed that the green spaces are already created and that their care and maintenance is a shared responsibility between the public administration (mostly) and the residents.
Results and discussion
In total, 229 green space polygons were located in the urban area of the city of Durango, Dgo. The most important vegetation in these areas was trees (45 %), mainly conifers (Pinus spp., Taxodium mucronatum Ten., Cupressus lusitánica Mill., and Pseudotsuga menziesii [Mirb.] Franco) and broadleaves (Eucalyptus spp., Populus tremuloides Michx., Fraxinus uhdei [Wenz.] Lingelsh., Casuarina equisetifolia L., and Liquidambar styraciflua L.), grasses (32 %), herbaceous plants (16 %), and shrubs (7 %). The quantified area of public green spaces was 2.1 million m2. This amount yields an average density of 3.67 m2 per inhabitant. The total area of green spaces, including private ones, was 2.9 million m2 with a density of 5.06 m2 per inhabitant. With the field visits, it was observed that approximately 30 % of the green space area is in bad condition and with signs of deterioration. Considering this, the densities mentioned above would be reduced to 2.6 m2 and 3.5 m2 per inhabitant, respectively.
In the principal component analysis, the number of factors was restricted to two to try to group the variables that explain the SB and the QL. In this case, the total variance explained was 42 % and was significant (P < 0.01) according to Bartlett's test of sphericity. Table 2 indicates that the most important variables in factor 1 were: neighborhood relations, permanence, trust in people, solidarity, physical factors, frequency, and satisfaction. This factor was called sense of belonging. The most important variables in factor 2 were: image and cleanliness, ease of activities, appreciation of gardens and animals, monthly income, peace of mind and security, and quality of green space. This factor was identified as quality of life. Once the factors were identified, Cronbach's alpha coefficient (Cronbach, 1951) was used to estimate reliability. The variables in factor 1 (sense of belonging) had a coefficient of 0.81, while that of factor 2 (quality of life) was 0.78. These factors were considered acceptable and reliable based on what was pointed out by Nunnally and Bernstein (1994), who analysed the reliability of the instruments used in the measurement.
Table 2 Factors of principal components analysis with varimax rotation of residents’ perceptions in the city of Durango, Mexico.
| Variables | Average | Factor 1 Sense of belonging | Factor 2 Quality of life | Communality |
|---|---|---|---|---|
| Neighborhood relations | 3.5 | 0.70 | 0.15 | 0.51 |
| Permanence | 3.8 | 0.70 | -0.03 | 0.49 |
| Trust in people | 3.7 | 0.66 | 0.18 | 0.46 |
| Solidarity | 3.3 | 0.62 | 0.24 | 0.44 |
| Physical factors | 3.6 | 0.59 | 0.04 | 0.35 |
| Frequency | 2.7 | 0.55 | 0.00 | 0.31 |
| Satisfaction | 4.3 | 0.53 | 0.42 | 0.46 |
| Happiness | 4.2 | 0.51 | 0.37 | 0.40 |
| Time | 1.7 | 0.51 | 0.16 | 0.28 |
| Sight and cleanliness | 3.3 | 0.30 | 0.70 | 0.58 |
| Ease of activities | 3.1 | 0.18 | 0.66 | 0.47 |
| Appreciation of gardens, flowers, and nature | 4.2 | -0.04 | 0.65 | 0.43 |
| Appreciation of birds and other animals | 4.0 | -0.01 | 0.63 | 0.39 |
| Monthly income | 2.6 | -0.04 | 0.62 | 0.38 |
| Peace of mind and security | 3.7 | 0.45 | 0.54 | 0.49 |
| Green space quality | 3.6 | 0.42 | 0.49 | 0.41 |
| Participation and support | 3.2 | 0.39 | 0.48 | 0.38 |
| Studies completed | 3.2 | 0.00 | 0.47 | 0.22 |
| Volunteering | 2.8 | 0.24 | 0.34 | 0.17 |
| Willingness to pay | 2.7 | 0.22 | 0.29 | 0.13 |
| Percentage of variation | 24.5 | 17.3 | ||
| Cronbach’s coefficient | 0.81 | 0.78 |
Note: Kaiser-Meyer-Olkin coefficient = 0.73; Barlett's Test of Sphericity: χ2 = 865.7, P < 0.01. Source: Author-made.
The factors were used to calculate the factorial scores (regression values) for each respondent. In this case, the observed variables were modeled as linear combinations of factors plus error expressions, where each factor was in turn represented as another latent variable. Latent variables reduce the dimensionality of the dataset while maintaining as much information as possible (Lloret-Segura, Ferreres-Traver, Hernández-Baeza, & Tomás-Marco, 2014). The factorial scores of the participants help find out which subjects are the rarest or most extreme (atypical cases). They also help to carry out hypothesis tests on the influence of each factor on a given variable (Lloret-Segura et al., 2014). Factorial scores were used to assess the relationship between the sense of belonging (SB) and quality of life (QL) factors on the density of green spaces (DGS).
Once the factorial scores were calculated, a generalized linear model was applied to determine whether the averages of the variables, as a whole, were different. This type of model allows the dependent variable to follow not only a normal distribution, but also other distributions such as Gamma, Poisson, or Binomial. The calculations were made using the least squares regression approach describing the statistical relationship between the predictors and the continuous response variable. The accepted significance level was 95 %. Based on this, the results indicate that the relationship between QL and the DGS is positive and significant (β 1 = 2.62, P < 0.01); that is, the higher the quality of life, the greater the density of green spaces. The relationship between DGS and SB is also positive, but not significant (β 1 = 0.02, P = 0.06), as is the inverse relationship (β 1 = 1.72, P = 0.06). Finally, the relationship between the combined effect of SB and QL on DGS is not significant (β 3 = 0.31, P = 0.68). In the latter model, the independent effect of SB and QL is positive and significant (Figure 2).
The DGS had no influence on the variables representing the SB factor, such as solidarity and trust of people, neighborhood relations, and permanence. This result coincides with Zhang and Lawson (2009), who found no relationship between the size of green spaces and the social interaction of people, and suggest that the SB is instead related to the quality of public spaces. Francis et al. (2012) found similar results, although they recommend more research to determine causation. This study hypothesized that communities would have a higher SB if there were more green spaces. However, after testing the inverted model (that is, regardless of the sense of causality), no evidence of a significant relationship was found (P = 0.06).
The results also show that there is no evidence of a significant relationship between the combined effect of SB and QL on DGS (P = 0.68). This should not be understood as a generalized conclusion due to, among other things, the variables that have been considered and the methods used to evaluate them; however, it is believed that both factors, separately and in a combined manner, should have an influence on the quantity and quality of green spaces and that this relationship should be further studied in future research.

Figure 2 Regression analysis between density of green spaces (DGS), quality of life (QL), and sense of belonging (SB). The numbers correspond to the regression coefficients and standard error (in parentheses). The dotted line represents the inverted model 2. *Significant at 90 %, **significant at 95 %, and ***significant at 99 %. The accepted significance level was 95 %. Source: Author-made.
Green spaces offer many ecosystem services ranging from noise reduction, climate regulation, recreation, and wildlife habitats to providing cultural, spiritual, and health benefits (van den Berg et al., 2010); however, there is some controversy about the minimum amount of green space a human being requires for his or her well-being. This amount depends on personal characteristics and the physical environment (Lee & Maheswaran, 2011), which makes it inconsistent around the world (Table 3). For example, the figures in Europe range from 6 to 50 m2 per inhabitant (Cvejić et al., 2015; Kabisch, Strohbach, Haase, & Kronenberg, 2016); Singapore, despite its high population density, has one of the largest rates in the world with about 65 m2 per inhabitant; Mexico City has about 13 m2 per inhabitant (Checa-Artasu, 2016); in South America, the density varies between 1 and 9 m2 per inhabitant; and in North America, the area ranges from 5 to 100 m2 per inhabitant (Choumert & Salanié, 2008; de la Barrera et al., 2016).
Table 3 Comparison of the density of green spaces in various cities around the world.
| City parameters | Berlín, Germanya | Malmö, Swedena | Edinburgh, Scotlanda | Mexico Cityb | Parral, Chilec | Durango, Mexicod |
|---|---|---|---|---|---|---|
| Total area (ha) | 89 042 | 15 309 | 26 218 | 149 500 | 582 | 9 431 |
| Green spaces (ha) | 5 727 | 1 029 | 1 515 | 11 289 | 18 | 210 |
| 2013 population (inhabitants) | 3 502 000 | 313 000 | 483 000 | 8 851 000 | 38 000 | 572 782 |
| Density (m2·inhabitant) | 16.35 | 32.86 | 31.39 | 12.7 | 4.82 | 3.67 |
| Density percentage over the recommended minimum | 1.82 | 3.65 | 3.48 | 1.42 | 0.53 | 0.40 |
Source: aCvejić et al. (2015), bCheca-Artasu (2016), cMena, Ormazábal, Morales, Santelices, and Gajardo (2011) and down information. The percentages are based on the studies by Checa-Artasu (2016) and Barrera et al. (2016) on the minimum value of 9 m2.
There are previous studies (Checa-Artasu, 2016; de la Barrera et al., 2016) with reference to the World Health Organization, which suggest a conservative range of between 9 and 12 m2 per inhabitant to provide the most fundamental ecosystem services to society. Considering this range, the DGS in the city of Durango covers 40 % of the minimum recommendation (or 56 % adding private areas). There are many factors that can explain this difference and several of them are beyond the scope of this research, but an important factor to highlight is the low natural availability of water caused by low rainfall. This factor, together with others such as current land use and the use of obsolete irrigation systems, limits the supply of water to vegetation and, eventually, the development of more green spaces. In view of the above, other alternatives such as the possibility of establishing vertical gardens and the use of native species that do not require much water should be explored (Lindholm, 2017). Municipal authorities can also exercise greater control over the establishment of new residential and commercial developments in exchange for establishing more green spaces.
The results of this research indicate that the higher the DGS, the higher the QL. This is consistent with other studies showing that society first tries to meet its primary needs and subsequently allocates resources to other objectives, including the care and maintenance of green spaces (Chen & Wang, 2013; Kweon et al., 2016). In this research it was noticeable that the best and largest green spaces were generally located in subdivisions with low marginalization and high incomes that occupy 5 % of the city (Figure 3). A typical case is the Campestre neighborhood located in the south of the city, where the average income of its inhabitants is one of the highest in the city and the density of green spaces is 25 m2 per inhabitant.
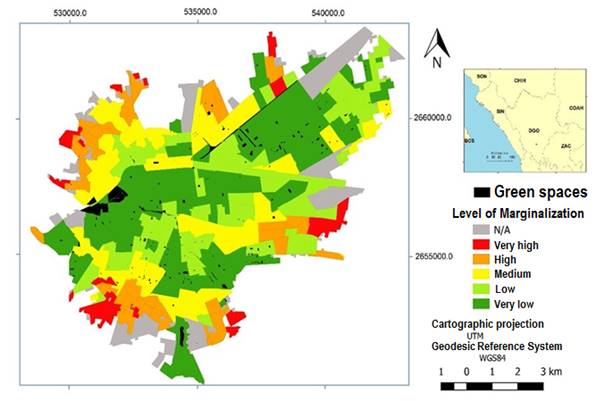
Figure 3 Location of green spaces and levels of marginalization in the city of Durango, Mexico (Source: Consejo Nacional de Población [CONAPO], 2019 and own information).
Evidence from previous studies, including this one, suggests that the amount of green space in a community depends heavily on the quality of life of its residents. One of the major limitations of the present study is its static approach. The frequency of visits to green spaces and their duration can substantially influence the conservation and management of such areas. Therefore, it is necessary to apply this type of study in longitudinal or panel evaluations to observe the dynamics of the perceptions and socio-demographic characteristics of the population.
Conclusions
The density of green spaces in the city of Durango is 3.67 m2 per inhabitant, less than the 9 m2 per inhabitant recommended by other studies. The higher the density of green spaces, the higher the quality of life. Contrary to the hypothesis, there was no evidence of association between the density of green spaces and the sense of belonging; the relationship is positive, but not significant. Nor was there a significant relationship of the combined effect of quality of life and sense of belonging with the density of green spaces. This suggests the need for greater attention in the areas of higher marginalization, in which fewer green spaces were observed. It is also necessary to increase the density of green spaces per inhabitant, especially in new residential developments.

