


 text in
  English (pdf)
 Article in xml format
 Article references
 Send this article by e-mail
 Cited by SciELO
  Similars in
SciELO
Similars in
SciELO 
 Permalink
Introduction
Urban dust is a mixture of physical, chemical and biological materials caused by natural processes such as volcanic activity, soil erosion, forest fires (Chen, Lu, Li, Gao, & Chang, 2014; Luo, Yu, Zhu, & Li, 2012) and anthropic processes such as industrial ones (Liu, Liu, Yin, Zhang, & Zhang, 2014), vehicular traffic (Aguilar et al., 2013; Cortés et al., 2017; Peña-García, Maciel-Flores, Rosas-Elguera, & Rentería-Tapia, 2016; Sánchez-Duque et al., 2015; Zafra, Temprano, & Tejero, 2011), garbage and weathering of buildings (García-Rico et al., 2016).
The size of urban dust particles varies from very coarse fractions the size of sand to inhalable particles called PM0.1, PM2.5 and PM10 ranging in size between 0.1 and 10 µm. Urban dust often contains heavy metals (HMs), such as Pb, V, Cr, Cu and Zn; inhaling them poses a high health risk (Luo et al., 2012; Sabath & Robles-Osorio, 2012). The World Health Organization has stated that, annually, about 7 million people die from air pollution and diseases related to environmental pollution (World Health Organization [WHO], 2014).
HM in urban dust are measured using costly, time-consuming chemical analysis techniques that generate hazardous waste, which is why proxy analysis techniques have been developed that are economical, fast and non-polluting. One of these proxy techniques is the use of color as an indicator of urban dust contaminated by HMs, which has been successfully tested in the city of Ensenada, Mexico (Cortés, Bautista, Quintana, Aguilar, & Goguichaishvili, 2015) and Murcia, Spain (Marín et al., 2018).
In recent years, equipment has been designed to measure color (reflectance and light transmission) in solid samples, and optical color systems such as the CIE-L*a*b*, CIE-RGB, and Munsell ones (Vodyanitskii & Savichev, 2017), which provide useful quantitative parameters for calculating color indices (chroma, saturation and redness). With the color parameters and indices it has been possible to establish mathematical relationships with the concentrations of HM in urban dust (Cortés et al., 2015; Marín et al., 2018).
The objective of the present study was to assess the color of urban dust as an indicator of HM pollution in Mexico City.
Materials and methods
Mexico City (CDMX) covers an area of 1 485 km2 and is located at 2 240 masl. The city is surrounded by volcanic mountains that impede the passage of the wind, causing atmospheric pollutants not to disperse easily. CDMX is home to 8.9 million people and has a population density of 5 966 inhabitants·km-2, 4 million vehicles and 40 000 small and medium-sized industries that influence environmental pollution.
Urban dust sampling and analysis
Urban dust samples were taken at 455 sites. The dust sample was collected in the street, on the sidewalks, in 1 m2 areas. Stones, leaves and branches were separated and the dust was collected using a brush and plastic dustpan to avoid contamination by metal particles. Samples were deposited in polyethylene bags, labeled and georeferenced. Subsequently, the urban dust samples were dried in the shade and screened with a 250-µ mesh.
The urban dust was subjected to acid digestion according to U.S. EPA method 3051A (United States Environmental Protection Agency, 2007a). For this, a 0.4-g urban dust subsample was digested with 20 mL of concentrated HNO3. In the heating program, the temperature of each sample increased to 175 ± 5 °C during approximately 5 min and was maintained for 4.5 min. The extract was filtered using Whatman No. 42 paper, transferred to a 50-mL flask and then flushed to volume with type A distilled water. Quality control for the acid digestion method included reagent or control blanks and duplicate samples. The quality assurance and quality control (QA/QC) results showed no signs of contamination or losses in the analyses.
The digested urban dust samples were analyzed with an ICP-OES spectrometer (Agilent Technologies 5100) in accordance with U.S. EPA Method 6010C (2007b). The calibration curve was developed with multi-element QCS-26R solutions (high purity). The HM analyses were carried out at the National Autonomous University of Mexico’s Environmental Biogeochemistry Laboratory.
The detection and quantification limits of the analyzed elements (mg·L-1) were Ba (0.02 and 0.06), Cr (0.01 and 0.04), Cu (0.01 and 0.02), Mn (0.04 and 0.12), Ni (0.01 and 0.05), Pb (0.03 and 0.12), V (0.01 and 0.05) and Zn (0.02 and 0.10). The limits refer to the minimum concentration that the method detected and reliably quantified.
Urban dust color was measured with a Konica Minolta Cr-5 colorimeter (Japan); color parameters L, a, b were determined by the CIE-L*a*b* system and the parameters X, Y, Z from the CIE-XYZ system. With the color parameters of the CIE-L*a*b* system, the redness index (RILab) (Vodyanitskii & Savichev, 2017) was determined using the following equation:
The CIE-RGB system is based on the sum of the primary colors, namely R (red), G (green) and B (blue), according to the tristimulus theory. This system has a larger number of indices that enable describing the properties of the sample, such as the redness index (RI), hue index (HI) and saturation index (SI). For the use of this system, it was necessary to transform the CIE-XYZ color parameters to the CIE-RGB ones (Cortés et al., 2015).
For the CIE-XYZ transformation, parameters X, Y and Z were scaled between 0 and 1, and then the 3 x 3 square matrix was used for the standard illuminant D65 with 2° observation angle (Viscarra-Rossel, Fouad, & Walter, 2008):
The HI, SI and RI indices were calculated using the RGB parameters (Cortés et al, 2015; Levin, Ben-Dor, & Singer, 2005; Mathieu, Poujet, Cervelle, & Escafal, 1998), from the following equations:
The HI records the primary colors red, green, and blue, and the SI records neutral colors such as gray (Mathieu et al., 1998). These indices are the result of simplifying the saturation and hue equations (Liu & Moore, 1990). The RI provides the hematite content and an approximation of soil redness.
Relationship between color and heavy metals
The urban dust samples were grouped using the SI and RI color indices and cluster analysis, due to the opaque and dark tones observed with the naked eye in the urban dust (between grays and blacks) samples. The HI was not used because it is an index susceptible to primary colors, which were not presented in the urban dust of Mexico City. The color name of each group was identified with the Munsell tables (Munsell Color Laboratory, 2000).
The relationship between urban dust color by RI and SI (dependent variables) and HMs such as Ba, Cr, Cu, Pb, Mn, Ni, V and Zn (independent variables) was analyzed by means of a multiple linear regression adjustment from the following equation:
where,
Ind Col |
dependent variable (color index) |
X n |
independent variables (HM) |
|
number of parameters to find |
|
random prediction error |
R2 levels were considered low (R2 < 0.5), moderate (0.5 < R2 < 0.7), high (0.7 < R2 < 0.9) and very high (R2 > 0.9), with a significance of 95 % and P < 0.05.
In order to identify the most contaminated color groups, the Kruskal-Wallis test (1952) was performed for each MP, considering statistically significant differences with P < 0.05. Subsequently, Dunn's (1964) multiple comparison test was performed to identify the statistically different groups.
Results
Formation of groups by color
Six urban dust groups were formed per color with cluster analysis; each group had a characteristic color ranging from dark grayish brown to black. The number of samples varied in the six groups: group I with 73, group II with 110, group III with 70, group IV with 45, group V with 148 and group VI only with nine (Table 1).
Table 1 Groups of urban dust samples by color named according to Munsell tables.
| Groups | |||||||
|---|---|---|---|---|---|---|---|
| I | II | III | IV | V | VI | Total | |
| Samples | 73 | 110 | 70 | 45 | 148 | 9 | 455 |
| Proportion (%) | 16 | 24.18 | 15.4 | 9.9 | 32.5 | 2 | 100 |
| Color |
 Dark
grayish brown Dark
grayish brown |
 Dark
gray Dark
gray |
 Dark
olive brown Dark
olive brown |
 Very
dark gray Very
dark gray |
 Very
dark grayish brown Very
dark grayish brown |
 Black Black |
|
| L* | 47.2752 | 39.9656 | 33.9493 | 31.7658 | 36.3179 | 27.6044 | |
| a* | 1.5060 | 1.6528 | 1.8251 | 1.9202 | 1.6222 | 1.9278 | |
| b* | 10.2659 | 9.1964 | 8.7871 | 8.6833 | 8.8993 | 7.7733 | |
Relationship between urban dust sample groups by color and heavy metals
The relationship between RILab and HM concentrations was high and significant (R2 = 0.7) in groups I, III and IV, and low but significant (P < 0.05) in groups II (R2 = 0.5) and V (R2 = 0.3). In group VI, the relationship was high (R2 = 1) but not significant, due to the low number of samples that forced the value of R2 (Table 2).
Table 2 Multiple linear regression of heavy metals (Cr, Cu, Ba, Pb, Mn, Ni, Zn and V) with the redness index (RILab) in the urban dust of each color group.
| Groups | Color | IRLab | R2 |
|---|---|---|---|
| I | Dark grayish brown |
|
0.7* |
| II | Dark gray |
|
0.5* |
| III | Dark olive brown |
|
0.7* |
| IV | Very dark gray |
|
0.7* |
| V | Very dark grayish brown |
|
0.3* |
| VI | Black |
|
1.0 |
* Significant regression (P < 0.05)
The analysis by multiple linear adjustment between the SI and the HMs showed a high, positive and significant multiple correlation in groups I, II, III and IV, and a low but significant correlation in group V. In group VI, the correlation was not significant due to the low number of samples (n = 9) (Table 3).
Table 3 Multiple linear regression of heavy metals (Cr, Cu, Ba, Pb, Mn, Ni, Zn and V) with the saturation index (SI) in the urban dust of each color group.
| Groups | Color | SI | R2 |
|---|---|---|---|
| I | Dark grayish brown |
|
0.7* |
| II | Dark gray |
|
0.6* |
| III | Dark olive brown |
|
0.7* |
| IV | Very dark gray |
|
0.6* |
| V | Very dark grayish brown |
|
0.25* |
| VI | Black |
|
1 |
* Significant regression (P < 0.05)
The RGB system’s RI had a moderate to low and significant positive multiple correlation with the HMs in the order IV, I, III, II and V. Only group VI had a high correlation, but it was not significant (Table 4).
Table 4 Multiple linear regression between heavy metals (Cr, Cu, Ba, Pb, Mn, Ni, Zn and V) and the redness index (RI) in urban dust samples grouped by colour using the CIE-RGB system.
| Groups | Color | RI | R2 |
|---|---|---|---|
| I | Dark grayish brown |
|
0.5* |
| II | Dark gray |
|
0.3* |
| III | Dark olive brown |
|
0.4* |
| IV | Very dark gray |
|
0.6* |
| V | Very dark grayish brown |
|
0.2* |
| VI | Black |
|
1 |
* Significant regression (P < 0.05)
This analysis showed that the relationship of the CIE-L*a*b* system’s RI with the HMs was higher than that of the CIE-RGB system’s RI, due to greater variability of the CIE-L*a*b* system’s coordinates.
Heavy metals by color groups of urban dust samples
The median values of urban dust HM concentrations were generally found in the order Zn > Mn > Ba > Pb > Cu > Cr > Ni > V; the same pattern is repeated in four of the six groups (III, IV, V and VI) and only the Mn > Zn in groups I and II (Table 5).
Table 5 Descriptive statistics of heavy metal concentrations of urban dust samples grouped by color.
| Group | Measures of central tendency | Ba | Cr | Cu | Mn | Ni | Pb | V | Zn |
|---|---|---|---|---|---|---|---|---|---|
| (mg·kg-1) | |||||||||
| General (n = 455) | Median | 122.5 | 43.7 | 82.5 | 223.6 | 35.0 | 101.2 | 26.2 | 229.9 |
| CV (%) | 0.4 | 0.7 | 0.8 | 0.3 | 0.4 | 1.1 | 0.3 | 1.1 | |
| Minimum | 41.2 | 15.0 | 15.0 | 100.0 | 13.7 | 8.8 | 11.3 | 38.7 | |
| Maximum | 446.0 | 441.0 | 847.1 | 990.5 | 148.7 | 1 907.8 | 160.0 | 4 827.6 | |
| I (n = 73) | Median | 124.9 | 36.2 | 67.5 | 214.9 | 26.2 | 75.0 | 26.2 | 185.0 |
| CV (%) | 0.4 | 0.5 | 0.7 | 0.2 | 0.4 | 1.2 | 0.2 | 1.0 | |
| Minimum | 46.2 | 15.0 | 15.0 | 100.0 | 13.7 | 10.0 | 15.0 | 47.5 | |
| Maximum | 288.7 | 167.5 | 342.3 | 359.7 | 73.7 | 897.1 | 52.5 | 1 241.6 | |
| II (n = 110) | Median | 121.2 | 40.0 | 73.1 | 226.1 | 33.7 | 99.9 | 26.2 | 211.8 |
| CV (%) | 0.5 | 0.7 | 0.6 | 0.3 | 0.5 | 0.7 | 0.5 | 0.7 | |
| Minimum | 41.2 | 17.5 | 17.5 | 108.7 | 15.0 | 8.8 | 15.0 | 41.3 | |
| Maximum | 446.0 | 308.7 | 306.0 | 511.0 | 148.7 | 371.3 | 160.0 | 1 246.3 | |
| III (n = 70) | Median | 123.1 | 51.2 | 98.7 | 236.2 | 36.2 | 115.5 | 27.5 | 249.8 |
| CV (%) | 0.2 | 0.6 | 0.5 | 0.2 | 0.3 | 1.0 | 0.2 | 0.6 | |
| Minimum | 66.3 | 22.5 | 28.8 | 138.8 | 16.3 | 32.5 | 16.2 | 88.7 | |
| Maximum | 239.8 | 302.3 | 297.4 | 413.5 | 68.7 | 1 141.6 | 40.0 | 1 234.4 | |
| IV (n = 45) | Median | 119.9 | 51.2 | 98.7 | 218.6 | 40.0 | 110.0 | 25.0 | 238.6 |
| CV (%) | 0.3 | 0.4 | 0.6 | 0.2 | 0.2 | 0.6 | 0.2 | 0.4 | |
| Minimum | 62.5 | 21.2 | 36.2 | 156.2 | 21.2 | 26.2 | 16.2 | 91.2 | |
| Maximum | 239.9 | 127.5 | 404.7 | 386.2 | 63.7 | 452.4 | 41.2 | 546.3 | |
| V (n = 148) | Median | 120.0 | 46.2 | 85.6 | 225.6 | 37.5 | 101.8 | 25.0 | 246.1 |
| CV (%) | 0.4 | 0.8 | 0.9 | 0.5 | 0.4 | 1.3 | 0.3 | 1.4 | |
| Minimum | 47.5 | 21.2 | 18.8 | 107.5 | 18.8 | 10.0 | 11.3 | 38.7 | |
| Maximum | 388.5 | 441.0 | 847.1 | 990.5 | 136.2 | 1 907.8 | 50.0 | 4 827.6 | |
| VI (n = 9) | Median | 133.7 | 66.2 | 112.4 | 196.3 | 36.3 | 151.1 | 23.7 | 346.0 |
| CV (%) | 0.2 | 0.3 | 0.5 | 0.2 | 0.2 | 0.5 | 0.2 | 0.3 | |
| Minimum | 87.5 | 32.5 | 57.5 | 152.4 | 22.5 | 70.0 | 21.2 | 162.5 | |
| Maximum | 148.8 | 81.3 | 286.2 | 302.4 | 45.0 | 327.4 | 35.0 | 501.3 | |
n = number of samples, CV = coefficient of variation.
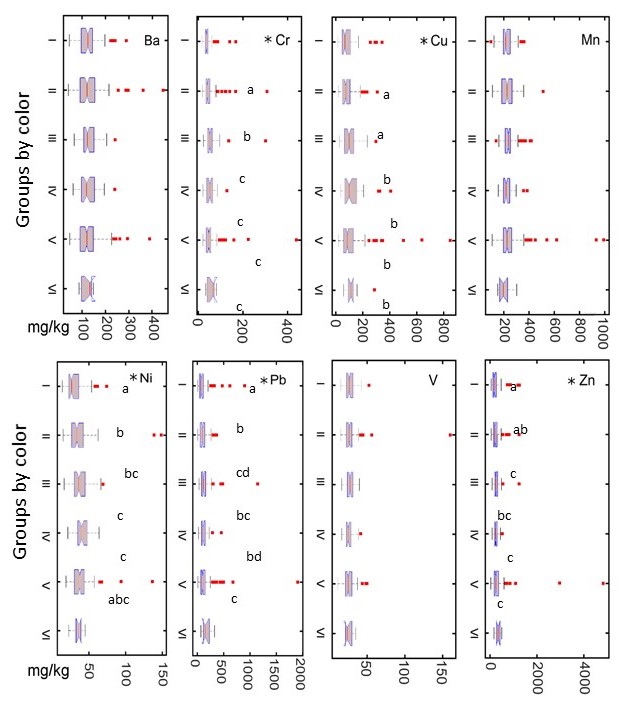
Figure 1 shows that there are differences (P < 0.05) in Cr, Cu, Ni, Pb, and Zn concentrations in urban dust samples grouped by color. Group I was the least contaminated as it had the lowest concentrations of Cu, Cr, Ni, Pb and Zn, while groups IV, V and VI had the highest concentrations, being the most contaminated.
Discussion
According to multiple linear regressions, Cu, Cr, Ni, Pb and Zn were the predominant HMs in terms of concentration, so they are considered coloring elements of urban CDMX dusts. The results of the present research indicate that the highest levels of correlation between color and HMs occur with RI (CIE-L*a*b*) and SI (CIE-RGB), due to the dark tones of the urban dusts studied.
The SI measures the general slope of a spectra, from red to blue wavelength, which, in other words, is the relative deviation from a flat spectra characteristic of a neutral color such as grey (Liu & Moore, 1990; Mathieu et al., 1998). In this study it was observed that the SI had acceptable correlation values with HMs in all urban dust groups formed by color.
The RI is used for the identification of iron oxides; in principle, this index was calculated with the Munsell system considering the chroma, hue and value parameters (Buntley & Westin, 1965; Hurst, 1977). The RI has been one of the most used in soil sciences, so it has undergone modifications, migrating to the CIE-RGB and CIE-L*a*b* systems (Barrón & Torrent, 1986; Torrent, Schwertmann, Fechter, & Alferez, 1983; Torrent, Schwertmann, & Schulze, 1980). Barrón and Torrent (1986) conclude that the calculation of RI with the CIE-L*a*b* system reproduces absolute values with greater reliability than the Munsell system and with a better relationship with iron oxides (Kirillova, Vodyanitskii, & Sileva, 2015). This index made it possible to determine that dark colors are associated with the concentration of HMs in urban dusts.
According to studies by Vodyanitskii and Savichev (2017), color is an important characteristic for the study, description and determination of various soil properties. The use of color in urban dusts that have anthropic material and soils, and their relationship with HMs, is suitable for the estimation of pollution (Cortés et al., 2015), mainly because anthropic minerals such as magnetite and maghemite are black (Bautista-Zúñiga, Cejudo, Aguilar, & Goguitchaichvili, 2014). In other words, the use of urban dust color for the identification of HM-contaminated samples corresponds to the same strategy for the use of magnetic parameters (Aguilar et al., 2013; Sánchez-Duque et al., 2015). This is because fuel burning in industries, house chimneys and vehicle exhausts causes a magnetic increase (ferrimagnetic minerals) and a dark color, due to products generated by combustion such as maghemite and magnetite (Bautista et al., 2014).
There are still few studies that use color as a tool for identifying urban dust samples with a high content of potentially toxic elements (Cortés et al., 2015; Marín et al., 2018); however, it is clear that the use of color, as a low-cost technique, facilitates the implementation of pollution monitoring studies in urban centers. Nonetheless, a study should be conducted in each city to serve as a basis for identifying the colors of the most contaminated samples; in the case of CDMX, they were dark olive brown, very dark gray, very dark grayish brown and black.
In the study of urban dusts, a methodological complication is the identification of background levels; however, in this work we could consider as background values the concentrations of HMs contained in urban dust samples of dark greyish brown (less contaminated), but eliminating the extreme values.
As for costs, the chemical analyses of each HM per sample is quoted between 100 and 200 MXN and the price of the color analysis is 30 MXN, so chemical analysis of eight elements would be approximately between 800 and 1 600 MXN, that is, 26.7 to 53.3 times higher than the cost of color analysis.
This technological advance will allow the obtaining of rapid diagnoses considering thousands of samples; in this way, based on the color, it will be possible to select those that should be chemically analyzed. This will allow us to do what has never been implemented before in any part of the world: a system for monitoring HM contamination in urban dust.
Conclusions
The color of urban dust is an indicator of heavy metal pollution in Mexico City. Dark gray and black urban dust contains higher concentrations of heavy metals such as Cr, Cu, Ni and Pb compared to other colors. This first study of urban dust color as a proxy technique (time and cost savings) can be very useful in the implementation of a heavy metal pollution monitoring system, for better decision-making for the benefit of the population’s health.

