


 text in
  English (pdf)
 Article in xml format
 Article references
 Send this article by e-mail
 Cited by SciELO
  Similars in
SciELO
Similars in
SciELO 
 Permalink
Introduction
Throughout history, droughts have been a recurrent natural event of importance for all societies, since the most extreme events can cause economic, social and political crises (Landa, Magaña, & Neri, 2008). Droughts originate when precipitation, in a given area, consistently decreases below the annual average over short or long periods (Marcos-Valiente, 2001). In Mexico, the climatic phenomenon known as El Niño Southern Oscillation (ENSO) is one of the factors related to drought occurrence. In the center of the country, this phenomenon, in its El Niño phase, tends to reduce rainfall below the average, resulting in a drought; the opposite effect is known as La Niña, which is conducive to precipitation under normal conditions, even causing floods (Magaña-Rueda, 2004).
Mexico is highly vulnerable to extreme weather events, especially in mid-latitudes and subtropical zones. In addition, considering the most likely climate change scenarios, significant decreases in precipitation and surface runoff are expected, which will cause shortages in the availability of the country's water resources (Martínez-Austria & Patiño-Gómez, 2012). Given this, historical analysis of climate variability represents a first approach to determine the recurrence of events such as droughts and floods and infer possible climate trends. This analysis has been based on a review of historical documents and instrumental records, the latter with information from particular regions that covers between 30 to 80 years (Instituto Mexicano de Tecnología del Agua [IMTA], 2009). In this sense, the annual growth rings of tree species represent a good indicator of past climatic conditions at local and regional scales, which allow us to reconstruct and analyze climate variability over several centuries (Cerano et al., 2012; Cerano, Villanueva, Valdez, Méndez, & Constante, 2011a; Villanueva-Díaz et al., 2011).
The temperate forests of the Sierra Gorda in the state of Querétaro are part of the Sierra Madre Oriental; its importance lies in the generation of hydrological environmental services, since it is a catchment area for water runoff that, from this point, is then redirected to areas adjoining the reserve (Carabias-Lillo, Provencio, de la Maza, & Ruíz-Corzo, 1999). In this region, there are no studies that allow us to know the rainfall variability on a larger scale than that observed with instrumental data. Given the importance of the region, there is an urgent need to develop dendroclimatic studies based on growth rings of coniferous species. These works represent an alternative to reconstruct rainfall on a wider scale, analyze its variability and observe recurrent drought events that can alter hydrological environmental services and affect the well-being of the region’s inhabitants. In this context, this research work aimed to: 1) develop dendrochronological series with the ring width of Pinus greggii Engelm. ex Parl. and P. montezumae Lamb., 2) determine their potential to reconstruct rainfall variability, and 3) reconstruct, as a minimum, precipitation variability and its relationship with ENSO for the last century in the Sierra Gorda Biosphere Reserve (SGBR).
Materials and methods
Study area
The study was conducted in the southwest of the SGBR between parallel 21° 10´ N and meridian 99° 42´ W, in the northwest of the municipality of Pinal de Amoles, Querétaro (Figure 1). The study area reaches an elevation of 3 100 m at its highest point and dips to 2 600 m at its lowest point and is part of the physiographic province of the Sierra Madre Oriental. The predominant climate is temperate sub-humid with average annual precipitation ranging between 550 and 872 mm; the maximum rainfall is in summer with a midsummer drought period (Instituto Nacional de Estadística y Geografía [INEGI], 2014).

Sampling and its preparation
The species P. greggii and P. montezumae were selected because they are the most representative of the area. Based on selective sampling, the longest-living trees, free of mechanical damage, pests and diseases, were considered. Three growth cores (increments) were extracted from each tree with Pressler increment borers, of which two were obtained with a 5-mm diameter increment borer and one with a 12-mm increment borer at varying heights according to the healthy appearance of the stem. In total, 87 samples were extracted from 29 trees, 15 (45 rays) of P. greggii and 14 (42 rays) of P. montezumae.
The samples were mounted and glued in grooved sections of wood, taking care that the fibers remained perpendicular to the growth rings. Each sample was polished with different grains of sandpaper (120-1200) to highlight the annual growth structures and facilitate analysis in the stereoscope (Cerano et al., 2014).
The samples were dated in the laboratory using the dendrochronological techniques of Stokes and Smiley (1968). Once predated, total ring width was measured with a VELMEX system (model TA4030H1-S6, Velmex Inc., New York, USA), composed of a sliding- phase system, a linear encoder with 0.001-mm precision integrated to a PC processor and a stereoscope with a reticulated eyepiece, to define the limits of each growth ring. The quality of the dating was verified with Program COFECHA (Holmes, 1983). The tree-ring index series or chronology by species and combined was generated with Program ARSTAN version 6.05P (Cook & Holmes, 1984).
Climate response function and rainfall reconstruction
In the analysis of the growth response of P. greggii and P. montezumae to precipitation, we considered the records of the weather stations closest to the sampling area that have the most complete records and the highest correlation values with the chronology. These stations were the Higuerillas, Peñamiller and Vizarrón facilities in the state of Querétaro, and one in the state of Guanajuato in the municipality of Xichu (Figure 1; Table 1). The records of these stations were averaged and a regional database was generated (38 years, 1966-2003). The data were obtained from Extractor Rápido de Información Climática III (ERIC) software (IMTA, 2009).
Table 1 Weather stations closest to the sampling site in the southwest of the Sierra Gorda Biosphere Reserve.
| State | Key | Name | Municipality | Longitude | Latitude | Elevation (m) | Period |
|---|---|---|---|---|---|---|---|
| Querétaro | 22056 | Higuerillas | Cadereyta | -99.763 | 20.914 | 1 580 | 1982-2003 |
| Querétaro | 22012 | Peñamiller | Peñamiller | -99.814 | 21.055 | 1 330 | 1966-2001 |
| Querétaro | 22035 | Vizarrón | Cadereyta | -99.704 | 20.834 | 2 030 | 1973-2002 |
| Guanajuato | 11083 | Xichu | Xichu | -100.050 | 21.383 | 1 310 | 1969-2003 |
By means of a correlation analysis between the total ring indices of the combined chronology and the observed data of monthly and accumulated precipitation, the months that best related to the chronology were determined, as well as the period of the year that significantly influenced tree growth (Fritts, 1999). Once the most influential rainfall period was identified, a linear transfer equation or climate reconstruction model was developed. In order to statistically validate the climate reconstruction model, the linear equation was applied to the observed data period (1966-2003) and two statistical tests were developed, one of calibration and another of verification between the observed and reconstructed precipitation. Calibration was carried out in the first half of the observed climatic records (1985-2003). The success of the calibration is measured by the percentage of variation that the independent variable (total ring index) explains of the reconstructed dependent variable (precipitation). In the remaining half (1966-1984), the verification was made with the objective of statistically validating the climate reconstruction (Fritts, 1999).
Once the statistical significance was determined, the regression model was applied to the whole series and a reconstruction of the variability of the historical precipitation was generated. A flexible decennial curve was fitted to the annual resolution high-frequency series to highlight low frequency events, dry or wet periods (Cook & Peters, 1981). The dry and wet periods reconstructed were compared with other dendrochronological works generated for the center and north of the country, and with historical documents.
The influence of ENSO on the historical variability of the precipitation in the SGBR was analyzed through the relationship of the reconstructed precipitation and the Niño 3.4 indices (1894-2008), estimates of the variability of ENSO (Trenberth, Kevin, & National Center for Atmospheric Research Staff, 2016). To this end, annual resolution graphs and their wavelet power spectra generated with the MATLAB 6.5 program (MathWorks, 2002) were used. Finally, using data from the Mexican Drought Atlas (Stahle et al., 2016), drought maps were generated for four periods with less rainfall, in order to show the climatic conditions at national level and verify the reconstructed events.
Results and discussion
It was possible to date a total of 78 growth cores, 42 from P. greggii and 36 from P. montezumae. Nine cores could not be dated due to suppression periods that hindered reliable dating. Two total-ring chronologies, one of 117 years (1898-2014) of P. greggii and another of 124 years (1877-2000) of P. montezumae, were generated. The same variability was determined between series, the databases were combined and a composite chronology was developed with a length of 138 years (1877-2014). The chronology’s length is determined by the age of the trees, with the older the individuals the more feasible it is to develop more extensive series that allow analyzing climate variability on a longer time scale.
Figure 2 illustrates the climate response function in the SGBR. By relating the chronology with the regional climatic data, it was determined that the average monthly precipitation presented positive correlation with the January-May period; the correlations were highly significant (P < 0.01) for the months of January, April and May (Figure 2a). In the case of accumulated precipitation, the correlation was highly significant (P < 0.01) for the January-June period; the highest correlation was observed in the January-May period (r = 0.72; P < 0.01) (Figure 2b). The species P. greggii and P. montezumae responded significantly to the precipitation corresponding to the winter-spring period. This is attributed to the fact that the rain in this period is of low intensity, does not exceed the infiltration capacity and is stored in the soil profile where, later, it is used by the trees at the beginning of the growing season (Fritts, 2001). Unlike this, summer rains are recorded in a torrential manner and largely drain off without being used by the tree, to which the zero-growth rate in these months of the year is attributed (Figure 2a). According to other studies, the winter-spring seasonal precipitation is the rain that most influences the growth of the center's forests (Cerano-Paredes et al., 2013, 2014; Cortés, Villanueva, Nieto de Pascual, Estrada, & Guerra, 2012) and the north of the country (Cerano et al., 2009, 2011b; Chávez-Gándara et al., 2017; Villanueva-Díaz et al., 2015).
The relationship of the total ring index and the observed average rainfall of the January-May seasonal period (1966 to 2003) was significant (r = 0.72, P < 0.01) (Figure 2c). This indicates that that there is potential to develop a regression equation that allows reconstructing the variability of seasonal rainfall over the total length of the chronology. The transfer equation for the bivariate model was as follows:
Yt = a + b * Xt
Yt = - 54.7791 + 153.0196 * Xt
where,
Yt |
value of January-May precipitation (mm) for a specific year |
Xt |
total ring index for a specific year |
a and b |
constants obtained from the model |

Figure 2 Climate response function in the southwest of the Sierra Gorda Biosphere Reserve: a) correlation between the total ring width index and the average monthly precipitation records in the period 1966 to 2003, b) correlation between the total ring width index and the accumulated precipitation records in the period 1966 to 2003, and c) association between the total ring index and the average January-May (winter-spring) seasonal precipitation observed in the period 1966 to 2003. Statistical significance: *P < 0.05 and **P < 0.01.
Calibration and verification of the regression model
The model applied for the observed and reconstructed data period was validated by calibration and verification tests between the observed and reconstructed data (Figure 3a). In the 1985-2003 sub-period calibration process, the correlation between observed and reconstructed precipitation was r = 0.72 and the model explained 52 % of the rainfall variability (R2 = 0.52; P < 0.05). The verification in the 1966-1984 sub-period presented a correlation of r = 0.85, where the model explained 72 % of the variability (R2 = 0.72; P < 0.05). In the total period of observed and reconstructed precipitation, the variables had a correlation of r = 0.72 and the model explained 52 % of the precipitation variability (R2 = 0.52; P < 0.01; Figure 3a) in the period 1966-2003. Since both model sub-periods had significant correlations, the model generated in the total climate data period (1966-2003) was considered valid and was applied to the total chronology to reconstruct the rainfall variability (Tables 2 and 3).
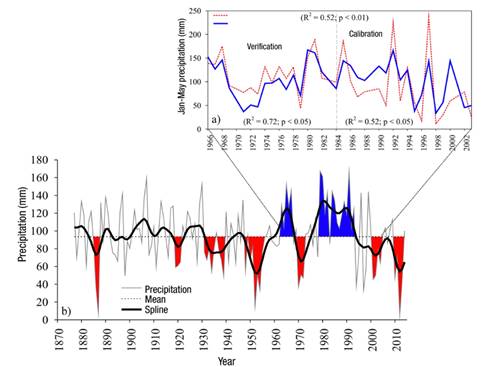
Figure 3 Reconstructed precipitation: a) calibration (1985-2003 sub-period) and verification (1966-1984 sub-period) of the regression model, and b) winter-spring (January-May) seasonal precipitation in 138 years for the southwest of the Sierra Gorda Biosphere Reserve. The gray line at the bottom indicates annual precipitation variability; the flexible black curve is a smoothing spline at 10-year intervals (spline) to detect dry events (precipitation below the average) or wet ones (precipitation above the average); and the dotted horizontal line indicates average precipitation (96 mm). The areas in red show the severest droughts and in blue the greatest precipitations.
Table 2 Linear regression model generated for the reconstruction of the winter-spring seasonal precipitation in the Sierra Gorda Biosphere Reserve.
| Period | R2 | Constants | Standard error | t-test | P |
|---|---|---|---|---|---|
| 1966-2003 | 0.52 | a -54.7791 | 27.1347 | -2.0187 | 0.051955 |
| b 153.0196 | 25.6407 | 5.9678 | 0.000001 |
Table 3 Analysis of variance of the regression model generated for the reconstruction of winter-spring (1877-2014) seasonal precipitation in the Sierra Gorda Biosphere Reserve.
| Period | Sum of squares | Difference | Mean squares | F | P |
|---|---|---|---|---|---|
| Regression | 55 074.9 | 1 | 55 074.9 | 35.614 | 0.000001 |
| Residual | 49 484.8 | 32 | |||
| Total | 104 559.7 |
Variability of reconstructed precipitation
The reconstruction of the historical winter-spring precipitation for the southwest of the SGBR, which covers the period from 1877 to 2014 (138 years), indicates interannual variability (high frequency) as a result of the intrinsic variation of the study area; likewise, there is interdecadal variability (low frequency) that results from the impact of climate events at a regional and national scale (Figure 3b). This is attributed to global-circulation climatic phenomena of great intensity that affect large regions of Mexico (Seager et al., 2009; Stahle et al., 2009).
In the studied region of the SGBR there is evidence of seven droughts in the last 138 years; one occurred at the end of the 19th century, four in the 20th century, one at the end of the 20th century and the beginning of the 21st century, and one more that began in the second decade of the 21st century with a tendency to decrease in 2014 (Figure 3b; Table 4). With respect to precipitation, important events were reconstructed for the 1960s and 1980s; the latter was the wettest of the last 138 years in the SGBR (Figure 3b, Table 4).
The periods with the most significant decreases in precipitation for the southwest of the Sierra Gorda in Querétaro coincide with droughts reconstructed in regions both for central (Cardoza et al., 2014, Cerano et al., 2014, Cortés et al., 2012) and northern Mexico (Cerano et al., 2009, 2011a; Chavez-Gándara et al., 2017; Díaz-Ramírez, Villanueva-Díaz, & Cerano-Paredes, 2016; Seager et al., 2009; Villanueva-Díaz et al. al., 2015). The above shows that climatic phenomena in specific years or short periods have affected extensive geographical regions and that based on the paleoclimatic series it is feasible to know the geographical scope.
Of the seven reconstructed droughts in the SGBR, four stand out for recording the lowest rainfall in the last 138 years (1886-1887, 1951-1956, 1969-1973 and 2010-2012). Some paleoclimatic studies have reported that in the late nineteenth century and early twentieth century (1886-1904) a severe drought occurred in central Mexico, with the year 1887 being the most extreme (Cardoza et al., 2014; Contreras-Servín, 2005). This supports the first reconstructed drought period (1886-1889) for this region of Querétaro (Table 4).
Table 4 Reconstructed precipitation events below and above the observed average (96 mm; 1966-2003). The years 1887 and 2012 represent the driest, and 1979 and 1991 the wettest of the 1877-2014 period in the southwest of the Sierra Gorda Biosphere Reserve in Querétaro.
| Condition | Precipitation | Period | Most extreme year | Average precipitation of 96 mm |
|---|---|---|---|---|
| Drought | Low | 1919-1921 1931-1939 2000-2005 | 1919 1939 2001 | 59 48 45 |
| Very low | 1886-1889 1948-1957 1969-1972 2010-2015 | 1887 1952 1970 2012 | 06 15 37 04 | |
| Wetness | High High | 1963-1969 1979-1993 | 1965 1979 and 1991 | 152 167 and 166 |
The 1950s represent the most extensive drought in the last 138 years in the SGBR (Figure 3b). The results agree with those reported in precipitation reconstructions for both northern (Cerano et al., 2009, 2011a; Seager et al., 2009) and central Mexico (Cerano et al., 2014; Cortés et al., 2012), where severe droughts were reconstructed in the 1950s. The decreased rainfall in this decade is considered one of the most widespread droughts, with the greatest spatial amplitude and great intensity in Mexico and the southeastern United States (Florescano, Cervera, & Arias, 1980; Stahle et al., 2009).
During the period 1969-1973, a low rainfall event was recorded (Figure 3b) that agrees with intense drought records in central (Cardoza et al., 2014) and northern Mexico (Cerano et al., 2009). Likewise, Florescano et al. (1980) documented, for this period, an agricultural crisis with negative economic and social effects in a large part of the country as a consequence of the drought. In the present work, the most recent reconstructed drought was for the period 2010-2015, with the year 2012 being the most intense. The Secretaría de Gobernación (2012), through the Diario Oficial de la Federación, the official gazette of the Mexican government, reported that the worst drought in the north and center of the country was recorded in 2011.
Figure 4 shows the maps generated with data from the Mexican Drought Atlas (Stahle et al., 2016), for each of the four droughts. The results show the climatic condition in most of the national territory, with droughts extending to the SGBR region. The results validate the information reconstructed for the periods with the severest droughts (1886-1887, 1951-1956, 1969-1973 and 2010-2012) and reaffirm the importance of paleoclimatic series in analyzing climate variability on an extensive geographic scale.

Figure 4 Maps generated with data from the Mexican Drought Atlas (Stahle et al., 2016), which show drought conditions at national level during the four reconstructed periods of lower rainfall in the southwest of the Sierra Gorda Biosphere Reserve, Querétaro. On the scale, the values -6 (red) and 6 (blue) indicate higher drought and wetness conditions, respectively. The maps verify the quality of the reconstruction. The study area is indicated by a black star.
ENSO influence on rainfall variability
The wavelet spectrum for both precipitation (Figure 5a) and El Niño 3.4 (Figure 5b) shows significant periodicities (P < 0.05) from one to seven years for the late nineteenth century and early twentieth century, and the late twentieth century and early 21st century; and from 16 to 24 years in the middle of the 20th century. The wavelet coherence between the reconstructed precipitation and the El Niño 3.4 indices shows significant coherence (P < 0.05) for the periods 1885-1905, 1937-1985 and 1937-2008 with frequencies of 5-7 years, 14-20 years and 21-29 years, respectively (Figure 5c). For these periods, the two phenomena coincide in phase and have a positive relationship. The severest droughts and wettest events reconstructed for the southwest of the SGBR have been significantly modulated (P < 0.05) by ENSO.

Figure 5 Wavelet power spectra at annual level: a) reconstructed precipitation, b) Niño 3.4 indices, and c) wavelet coherence domain between the reconstructed precipitation series and the Niño 3.4 index. The red areas delimited by a black line represent periods with significant frequencies (P < 0.05) and the arrows pointing to the right indicate that the two phenomena are in phase (positive relationship).
Similar results have been documented in paleoclimatic studies of northern (Cerano et al., 2011a; Chávez et al., 2017) and central Mexico (Therrell, Stahle, Villanueva, Cornejo, & Cleaveland, 2006), where extreme drought events with a 50-year recurrence interval, between the end and the beginning of a century and the middle of a century, have been reported. For some regions, this recurrence has been observed during the last 600 years (Cerano et al., 2011a). This variability modulates the frequency of the severest droughts in this region of northern Querétaro (Figure 3b; Table 4). Conducting this type of study in the region is important to achieve a more detailed analysis of local climate variability and the influence of other general-circulation climatic phenomena on low- and high-frequency variability and the availability of hydrological services of the SGBR.
Conclusions
This study based on dendrochronological techniques represents the first work that shows the variability of historical precipitation (138 years) in the Sierra Gorda Biosphere Reserve and contributes to the knowledge and characterization of low-frequency events (low and high precipitation). The severest droughts reconstructed for this region synchronize with extreme drought events reported for both central and northern Mexico, with a recurrence of approximately 50 years. Precipitation variability in the reserve has been significantly modulated by ENSO; understanding the influence of this climatic phenomenon on the historical variability of the regional climate is essential to anticipate negative or positive effects on rainfall conditions. This information is relevant for decision makers in order to implement the appropriate measures and reduce the havoc in communities that depend on the hydrological services of this area.

