


 text in
  English (pdf)
 Article in xml format
 Article references
 Send this article by e-mail
 Cited by SciELO
  Similars in
SciELO
Similars in
SciELO 
 Permalink
Introduction
Climate change has been documented at broad resolution scales since the mid XX century. Since then, huge quantities of resources have been invested in the understanding of the phenomenon and its possible consequences on species distribution (Martínez-Meyer, 2005). Paleoecological evidence indicates that the distribution area of some species has contracted or expanded on various occasions since the last ice age; therefore, it is assumed that in the future there could be a similar phenomenon. The decrease or increase in the geographic distribution ranges of the species are in function of their adaptability to the climate change. Such adaptability is related to genetic variation; the species with less variation will be more susceptible to extinction (Hamrick, 2004).
Some studies recommend that species sensitive to climate change must be examined closely in order to define preservation strategies ex situ (Sáenz-Romero, Rehfeldt, Duval, & Lindig-Cisneros, 2012; Viveros- Viveros et al., 2009). An alternative study to evaluate the impact of climate change on the geographic space of the species is through the use of species distribution models or ecological niche models (Jeschke & Strayer, 2008; Peterson, 2006).
The species distribution modeling is done with two techniques: mechanistic and correlative. The former is based on physiological experiments of a particular species, whereas the latter links the environmental variables with the areas of species occurrence (Anderson & Raza, 2010). The generated niche model is applied to a geographic space in order to identify ideal areas for species distribution. This type of modeling utilizes predicted future climates based on a combination of general atmosphere-ocean circulation models and reports of various scenarios. Such models pose different hypotheses on the effect of oceans and the atmosphere on climate; the effect is characterized by different supposed futures of socioeconomic and technological development (Real, Luz Márquez, Olivero, & Estrada, 2010).
An important aspect in modeling the species distribution is delimiting the area of study prior to modeling, especially when invasive species or climate change are investigated, so that the predictive models have a high transferability (Anderson & Raza, 2010). In the case of this study, the state of Michoacán was selected due to it being one of the entities with greatest plant diversity in Mexico (Cué-Bär, Villaseñor, Arredondo-Amezcua, Cornejo-Tenorio, & Ibarra- Manríquez, 2006; Villaseñor, 2003). Among them, the Pinaceae family represents 27 % of the total area of study and at least 15 species belong to the Pinus genus (Cué et al., 2006; Gutiérrez & Duivenvoorden, 2010). The importance of these species lies in their instrumental and intrinsic value. The former refers to goods such as food, fuel, nutrient recycling, water filtration, and contamination adsorption, and it can acquire greater economic value if the possibilities of biotechnology in genetic engineering are considered in the future. With regard to the intrinsic value, the decrease in biological diversity represents the loss of genetic viability of the species and ecosystems, for example, the loss of tree species and, in turn, the loss of habitat for other species such as Danaus plexippus L. (monarch butterfly) (Meléndez, 2010; Sáenz-Romero et al., 2012; Villaseñor, 2005). In Mexico, there is no adequate system to designate protection areas for Pinus species (56 species) sensitive to climate change, given that less than 10 % of the distribution area is designated as a natural protected area (Gutiérrez & Duivenvoorden, 2010).
This paper had the objective of evaluating the impact of climate change on the potential distribution of 12 Pinaceae species (10 pines and two fir trees) in Michoacán, with the purpose of identifying the species that will be most affected.
Materials and methods
Area of study
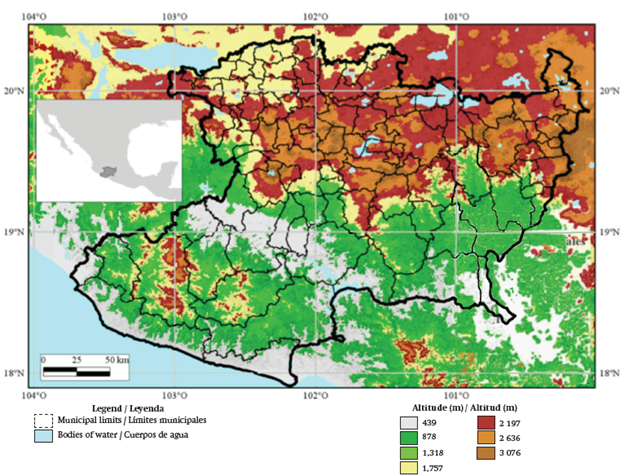
The state of Michoacán (Figure 1) has an approximate surface area of 58,864 km2. Altitudes vary from sea level up to 3,840 m (Tancitaro volcano); the average altitude is 1,343 m. The state is located inside three physiographic regions: the Balsas Depression, the Pacific Coast and the Trans-Mexican Volcanic Belt. The main types of rocks are basic and acid extrusive igneous (Instituto Nacional de Estadística y Geografía e Información [INEGI], 1988). The most prominent types of soil are Vertisol, Luvisol, Latosol, Andosol, Regosol and Phaeozem (INEGI, 1988). The electric conductivity of the soils is less than 0.22 dS·m-1 and the content of organic matter varies from 1.4 to 3.4 %; the greatest soil ratio has a slightly to moderate acidic pH (Cruz-Cárdenas et al., 2014). The climate types are warm sub-humid (Aw1, Aw0) and temperate sub-humid (C(w1), C(w2)) (García, 1990); the minimum and maximum temperature averages are 13.8 and 29.4 ºC, respectively, with an average precipitation of 850 mm. The main plant communities found in Michoacán are: coniferous forests, oak forests, mountainous cloud forests, deciduous tropical forests, subtropical thickets, thorn forests and tropical semi-deciduous forests (Villaseñor, 2005).
Occurrence data
Two hundred records of species occurrence were obtained for pines and fir trees in the state of Michoacán, which are housed in the national herbarium (MEXU) in the Institute of Biology at the Universidad Nacional Autónoma de México. The species studied with a corresponding record number are: Abies guatemalensis Rehd. (4), Abies religiosa (Kunth) Schltdl. & Cham. (22), Pinus douglasiana Martínez (11), Pinus hartwegii Lindl. (5), Pinus lawsonii Roezl ex Gordon (15), Pinus leiophylla Schiede ex Schltdl. & Cham. (48), Pinus michoacana Martínez (36), Pinus montezumae Lamb. (15), Pinus oocarpa Schiede ex Schltdl. (4), Pinus pseudostrobus Lindl. (18), Pinus rzedowskii Madrigal & M. Caball. (15) and Pinus teocote Schiede ex Schltdl. & Cham. (7).
Bioclimatic data
Nineteen bioclimatic variables were generated (Table 1) for current and future conditions, derived from the information regarding precipitation and minimum and maximum temperatures, utilizing the DIVA-GIS 7.5 software (Hijmans, Cruz, & Guarino, 2012). The baseline data corresponds to the daily climatological base (1960-2000) of the National Meteorological Service of the National Water Commission (Fernández-Eguiarte, Zavala-Hidalgo, & Romero-Centeno, 2015a). In regard to the future conditions, two scenarios of radiative forcing or representative concentration pathways (RCP) were used, with low (RCP 4.5 W·m-2) and high (RCP 8.5 W·m-2) emissions, and of both near (2015-2039) and far (2075-2099) future outlooks for each RCP (Fernández- Eguiarte, Zavala-Hidalgo, Romero-Centeno, Conde-Álvarez, & Trejo-Vázquez, 2015b).
Table 1 Bioclimatic variables of current and future conditions, utilized in the study of the potential distribution of 12 Pinaceae species in Michoacán.
| Variable | Description |
|---|---|
| bio1 | Annual Mean Temperature |
| bio2 | Mean Diurnal Range (Tmax-Tmin) |
| bio3 | Isothermality (bio2/bio7) × 100 |
| bio4 | Temperature Seasonality (standard deviation × 100) |
| bio5 | Maximum Temperature of Warmest Month |
| bio6 | Minimum Temperature of Coldest Month |
| bio7 | Temperature Annual Range (bio5-bio6) |
| bio8 | Mean Temperature of Wettest Quarter |
| bio9 | Mean Temperature of Driest Quarter |
| bio10 | Mean Temperature of Warmest Quarter |
| bio11 | Mean Temperature of Coldest Quarter |
| bio12 | Annual Precipitation |
| bio13 | Precipitation of Wettest Month |
| bio14 | Precipitation of Driest Month |
| bio15 | Precipitation Seasonality |
| bio16 | Precipitation of Westte Quarter |
| bio17 | Precipitation of Driest Quarter |
| bio18 | Precipitation of Warmest Quarter |
| bio19 | Precipitation of Coldest Month |
Soil properties data
Data on the soil properties were soluble cations (Ca, K, Mg, and Na; cmol·L-1), electric conductivity (dS·m-1), organic matter (%) and pH (Cruz-Cárdenas et al., 2014).
Selection of environmental predictors
The co-linearity of the 19 baseline variables was evaluated with a multinomial regression analysis. The multinomial model was adjusted through neural networks for the selection of variables (Venables & Ripley, 2002). The model with the selected variables and the model with the 19 variables were evaluated with the X2 test. The group of variables with the best fit was utilized for species distribution modeling in future scenarios. The same variable selection technique was employed for the soil properties data.
Species distribution modeling
The species distribution models were generated using the Maxent software (version 3.3.3k) by Phillips Revista Chapingo Serie Ciencias Forestales y del Ambiente | Vol. XXII, núm. 2, mayo-agosto 2016. Anderson, and Schapire (2006). The purpose of Maxent is to estimate the target or unknown probability distribution through the probability distribution of maximum entropy (close to uniform), delimited by a set of restrictions that represent the incomplete information regarding the target distribution. The available information for the target distribution is shown as a group of variables or functions, and the restrictions are the expected values of each function, which must be equal to their sampling average (the sampling average for a group of sampled points is taken from the target distribution). When Maxent is utilized in modeling the species distribution using only occurrence records (occurrence of the 10 pines and two fir trees), the pixels of the area of study become space on which the probability distribution is delimited. In this case, the pixels with known species occurrence records constitute the sampling points, and the functions are the variables of climate, topography, and soils. About 75 % of the occurrence data was utilized for the training of the models and the remaining 25 % was used to validate them. The output grids of Maxent were categorized into three categories based on the average and the standard deviation of the logistical values (Cianfrani, Le Lay, Hirzel, & Loy, 2010). The unsuitable category consists in areas where the environmental requirements of the species are not satisfied; the marginal category consists in areas where the conditions of the habitat cannot permanently sustain the species; and the suitable category consists in areas with optimal environmental conditions in order to sustain the species presence (Ottaviani, Lasinio, & Boitani, 2004).
The future projections were made with the trained model parameters of each species, but it was specified by Maxent not to carry out the extrapolation due to there being problems in transferring the models (see details in Owens et al., 2013). The area under the curve was calculated in order to evaluate the accuracy of the models. The areas of the future scenario models were obtained through command lines, given that the graphic interface of Maxent does not allow for the calculation of these values for the projections.
Results and discussion
The climate variables selected with multinomial regression were: maximum temperature of the warmest month (bio5), minimum temperature of the coldest month (bio6), annual temperature range (bio7), and precipitation of the driest quarter (bio17). Based on the X2 test, the Akaike information criterion for the model with 19 variables was not significantly different from the model with selected variables (P = 0.999). In regard to the model with the seven soil variables and the model with the selected soil variables (pH and K), there was also no significant difference (P = 0.395) between them. Therefore, in the species distribution modeling, four climate variables, two soil variables, and the digital elevation model were utilized. The importance of variable selection lies in reducing the co-linearity and thus preventing the risk of over adjusting the models. The selected climate variables in the temperature and precipitation groups are in accordance with what was proposed by Barbet-Massin and Jetz (2014), with which models consistent in space and time are generated, mainly with the variables in the temperature group.
Table 2 shows the values of the area under the curve of the species distribution models. In general, the values of the area in all the scenarios are greater than 0.80, except for A. guatemalensis, P. oocarpa, and P. teocote. Baldwin (2009) mentions that the values of the area under the curve less than 0.7 are considered bad predictive models, values of 0.7 to 0.9 are good models, and values greater than 0.9 are extremely good models. Therefore, 85 % of the distribution models for the pine and fir tree species are considered good (40 %) and extremely good (45 %). Furthermore, the values of the area did not significantly decrease with time and showed a variation coefficient less than 6 % in the majority of cases. The models with low predictive power mainly correspond to those with occurrence localities less than 5, such as A. guatemalensis and P. oocarpa.
Table 2 Values of the area under the curve of the distribution models of 12 species of Pinaceae in the state of Michoacán, under different scenarios and periods.
| Species | Baseline (1960-2000) | RCP45 2015-2039 | RCP45 2075-2099 | RCP85 2015-2039 | RCP85 2075-2099 | Variation Coefficient (%) |
|---|---|---|---|---|---|---|
| Abies guatemalensis Rehd. | 0.445 | 0.463 | 0.482 | 0.462 | 0.520 | 6.0 |
| Abies religiosa (Kunth) Schltdl. & Cham. | 0.921 | 0.913 | 0.900 | 0.914 | 0.900 | 1.0 |
| Pinus douglasiana Martínez | 0.887 | 0.887 | 0.918 | 0.895 | 0.904 | 1.5 |
| Pinus hartwegii Lindl. | 0.997 | 0.999 | 0.998 | 0.997 | 0.998 | 0.1 |
| Pinus lawsonii Roezl ex Gordon | 0.854 | 0.851 | 0.865 | 0.859 | 0.839 | 1.1 |
| Pinus leiophylla Schiede ex Schltdl. & Cham. | 0.993 | 0.917 | 0.909 | 0.926 | 0.908 | 3.8 |
| Pinus michoacana Martínez | 0.857 | 0.842 | 0.848 | 0.847 | 0.808 | 2.2 |
| Pinus montezumae Lamb. | 0.810 | 0.808 | 0.801 | 0.807 | 0.807 | 0.4 |
| Pinus oocarpa Schiede ex Schltdl. | 0.577 | 0.620 | 0.716 | 0.548 | 0.769 | 14.5 |
| Pinus pseudostrobus Lindl. | 0.997 | 0.984 | 0.981 | 0.979 | 0.979 | 0.8 |
| Pinus rzedowskii Madrigal & M. Caball. | 0.994 | 0.995 | 0.994 | 0.994 | 0.994 | 0.0 |
| Pinus teocote Schiede ex Schltdl. & Cham. | 0.671 | 0.745 | 0.744 | 0.763 | 0.710 | 5.0 |
RCP: Scenarios of radiative forcing or representative concentration pathways of low (RCP 4.5 W·m-2) and high (RCP 8.5 W·m-2) emissions, and of a close (2015-2039) and far (2075-2099) future outlook.
Table 3 shows the contribution percentage of the variables or environmental predictors in each species distribution model. The environmental predictors with greater weight were maximum temperature of the warmest month (bio5), minimum temperature of the coldest month (bio6), and pH.
Table 3 Contribution of the environmental predictors on the distribution models of 12 species of Pinaceae in Michoacán.
| Species | Contribution on the distribution models (%) | |||||||
|---|---|---|---|---|---|---|---|---|
| bio5 | bio6 | bio7 | bio17 | K | pH | DEM | Total | |
| Abies guatemalensis Rehd. | 80.0 | 20.0 | 100.0 | |||||
| Abies religiosa (Kunth) Schltdl. & Cham. | 2.2 | 81.9 | 0.7 | 1.4 | 13.4 | 0.4 | 100.0 | |
| Pinus douglasiana Martínez | 4.9 | 92.3 | 0.1 | 2.7 | 100.0 | |||
| Pinus hartwegii Lindl. | 55.5 | 44.5 | 100.0 | |||||
| Pinus lawsonii Roezl ex Gordon | 1.0 | 76.7 | 2.1 | 0.1 | 20.1 | 100.0 | ||
| Pinus leiophylla Schiede ex Schltdl. & Cham. | 59.2 | 7.2 | 1.8 | 15.3 | 0.3 | 14.9 | 1.3 | 100.0 |
| Pinus michoacana Martínez | 26.8 | 5.4 | 10.3 | 5.5 | 1.0 | 14.3 | 36.7 | 100.0 |
| Pinus montezumae Lamb. | 9.3 | 36.5 | 0.3 | 2.1 | 2.9 | 48.9 | 100.0 | |
| Pinus oocarpa Schiede ex Schltdl. | 36.2 | 11.0 | 44.5 | 8.3 | 100.0 | |||
| Pinus pseudostrobus Lindl. | 92.40 | 0.1 | 6.0 | 1.5 | 100.0 | |||
| Pinus rzedowskii Madrigal & M. Caball. | 45.7 | 8.6 | 21.8 | 23.5 | 0.4 | 100.0 | ||
| Pinus teocote Schiede ex Schltdl. & Cham. | 92.3 | 7.7 | 100.0 | |||||
Bio5 = Maximum temperature of the warmest month, bio6 = Minimum temperature of the coldest month, bio7 = Temperature annual range, bio17 = Precipitation of the driest month. DEM: Digital elevation model.
The distribution potential of the 10 pines and two fir trees in the baseline is shown in Figure 2. According to the figure, the suitable area for the distribution of the majority of the species is within the biogeographic provinces of the Trans-Mexican Volcanic Belt and Sierra Madre del Sur; whereas the biogeographic provinces of the Balsas Depression and Pacific Coast are areas where the environmental requirements for the species are not satisfied. Table 4 shows the rate of change of the surface of the suitable area for the 10 pines and two fir trees in future scenarios with regard to the baseline. More than 30 % of the surface area of the state shows ideal conditions for the distribution of P. douglasiana, P. lawsonii, P. montezumae, and P. pseudostrobus. On the other hand, less than 7 % of the surface area of the state is considered ideal for the distribution of A. religiosa and P. rzedowskii. The close outlook predictions show a change in the ideal areas for the presence of the studied species. In this outlook, the distribution area of P. oocarpa will increase 81 %, whereas the suitable area of A. religiosa, P. leiophylla, and P. teocote will decrease by more than 40 %. The predictions for the far outlook also show that there will be a reduction in the ideal areas. The ideal areas of A. religiosa, P. hartwegii, P. leiophylla, P. michoacana, and P. teocote will decrease by more than 60 %. On the other hand, the ideal distribution area for P. oocarpa and P. rzedowskii will increase by 18 and 10 %, respectively.
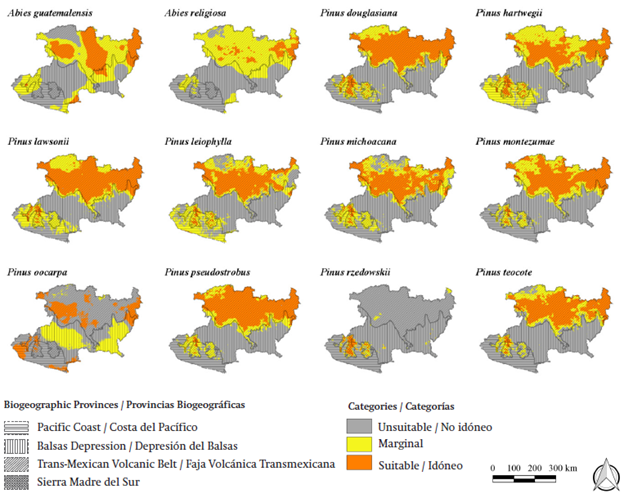
Figure 2 Potential distribution maps for species of pines and fir in the baseline (1960-2000) of study in Michoacán.
Table 4 Rate of change of the surface of the ideal areas of 12 species of Pinaceae in Michoacán, with regard to the baseline (1960-2000).
| Species | Baseline | Rate of change (%) | |
|---|---|---|---|
| Close outlook (2015- 2039) | Far outlook (2075-2099) | ||
| Abies guatemalensis Rehd. | 22.23 | 3.01 | -0.25 |
| Abies religiosa (Kunth) Schltdl. & Cham. | 6.83 | -54.54 | -89.90 |
| Pinus douglasiana Martínez | 36.84 | -24.33 | -57.11 |
| Pinus hartwegii Lindl. | 25.96 | -38.27 | -75.94 |
| Pinus lawsonii Roezl ex Gordon | 37.86 | -11.11 | -32.71 |
| Pinus leiophylla Schiede ex Schltdl. & Cham. | 25.69 | -47.74 | -72.56 |
| Pinus michoacana Martínez | 27.92 | -38.63 | -71.81 |
| Pinus montezumae Lamb. | 30.79 | 6.15 | 4.55 |
| Pinus oocarpa Schiede ex Schltdl. | 18.32 | 81.03 | 18.29 |
| Pinus pseudostrobus Lindl. | 38.46 | -10.97 | -37.95 |
| Pinus rzedowskii Madrigal & M. Caball. | 2.4 | -4.38 | 10.21 |
| Pinus teocote Schiede ex Schltdl. & Cham. | 29.93 | -41.80 | -68.08 |
According to Figure 3, the unsuitable area will increase in the periods and future scenarios with regard to the baseline climate; the increase will cause the decrease of the ideal areas. The decrease of ideal area between the future climate scenarios and the baseline was not significant (P = 0.103), with the exception of the scenario RCP 8.5 and outlook 2075-2099. In general, the species distribution models of the scenario of high emissions (RCP 8.5 W·m-2) will show a greater reduction of suitable area in comparison with the scenario of low emissions (RCP 4.5 W·m-2), as indicated by Fernández- Eguiarte et al. (2015b). Similar results will be slightly lower in conservative scenarios (Gómez-Mendoza & Arriaga, 2007; Hamann & Wang, 2006).
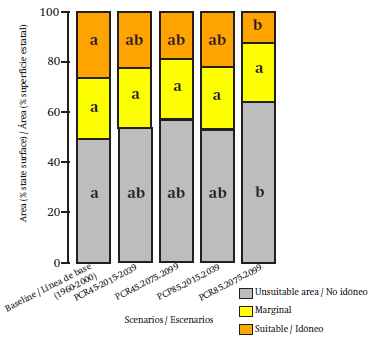
Figure 3 Means comparison of the potential distribution area of 12 species of Pinaceae in different periods and scenarios of Michoacán. Different letters in the rows are significantly different in accordance with the Tukey test (P = 0.05).
The estimation of the decrease of the suitable areas for the presence of A. religiosa is similar to what was found by Sáenz-Romero et al. (2012), who reported that the area will be reduced by more than 88 % in periods subsequent to the year 2050. The authors mention that one of the solutions to reduce the impact of climate change on the species distribution is assisted management, locating new localities 300 m above the current altitudinal benchmarks; however, this does not guarantee that the species that coexist (monarch butterfly and edible mushrooms) with A. religiosa will adapt to the new sites.
Due to the increase in temperature and the decrease in precipitation because of climate change, the distribution area of various Pinus species could decrease in areas with altitudes above 3,500 m and it will be necessary to transfer lower altitude species (3,000- 3,500 m) to these altitudinal heights (Viveros-Viveros et al., 2009). Gómez-Mendoza and Arriaga (2007) found that P. oocarpa is one of the species most vulnerable to climate change in the Mexican republic. According to these authors, the ideal area for P. oocarpa will decrease by 50 %; P. teocote is a species moderately sensitive to climate change, given that its surface area will decrease by 19 %; whereas P. douglasiana is a tolerant species, given that its distribution surface area will only decrease by 1 %. On the other hand, P. leiophylla must be closely studied given that its distribution is not only vulnerable to climate change, but also to some plagues such as Dendroctonus, categorized as a high threat in areas of the Trans-Mexican Volcanic Belt (Salinas-Moreno, Ager, Vargas, Hayes, & Zúñiga, 2010).
The three species that will be most affected by climate change, according to the close and far outlooks, are A. religiosa, P. leiophylla, and P. teocote. These species relate to communities of coniferous and oak forests, whose surfaces could also be affected by the change in soil use due to agricultural, forestry, and livestock activities (Figure 4); therefore, it is estimated that there will be a greater decrease in suitable potential distribution. This is the case with A. guatemalensis, given that the soils where it is commonly found are fertile, an important factor in the establishment of other plantations (Andersen, Córdova, Sørensen, & Kollmann, 2006). Nevertheless, Jantz et al. (2015) mention that the suitable potential distribution decreased from the year 1500 to 2005, where more than half of the natural vegetation was lost due to such activities. These authors estimate that for future RCP scenarios, more than 70 % of the natural vegetation will be lost due to logging.
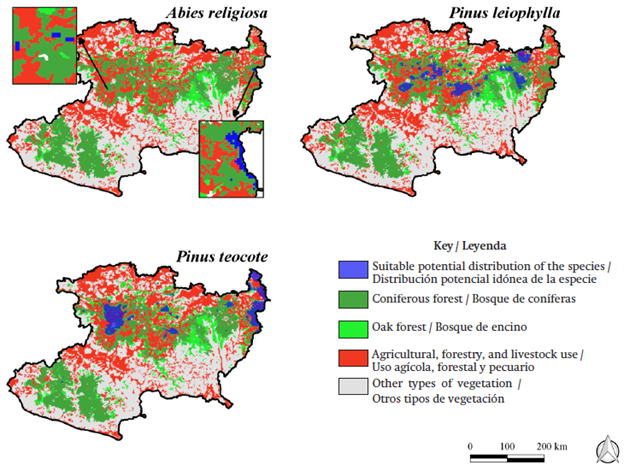
Figure 4 Suitable potential distribution of the species that will be most affected by climate change, under the RCP 8.5 2075-2099 scenario. Soil use and vegetation change polygons in accordance with the INEGI (2005).
Conclusions
Of the 27 climate, soil, and topography variables, only seven were utilized (maximum temperature of the warmest month, minimum temperature of the coldest month, annual temperature range, precipitation of the driest quarter, K, pH, and the digital elevation model) with greater significance on the species distribution modeling. The variables generated robust models in time and space, given that 85 % were considered good and extremely good in accordance with the values of the area under the curve. The potential species distribution models in function of the RCP 8.5 scenarios showed the greatest decrease of suitable distribution areas for pines and oaks. The species most affected by climate change will be A. religiosa, P. leiophylla, and P. teocote. Therefore, it is necessary to implement measures to adapt to climate change through assisted management, genetic variation, and plague resistance. The decrease of the ideal areas for the distribution of A. religiosa will be greater than 72 %, being the most affected of the evaluated species; if its population decreases, it will also affect the population of the monarch butterfly and the economy of the neighboring inhabitants who depend on the tourism attracted by the presence of the lepidoptera.

