


 text in
  English (pdf)
 Article in xml format
 Article references
 Send this article by e-mail
 Cited by SciELO
  Similars in
SciELO
Similars in
SciELO 
 Permalink
Introduction
Recently, events of meteorological and climatic extreme conditions have an important relevance due to the danger associated to them (Kunkel, 2003). Severe storms are a manifestation of extreme meteorological phenomenon since they affect certain sites with high risk rates (Kunkel et al., 1999; Ruby Leung & Qian, 2009). There is an analysis on the social and economic impact of extreme rainfalls that cause damages to infrastructures and affect people in general.
Since the beginning of this century, an increase in the trends of some extreme meteorological phenomena has been observed (Peterson et al., 2007), associated to maximum and minimum temperatures (Zhou et al., 2009), effects of precipitation such as impacts of tropical cyclone (Farfán et al., 2013), floods (Pineda-Martínez et al., 2014) and to tornados, to a lesser extent (León-Cruz et al., 2019). Although the impact of climate changes according to temperature variations and their trends associated to the increase of greenhouse gases (GHG) has been globally studied, precipitation is less associated to these changes due to its more heterogeneous behavior (Easterling et al., 2000; Kumar et al., 2013). This is mainly due to the fact that rainfall represents a parameter with an annual behavior less predictable than temperature, since it is related to global and regional circulation factors and local effects that make it more difficult to analyze. Heterogeneous spatial distribution of rainfall events and particularly of storms make it more complicated to have a monitoring of pluviometric networks that support the study of precipitation behavior at regional and local scales.
Nonetheless, nowadays there are diverse data sources capable of solving these deficiencies of observations, for instance, satellite information (Behrangi et al., 2009) and global models of re-analysis (Almazroui, 2016; Bekvsky & Karoly, 2007). Therefore, a greater temporal scale is required for the analysis of temperature and precipitation trends in order to establish behaviors based on these trends for longer periods of time.
Nevertheless, precipitation trends have been observed at global level, which show how maximum rainfalls in one-day and five-day are more frequent, in addition to marked regional patterns (Easterling et al., 2000). In the tropics, a decrease of high-impact tropical cyclones is observed in the Atlantic and an increase of storms and tropical cyclones in the Pacific (Cárdenas et al., 2016; Farfán et al., 2013; Meehl et al., 2009).
In North America, extreme precipitations trends have been studied, particularly in the monsoon region (Adams & Comrie, 1997; Cavazos & Rivas, 2004; Magaña et al., 2003). Some authors showed how there was a trend to increase precipitation in summer for periods prior to 1970 (Dominguez et al., 2008; Kumar et al., 2013). Precipitation increases are also associated with an increase and intensification of tropical cyclones (Curtis, 2008; Torres-Alavez et al., 2014). Some of the trends have been associated with climatic indices such as the Pacific Decadal Oscillation (PDO), in the 1970-2000 period (Groisman et al., 1999; Grumm & Hart, 2001; Pavia et al., 2006).
In the northern region of Mexico, precipitation is mainly seasonal, with a maximum during the summer months, from June to September, and it has been related to the intensification phase of the monsoon of Mexico (Adams & Comrie, 1997; Higgins, Chen et al., 1999). The impact of convective moisture transport of the eastern region of the Pacific toward the continent is known (Torres-Alavez et al., 2014; Vega-Camarena et al., 2018), which generates convection zones in the Sierra Madre Occidental. Convective storms are common in this region, which can be associated to an instability process due to the large moisture flux (Bhattacharya & Chiang, 2014; Dominguez & Kumar, 2008). On the other hand, storms and severe weather have a high potential risk in the formation of tornadoes, and in generating electric storms in the larger part of northern and northwestern Mexico; which is one of the most active in terms of Mesoscale Convective Systems (MCS) (Valdés-Manzanilla, 2015; Vega-Camarena et al., 2018). Because of this great potential of storms, the hypothesis on the lack of reports on tornadoes in Mexico was proposed in this work, for that region in particular, it results from the low population density and the low access to Internet connection. And particularly, the objective of analyzing extreme precipitations and severe storms was proposed, based on detection and instability indexes.
Material and Methods
Area of study
The area of study selected was in northern and northwestern Mexico (Figure 1), in the region influenced by the North American monsoon (Adams & Comrie, 1997). This region is characterized for presenting seasonal precipitation precisely associated to the intensifying summer months of the monsoon. It is worth noting that, despite presenting conditions of máximum peaks of convective rainfall and being a topographically complex zone of the Sierra Madre Occidental (SMO), there are few data about severe storms and what is more, few or almost no reports of tornadoes. León-Cruz et al., (2019) showed a database of tornado reports in Mexico, where the monsoon region is observed as one the regions with the least amount of reports.

Figure 1 Location map of the study area. The average precipitation data for summer months, June, July, and August (JJA) is shown. Tornado reports for the same period are also indicated.
León-Cruz (2019) showed the relation between population density and tornado reports of in Mexico, thus delimiting the central region of the country, where around 40 % of tornadoes activity in the country has been documented. By means of environmental parameters it is possible to identify regions of the country with a high instability potential but low reports density. In northern and northeastern Mexico, it is clear that a few or no reports about the core of the monsoon region have been registered (Figure 1). Proportionally to the center of the country, population density is lower in this region. In this sense, the distribution of tornadoes reports is in accordance to population density and to the access to technological sources. From this observation, the current study aimed to analyze, by means of data of surface observations and products of re-analysis, the space-time distribution of extreme events, its trends and its relation with the ones of instability potential.
Climatic data and detection indexes
In order to study the cases or extreme rainfall from climatic data, conventional stations of CONAGUA in charge of the Servicio Meteorológico Nacional (SMN, 2018) were selected, for the region of northwestern Mexico. Various selection criteria of these stations were considered. The selected stations had to have at least thirty years of data and gaps no longer than a year in the series between 1950 and 2015, to fulfill the conditions of homogeneity, which was realized through Rclimdex libraries; thereby 72 stations were selected for this study. From the data from the selected stations, extreme precipitation indexes were calculated based on detection indices from the Experts Team in Climate Change and Detection Indices (ETCCDI). The indices used were those of maximum precipitation in one-day (RX1day), maximum precipitation in five-day (RX5day), simple daily intensity index (SDII), and very humid days (R95P) (Zhang et al., 2004). Linear trends were also calculated for each one of the indexes.
ERA5 re-analysis and instability indexes
Data from the atmospheric ERA5 re-analysis were used for the instability environments (Hersbach et al., 2019). This group of data comprises the period from 1979 to present time, it was developed by Copernicus Climate Change Service (C3S), and recently replaced the ERA-Interim re-analysis (Berrisford et al., 2011). ERA5 provides estimations every hour (maximum temporal resolution) with a great amount of climate-atmospheric, terrestrial and oceanic variables. Re-analysis comprises the totality of the terrestrial surface in a quadrant of 30 km and divides the atmosphere in 137 vertical levels, from the surface to 80 km in height. For the present study, the monthly means of 40 years (1979-2017) of temperature and relative humidity variables at 500-hPa, 700-hPa, 850-hPa and 950-hPa were used.
Instability conditions in the atmosphere can be analyzed from different perspectives. One of the most common ways is from the construction of indexes. These indexes are designed by using simple equations based on the content of humidity and temperature of the air lots at different levels of the atmosphere. For this research work, K index (Kl) (George, 2014) and Gálvez-Davison index (GDI) (Galvez & Davison, 2015) were selected. Even though it is true that these indexes are commonly used for operative forecast, its calculation and analysis from the climatic perspective results useful for the identification of temporal patterns and for the localization of potential zones for the development of storms. The description and interpretation of each index were exposed in the corresponding section of results.
Results and Discussion
Detection indices
The value of detection indexes showed periods according to precipitation intensity. These periods resulted clearer when anomalies were observed (Figure 2). The simple daily intensity index of rainfall (SDII) is an indicator of total annual rainfall divided by the humid days, in other words, those in which precipitation is greater than 1 mm (Figure 2a). SDII gives a general idea of the most intense rainfall periods. For SDII, a very humid period was observed from 1950 to 1970, a less intense precipitation period from 1970 to 1999. That period coincided as well with a decrease in global temperature associated to natural forces like volcanic eruptions (Brown et al., 2008). The most recent period starting from the year 2000, an increase in precipitations was observed, in this case of intense rainfall events in one-day and 5-day (RX1day and RX5day) (Figure 2b). This has been reported for the southern region of the United States of America and northwestern Mexico (Castro et al., 2001; Cavazos et al., 2008; Cerezo-Mota et al., 2016). The behavior in these patterns of increasing rainfalls has been associated to effects caused by El Niño Southern Oscillation (ENSO) and quality phases of PDO for the region (Pavia et al., 2006). From 1994, an increase in strong precipitation was observed in regions of the Sierra Madre Occidental (García-Péz & Cruz-Medina, 2009).
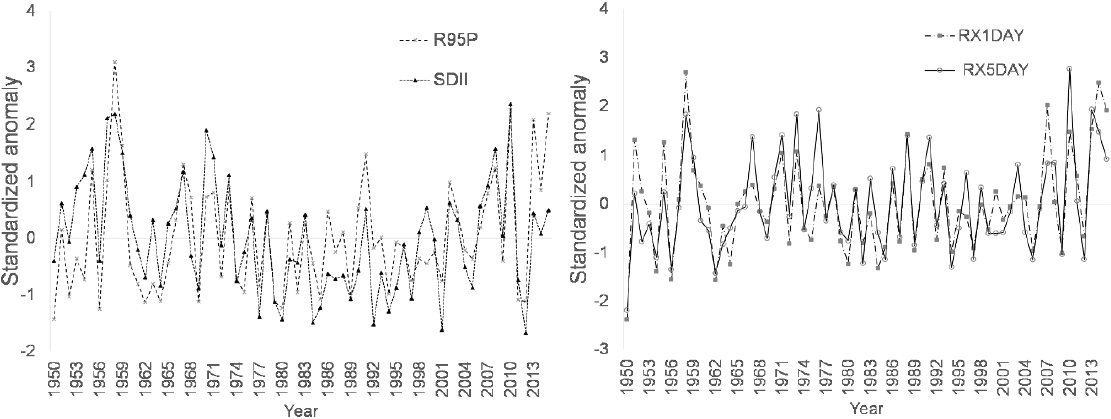
Figure 2 Standardized anomaly of the detection indexes calculated on the average of the 72 climatic stations for a) SDII and R95P b) Rx1day, Rx5day.
In the most recent period 1999-2015 the trends of rainfalls events were more frequent. These tendencies have been associated to a greater increase in sea surface temperature (SST), causing a greater quantity of vertical moisture flux which generated an increase in convective events (Valdéz-Manzanilla, 2015). These increases have not been uniform in the entire area, although significant increases in temperature were identified in the region (Cavazos et al., 2019); precipitation patterns presented the most heterogeneous patterns, perhaps more associated to topographic effects. Precipitation showed a negative trend in the whole region of northwestern Mexico (Figure 3), in agreement with other studies; with a negative anomaly and a decrease of -32 mm/decade, in the last 30 years (Cavazos et al., 2019).

Figure 3 Linear trends of the indices calculated for the climatic stations for: a) R95P, b) SDII, c) Rx1Day and d) Rx5Day. Red points indicate a statistically significant value at 5 %.
The increase in intense precipitation in one-day and 5-day showed a negative trend in the region of the SMO, in the larger part of northwestern Mexico, although it is interesting to observe that these trends are positive towards the eastern slope of the SMO in the states of Durango and Chihuahua (Figures 3c and 3d). This indicates a negative anomaly in the core zone of the monsoon, but with an increase in other regions towards the north and northeast.
Instability indexes
K index
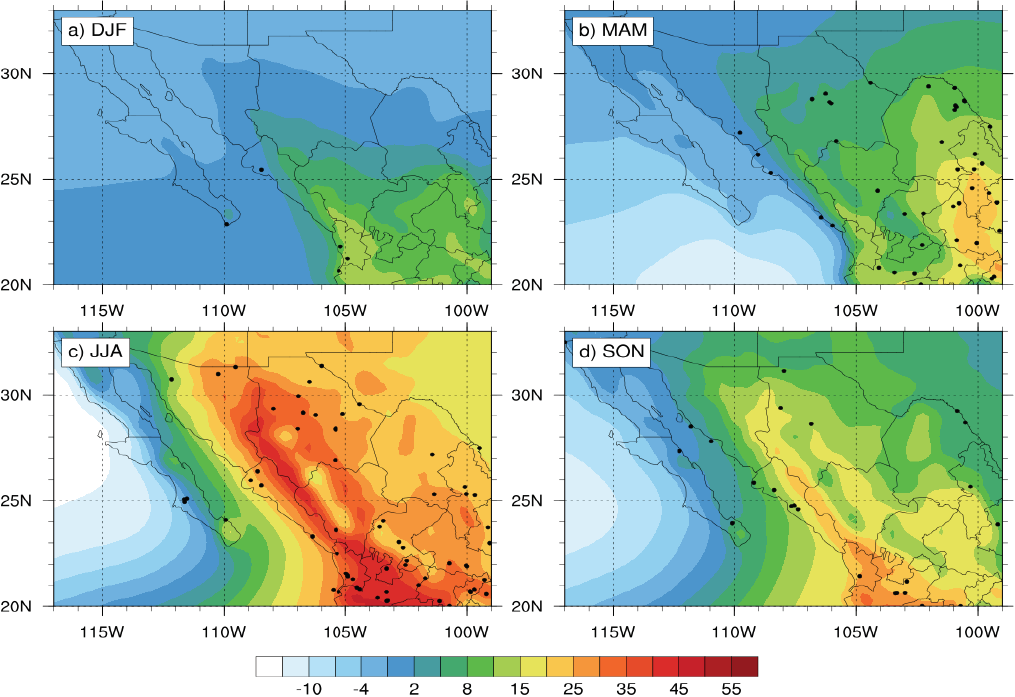
Instability K index defines the differences in temperature and dew point temperature at different levels of the atmosphere, particularly between 850 hPa and 500 hPa. Values of K lower than 20 indicate a low probability of storm formation, between 20-25 isolated events, from 26 to 30 very disperse electric storms, from 31 to 35 disperse events and greater than 35 intense storms.
During summer, maximum activities of K index were presented in Figure 4. These were aligned over the SMO and coincided with the topographic characteristics. In turn, this potential of instability was associated to humid flows of the Pacific. These conditions generated an increase in vertical flows and were related to the generation of convective storms. Results shown coincided well with what was expected by the conditions of the monsoon of North America and coincided with previous researches (Cerezo-Mota et al., 2016; Cortez Vazquez, 1999; Douglas et al., 1993; Higgins et al., 1999).
Galvez-Davison index
Another one of the most used indexes nowadays is Galvez-Davison index (GDI) (Figure 5). It was developed with the purpose of improving forecasting of the convection in the tropics. It seeks to highlight the important processes regulating convection in trade winds regimes, as well as improving the detailing of the favorable areas for convection obtained with the K index (Galvez & Davison, 2015). This index considers temperatures and mixing ratios at different levels of the atmosphere. For the analysis of the potential of formation of isolated storms and disperse deep convection it is associated to values between 25 to 35, from 35 to 45 it increases the potential of storms capable of producing strong precipitations and values higher than 45 are significant indicators of generalized storms.
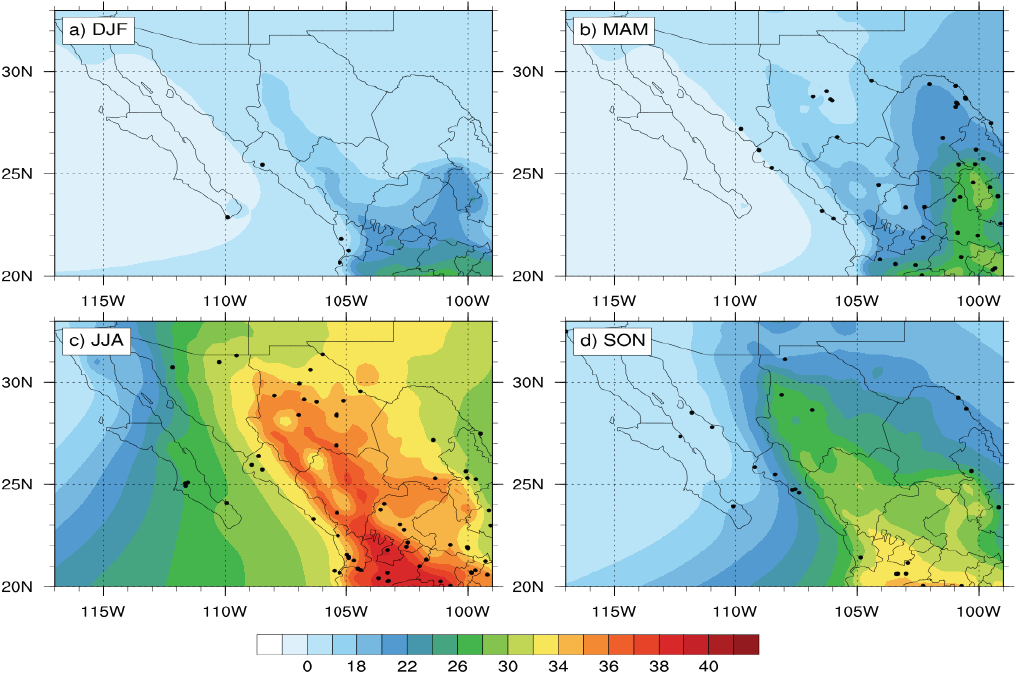
Figure 5 Seasonal variation (a) December, January, February (DEF), (b) March, April May (MAM), (c) June, July, August (JJA), and (d) September, October, November (SON) of the Gálvez-Davison Index (GDI). The black dots show the recorded tornadic activity for the same period time.
From the analysis of both instability indexes, it could be seen how the region of the SMO has a high potential for generating intense storms, just as registered in observed data. The highest values were registered also during the summer months JJA (Figure 4c and 5c), which coincided with the period of intensification of the monsoon. Due to the dynamics of the summer monsoon rains, high instabilities generated by the vertical high moisture flux (Englehart & Douglas, 2001). The values of both indexes (K and GDI), have been used for the estimation of instabilities in the atmosphere which is a promotor of tornadogenesis. From Figures 4 and 5, a greater correspondence of the number of tornado reports with high values in the indexes during summer can be observed.
Intensification mechanisms of precipitation in summer
The studied region has a high influence of the monsoon (Douglas et al., 1993; Cerezo-Mota et al., 2016). The effect of the increase of SST in May generated the beginning of the displacement of the atmospheric circulation at medium levels in a flow of the west in the northern part of the Gulf of California, to a change in an opposite sense in June. This generated a major moisture transport towards the continent causing the beginning of the development of monsoon close to the middle of June. This mechanism has been described as an effect because of the displacement of the Intertropical Convergence Zone (ITCZ) towards the northern hemisphere, causing a cyclonic circulation at low levels of the atmosphere which gives rise to vertical moisture flux in an increase of convective processes (Douglad et al., 1993; Cortez Vazquez, 1999). This convective activity in the Eastern Pacific coasts of Mexico as well as the Gulf of California, increases the amount of precipitation from June to September, with a greater incidence at the base of the Sierra Madre Occidental and decreasing towards the region of the Mexican Plateau (Englehart & Douglas, 2001; Vega-Camarena et al., 2018).
The major transport of vertical moisture by convection generates an increase in rainfalls (Douglas et al., 1993; Jana et al., 2018). Once this mechanism is established, it is also forced by a marked difference in surface temperature of the ocean and the continent (Torres-Alavez et al., 2014; Turrent & Cavazos, 2009). This land-sea thermal contrast causes moisture to be transported by advection towards the north and northeast in the Gulf of California towards to continent (Englehart & Douglas, 2001). This is one of the main mechanisms described as the effect of the monsoon in the regional precipitation of the Eastern Pacific of Mexican coasts. As well, it is known that this mechanism is affected by climatic indexes such as the Pacific Decadal Oscillation (PDO) (Pavia et al., 2006) and of El Niño South Oscillation (ENSO) (Magaña et al., 2003). The study region receives close to 70 % of rainfalls from June to September (Douglas et al., 1993), hence their importance in the management of hydric resources, risk prevention of floods and potentially severe weather. The region is also very productive of Mesoscale Convective Systems (MCS), these dynamics provide large moisture flux at middle and low levels of the atmosphere (Valdés-Manzanilla, 2014; Vega-Camarena et al., 2018). Nevertheless, the dynamics generate lower quantity of storms, and tornadoes, as observed in Figures 4 and 5. Finally, instability conditions decrease in September and October.
Conclusions
There is a high potential for generation of storms in the northwestern region of Mexico, due to a high flow of humidity in the summer months. These moisture flows are associated to the intensification of the monsoon, which in turn is driven by the displacement of ITCZ. A large part of these moisture flows are forced by a land-sea thermal contrast but highly canalized by topography as well. The values from the detection indexes associated to intense to extreme rainfall, R95P, RX1day and RX5day, showed a positive trend in the last decade. These trends are associated to an increase in sea surface temperature (SST). The spatial distribution of these trends was positive in the region of the SMO and with a negative anomaly in the core zone of the monsoon, but with an increase towards the northern and northeastern part of Mexico. Just like of the region of the Trans-Mexican volcanic Belt, topography plays an important role in the intensification of convection zones that generate severe storms and eventually tornadoes. The lack of operational monitoring of severe weather in Mexico makes it difficult to identify storms cores with the purpose of generating a better climatology of these types of events. Severe storms and events of tornadoes have been scarcely studied in Mexico. Severe storms associated to convective processes in Mexico have a highly topographic component. The configuration of topography in Mexico determines greatly the regions of high potential of development of severe electric storms and tornadoes. In these sense, more knowledge is required about the environmental conditions under which these phenomena are developed to generate better forecasting tools.

