


 text in
  English (pdf)
 Article in xml format
 Article references
 Send this article by e-mail
 Cited by SciELO
  Similars in
SciELO
Similars in
SciELO 
 Permalink
Introduction
Native grasslands and grazing areas of other types of vegetation are characterized by a ground cover in which herbaceous species of the Poaceae family predominate, from which 205 genera exist in Mexico, grouping 1,216 species (Dávila et al., 2018). Diverse studies proved that genera with higher presence in these areas are: Bouteloua, Aristida, Andropogon, Muhlenbergia, Sporobolus and Heteropogon, among others, having a ground cover between 7.3 % and 49.8 % of the surface, in the states of Chihuahua and Durango (Rodriguez-Maturino et al., 2017); as well as Boteloua gracilis and Muhlenbergia rigida in northeastern Jalisco, with a ground cover between 35 % and 40 % in areas with moderate grazing and between 5 % and 10 % in areas with overgrazing (Delgado-Balbuena et al., 2013).
Species of Bouteloua genus are among the most important grasses in the grasslands of Mexico, for their nutritional quality for livestock and for their ecological characteristics (Herrera et al., 2011), among them, Chino grass Bouteloua repens (Kunth) Scribn. & Merr and Navajiya grass Bouteloua gracilis (Kunth) Lag. Ex Griffiths, so that the last one has been included in grassland improvement programs for its outstanding fodder characteristics (Beltrán et al., 2010; Morales et al., 2009). In addition, Bouteloua genus stands out for its diversity with 37 species and 14 varieties in Mexico and sites have been found where plants of this genus produce up to 90 % of the vegetal biomass (Giuliani et al., 2014).
Results of studies indicated that changes in climate variables will appear in the next decades due to global warming in most of the Mexican territory and the planet (Durán et al., 2014; Ruíz et al., 2011, Zarazúa et al., 2011); among these changes, temperature and rainfall stood out, due to the fact that they are climatic determinants for plants physiological processes, which is markedly evidenced in the net primary productivity of the ecosystems (Pérez-Ramos et al., 2012).
Climate is a determinant of primary productivity in these ecosystems, so that climate change will have an effect on vegetal communities by modifying in turn services and products provided by these areas (Sage & Zhu, 2011; Reeves et al., 2014), which has motivated studies to evaluate the impact of climate change in vegetal communities. Regarding this, Bocksberher et al. (2016), when analyzing the distribution of 302 Gramineae species, found that precipitation was the variable that exercised the highest influence over the distribution of species and that adaptation in dryer environments was given by the smallest size of plants and by type C4 photosynthetic pathway; on the other hand, Martinson et al. (2011) reported that Bouteloua species showed a negative relation to precipitation, which suggested an adaptive advantage to dry conditions. This current research work was realized with the purpose of analyzing the impact of climate change in areas with environmental fitness for B. gracilis and B. repens Gramineae in Mexico.
Material and Methods
The study was carried out by using Maximum Entropy Principle (Philips et al., 2009), referred to as Maxent, to model the ecological niche and predict the area with environmental fitness (EF) for B. gracilis and B. repens Gramineae; this model has been widely used to estimate potential distributions of vegetal species in general (Durán et al., 2016; Franklin et al., 2013) and for gramineae (Meneses et al., 2014), based on the most significant environmental conditions, using only presence data of the species.
The study included the analysis of reference and future climates data obtained from WorldClim portal, version 2 (Fick & Hijmans, 2017), corresponding to the Geophysical Fluid Dynamics Laboratory Coupled Model 3 (G FDL-CM3); data from 1960-1990 period were used as a reference climate and from 2041-2060 and 2061-2080 periods, later referred to as 2050 and 2070 periods, respectively, with a spatial resolution of 30 seconds of terrestrial arc (Hijmans et al., 2005). Likewise, representative concentration pathways (RCP) of 4.5 and 8.5 W m-2 were used in the simulation (Van Buuren et al., 2011).
From worldwide climate data obtained, those corresponding to Mexico were extracted and were manipulated by means of layers in raster format, using ArcMap 10.2 application, later data were transformed into ASCII format, to obtain the layers of environmental variables with the Idrisi Selva 17.0 system (Eastman, 2016). Resulting layers were in turn analyzed using the Maxent model in order to analyze the areas with EF for B. gracilis and B. repens species.
The analysis of potential distribution of both species performed with the Maxent program was based on geographic references provided in decimal degrees of latitude and longitude, from the sampling sites of both species. Five hundred one geographical references of B. gracilis and 451 of B. repens were used, which were obtained from Global Biodiversity Information Facility (GBIF, 2017).
The model used in Maxent included the analysis of 28 environmental variables: annual accumulated precipitation (mm), accumulated precipitation from May to October (mm), accumulated precipitation from November to April (mm), accumulated precipitation from December to February (mm), precipitation of the most humid month (mm), precipitation of the driest month (mm), annual maximum temperature (ºC), maximum temperature from May to October (ºC), maximum temperature from November to April (ºC), annual mean temperature (ºC), mean temperature from May to October (ºC), mean temperature from November to April (ºC), mean temperature of the warmest month (ºC), mean temperature of the coldest month (ºC), annual minimum temperature (ºC), minimum temperature from May to October (ºC), minimum temperature from November to April (ºC), photoperiod from May to October (H), photoperiod from November to April (H), annual humidity index (mm), humidity index from May to October (HI), humidity index from November to April (HI), humidity index from December to February (HI), annual thermal oscillation (ºC), thermal oscillation from May to October (ºC), thermal oscillation from November to April (ºC), thermal oscillation from December to February (ºC) and soil texture.
Maxent model was adjusted to 25% of data for the randomized test and 75% for the training, 10 repetitions with the cross-validation test and 2500 interactions for convergence; also in addition, Logistic output format and Jackknife test were required for analyzing the importance of each environmental variable. Given that the results obtained with Maxent algorithm were under the influence of the sampling sites with which the program was supplied (Philips & Dudik, 2008; Elith et al., 2011), establishing a threshold value was required to estimate the areas with EF for each species (Norris, 2014; Liu et al., 2016), so that a Fixed cumulative value 10 logistic threshold was used in this study (in the Maxent model). Areas with EF obtained with Maxent were examined with Idrisi system and maps were generated with values corresponding to this threshold, from data produced by the application of the model in the reference climate and each scenario of climate change.
Areas occupied by water bodies and urban centers were excluded in the calculation of the potential surface of distribution of both species; these thematic layers were obtained by means of the map of the use of soil and vegetation (INEGI, 2009).
Results and Discussion
Model fixing
In the present research, values of the receiver operating characteristic curve or ROC curve, which represents sampling data fixing, were of 0.957 for B. gracilis in all climatic scenarios and of 0.928 to 0.930 for B. repens (Table 1), the training data curve and the test data curve were closed to each other, which indicated that there was no omission error (Hernández et al., 2018). Data were in accordance with the value of 0.946 obtained in another research for B. curtipendula (Martinson et al., 2011). Values obtained with this model were satisfactory, and indicated the advantage of classifying areas with environmental fitness of both species (Parolo et al., 2008).
Table 1 Area under the curve (AUC) values and standard deviation (SD) for Bouteloua gracilis and B. repens on reference climate and four climate change scenarios in Mexico.
| Climate period | B. gracilis | B. repens |
|---|---|---|
| 1960-1990 | 0.957 ± 0.006 | 0.928 ± 0.010 |
| rcp 4.5/2050 | 0.957 ± 0.007 | 0.930 ± 0.009 |
| rcp 4.5/2070 | 0.957 ± 0.007 | 0.930 ± 0.010 |
| rcp 8.5/2050 | 0.957 ± 0.007 | 0.930 ± 0.010 |
| rcp 8.5/2070 | 0.957 ± 0.007 | 0.929 ± 0.010 |
Climate change in Mexico
The analysis of annual mean temperature predicted that there will be an increase of 2.8 and 3.4 ºC in 2050 and 3.4 and 5.0 ºC in 2070, with rcp 4.5 and rcp 8.5, respectively. These results were in agreement with previous studies, as referred by Ruiz et al. (2011) and Durán et al. (2014), who consigned an increase in temperature between 1.8 and 3.3 ºC in several areas of Mexico and by Galindo et al. (2014), who mentioned an increase of 2.5 ºC.
It was important to point out that changes in annual minimum temperature and annual maximum temperature will be different for each geographic region, with a general tendency to be more marked in arid and semiarid regions than in temperate and tropical regions; In the present study, results showed an increase in maximum temperature and in the frequency of future scenarios; with the reference climate, the peak of maximum temperature was of 30 ºC with a frequency of 12.3 %; it is forecasted that in 2050 it will raise to 33 ºC with a frequency of 14.6 % and to 34 ºC with a frequency of 15.2 %, and for 2070 it will raise to 35.0 ºC with a frequency of 15.1 % and 36.0 ºC with a frequency of 17.3 % with rcp 4.5 and rcp 8.5, respectively. Minimum temperature will also raise in future scenarios, although frequency will not change; with rcp 4.5 temperature will increase by 2.25 ºC in 2050 and by 2.65 ºC in 2070, and with rcp 8.5 it will increase by 2.73 ºC and 4.11 ºC.
Results for annual precipitation showed that there will be a decrease of 3.1% in 2050 and 7.0% in 2070, with rcp 4.5; and of 6.5% and 14.4 with rcp 8.5. In this regards, in other studies, results showed that precipitation in Mexico will decrease from 2 to 12% in the same period (Durán et al., 2014), between 3.8 and 4.5% (Ruíz et al., 2011), and by 10% (Galindo et al., 2015). These changes will be present mainly in the zones with precipitation lower than 600 mm; the study also forecasted that there will be slight increases in the zones with annual rainfall higher than 2000 mm; in these zones, native vegetation of xerophilous thickets and natural grassland largely proliferated, and they were mainly located in the center, northeast and northwest of Mexico. Given the aforementioned, a lower availability of humidity in the soil, along with an increase in annual mean temperature, in grassland areas would cause alterations in the structure and in the net main productivity (Edwards & Smith, 2010; Martinson et al., 2011; Bocksberger et al., 2016).
Areas with environmental fitness
Areas with EF for estimated B. gracilis, were mainly distributed in the Mexican Altiplano region (Figure 1, left side), mainly located in Chihuahua, Durango, Zacatecas, Aguascalientes and Guanajuato, northern part of Jalisco, southern Coahuila, southern Nuevo Leon and small zones in Queretaro, Hidalgo, Estado de Mexico, Morelos and Puebla. Generally, native vegetation of these areas is grassland and/or xerophilous thickets. Results of the study were congruent with the areas of distribution for the species, described by Cortés et al. (2013), who indicated that the areas with higher probability for the presence of B. gracilis had between 400 and 800 mm of annual precipitation and annual mean temperature of 13 to 19 ºC; as well, the areas defined in the present study were in accordance with the areas of distribution (Coahuila, Nuevo Leon and Tamaulipas) pointed out by Herrera et al. (2008).
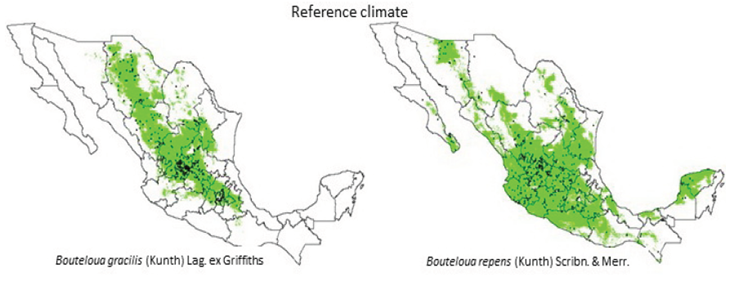
Figure 1 Area with environmental aptitude for Bouteloua gracilis (left side image) and B. repens (right side) on the reference climate. The dots indicate collect sites for both species.
On the other hand, B. repens (Figure 1, right side) had a wide distribution in the central region of the country, since it covered a great part of the surface of the states of Jalisco, Aguascalientes, San Luis Potosi, Guanajuato, Colima, Michoacán, Queretaro and Hidalgo, a lesser proportion in the north of Chihuahua, southern Durango, center and south of Nuevo Leon and southern Tamaulipas; small areas in the states of Guerrero, Oaxaca, Veracruz, Quintana Roo, Yucatán and Baja California Sur. The wide surface with EF for B. repens can be due to the fact that it was distributed in open grassland fields, plains and/or slopes in sandy and rocky soils, in oak and pine woodlands, grasslands and xerophilous thickets (Herrera et al., 2008), conditions presented by a great part of the Mexican territory.
Results of this research work predicted that climate change will also cause modifications on the distribution of areas with EF, so that areas of expansion, constriction or distribution management of the species under study will appear (Table 2), in some zones of the country (Figure 2). This was in accordance with what was mentioned by Hu et al. (2015), where they reported that the rates of climate change will dramatically affect community groups and biodiversity in tropical zones of the Earth.
Table 2 Area with environmental aptitude for Bouteloua gracilis and B. repens on reference climate and relative change (%) in four scenarios of climate change in Mexico.
| Climate scenarios |
B. gracilis (km2) |
% |
B. repens (km2) |
% |
|---|---|---|---|---|
| 1960-1990 | 385,305 | 100.0 | 714,837 | 100.0 |
| 4.5/2050 | 420,407 | 109.1 | 832,732 | 116.5 |
| 4.5/2070 | 414,051 | 107.5 | 829,877 | 116.1 |
| 8.5/2050 | 419,214 | 108.8 | 828,168 | 115.9 |
| 8.5/2070 | 409,327 | 106.2 | 810,655 | 113.4 |
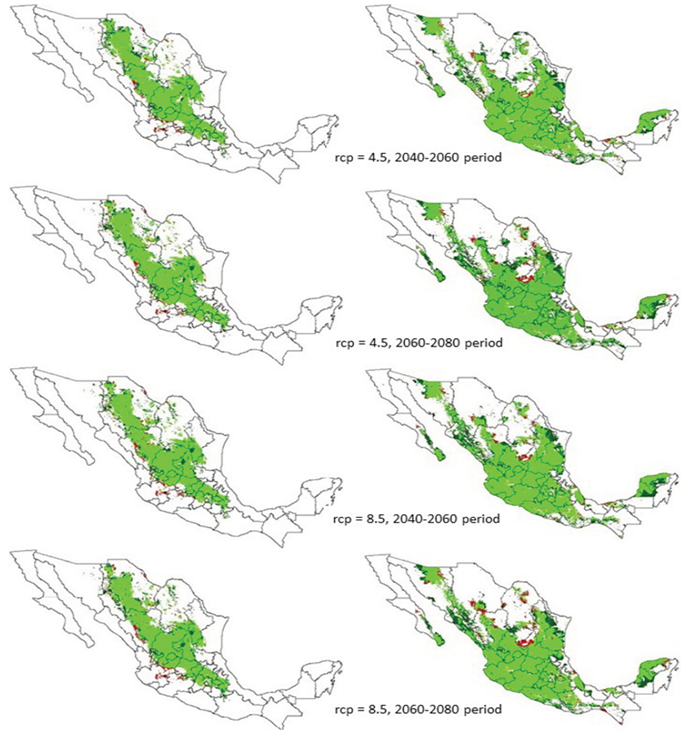
Figure 2 Area with environmental aptitude for Bouteloua gracilis (left side) and B. repens (right side) in Mexico due to climate change efect with rcp 4.5 and 8.5, on 2050 and 2070 periods. New area is showed in dark green and lost areas in orange color.
The increase in the area with EF for B. gracilis and B. repens could be explained by the fact they both have C4 photosynthetic pathway (Ogle, 2003; Giraldo-Cañas, 2010), which gave them advantage for prospering and predominating in grassland ecosystems, due to their efficiency between 1.3 and 4.0 times greater in water use and in nitrogen use, in comparison with C3 plants (Ghanoum et al., 2011; Wi et al., 2012; Polley et al., 2014).
Environmental variables that greatly contributed to explain the distribution of B. gracilis and B. repens.
Results from this study showed that the environmental variables that contributed to explain the distribution of B. gracilis were: thermal oscillation from November to April, precipitation of the most humid month and photoperiod from October to April. For B. repens, precipitation of the most humid month and photoperiod from November to April were the variables that most contributed to the distribution of the species.
In addition, Jackknife test of Maxent model analyzed the individual importance of each variable, which contributed to identify the variables that had important effects when the effect of other variables was excluded (Elith et al., 2011); thus, for Bouteloua gracilis the most important individual contribution were minimum temperature from May to October and annual minimum temperature (Figure 3, upper part), with a favorable effect with temperatures between 7 and 13 ºC, less favorable effect between 3 and 7 ºC and clearly unfavorable effect for the species over 13 ºC. Photoperiod was the main environmental variable for Bouteloua repens (Figure 3, upper part) with greater influence in the period from November to April (Figure 3, lower part) with a photoperiod of 11 of daylight in the cold and little rainy months of the year, followed by the annual aridity/humidity index between 0.3 and 0.7, which corresponded to semiarid and subhumid-dry categories, according to UNEP’s classification (1997).
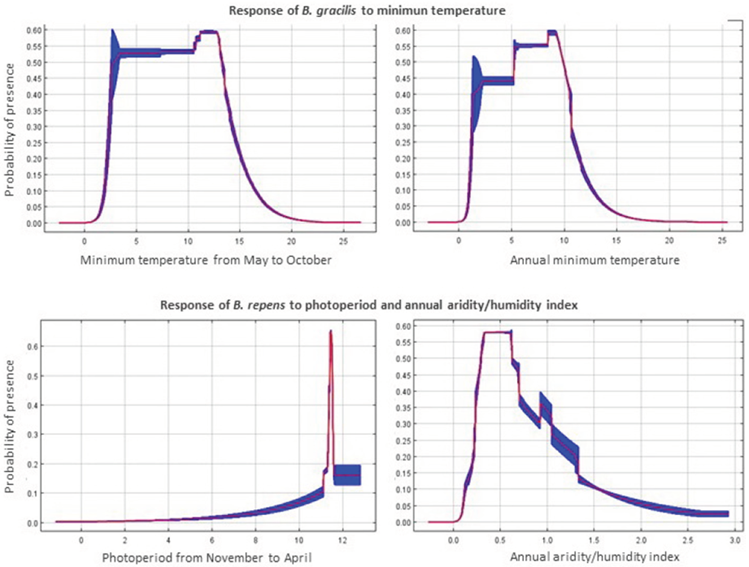
Figure 3 Main environmental variables explaining the Bouteloua gracilis presence (top figures) and B. repens (bottom figures) on reference climate. Red line show the answer zone for the variable and blue zone show the standard deviation.
It is important to highlight that results from this study referred to the potential distribution of B. gracilis and B. repens in relation to environmental variables, but without taking into account ecological factors of the community that will also be modified by climate change. Altering seasonal patterns of rain could directly affect plants composition and phenology, as well as indirectly and significantly affect interactions between plants and competition for available resources (Prevey & Seastedt, 2015).
Conclusions
The analysis of climate change indicated that there will be a raise in the annual mean temperature of 2.8 ºC and 5.0 ºC in relation to the reference climate, and an annual accumulated decrease of precipitation between 3.1 % and 14.4% in future scenarios; these changes will be present mainly in the zones with annual precipitation lower than 600 mm in the reference climate.
The area with environmental fitness for Bouteloua gracilis will increase between 6.2 % and 9.1 % and between 13.4 % and 16.5 % for Bouteloua repens, in 2050 and 2070 respectively.
The ecological descriptors that together contributed to explain to a great extent the changes in areas with environmental fitness were thermal oscillation, precipitation of the most humid month (September), photoperiod and minimum temperature of the most humid period.

