


 text new page (beta)
 English (pdf)
 Article in xml format
 Article references
 Send this article by e-mail
 Cited by SciELO
  Similars in
SciELO
Similars in
SciELO 
 Permalink
Introduction
The bobcat (Lynx rufus) is distributed from southern Canada through the United States of America (U.S.A.) to southern México. This felid is present in about 80 % of the Mexican territory, with records from 27 of México’s 32 states. The bobcat inhabits many ecosystems including desert, mesquite-grassland, thorn forest, tropical deciduous forest, and pine-oak forest (Hall 1981; Barcenas and Romero 2014). Estimating densities and population sizes is crucial to understanding the ecology and conservation needs of wildlife. Bobcat densities reported for the U.S.A. vary from 0.05 ind/km2 in southeastern Idaho to 0.58 ind/km2 in South Carolina (Rolley 1985; Heilbrun et al. 2003). In México, the bobcat is considered the most abundant wild felid (Leopold 1959), and about 35 % of the bobcat’s distribution lies in México (Hall 1981). However, there is no published information available about densities of this wild cat in México. The aim of this study was to document bobcat density throughout México to determine whether a similar abundance pattern occurs there as in the U.S. We hypothesize that bobcat densities will vary along its distribution, with higher densities in northern México and lower densities in southern México. The results of this study will be useful to inform conservation and management policy and will help secure the long-term survival and sustainable management of the species.
Methods
This study was carried out at six sites in México. Sites are listed in a north-south gradient, as shown in Figure 1. 1) Sierra Seri, Sonora, in the Sonoran Desert, is characterized by columnar cacti, microphyllous shrub, succulent scrub, scarce annual precipitation of around 400 mm, and extreme temperatures with a very arid climate. Average temperature is 21 ºC and summer temperatures may reach 48 °C. Elevation is 100 to 300 masl. 2) Janos, Chihuahua, is covered by mesquite-grassland and small patches of riparian vegetation, annual precipitation is 500 mm, and climate is arid-dry (García 1981). Average temperature is 16 ºC and elevation is 900 to 1,200 masl. 3) San Ignacio, Sinaloa, on the pacific coastal plain, is characterized by tropical dry forest, with an annual temperature of 21 to 24 °C, dry climate, and elevation 0 to 100 masl. 4) Monte Grande, in Sierra Fria, Aguascalientes, is characterized by a mixed forest dominated by Quercus spp. and Arctostaphylos pungens. Annual temperature is 11 to 18 °C, climate is humid temperate, and elevation is 1,800 to 2,200 masl. 5) San Miguel Topilejo, México City, is a region covered by pine-oak and pine-tufted grassland, with an annual temperature of 4.5 to 11 °C, precipitation averaging 1,200 mm, and elevation 2,700 to 3,000 masl. 6) Acatlán de Osorio, Puebla, is characterized by tropical thorn forest mixed with disturbed tropical deciduous forest, and elevation is 1,000-1,300 masl. The climate is arid-dry, with an average annual rainfall of 652 mm and annual temperature of 22 °C (García 1981).
Visits to each site were carried out between 2005 and 2007. The first visit was to confirm the presence of bobcats at each site by recording tracks and feces. The next two visits were carried out in the dry season (March-June) and in the rainy season (July-October). Camera traps were active for 15 to 20 days during each site visit. Sinaloa and Puebla were visited only once each during the dry season. We added these two sites at the end of the study to increase representation of the southernmost extreme of the species’ range and to sample two additional habitats: tropical deciduous forest and tropical thorn forest mixed with tropical deciduous forest. At each site, 20 camera-trap stations were activated for a period of 15 to 20 days per season (wet and dry), for a total of 30 to 40 days at each site (except Sinaloa and Puebla). The cameras were deployed at one site and then moved sequentially to all other sites. Twelve CamTrakker® Ranger and 8 Stealth Cam® TM analog 35 mm cameras were used; each had a white flash and used film with only 36 images per roll. Camera traps were checked every 4 to 8 days to replace film and batteries. Half of the trapping stations were set with double cameras (to capture both flanks of the animals) and half were set with single cameras. Trapping stations were 800 to 1,000 m apart, thereby covering an area of approximately 10 km2 at each site.
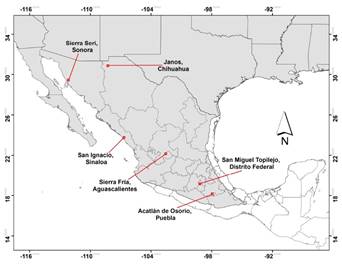
Figure 1 Location of the 6 sites where bobcat density was estimated. Gray shading represents the known bobcat distribution in México (Hall, 1981).
For individual identification of the bobcats, we used a combination of distinguishing characters including the patterns of rosettes, spots, and stripes on flanks, banding patterns of tails, marks on their faces, and sex, as recommended in Heilbrun et al. (2003). We estimated densities using the number of photographed and re-photographed individual bobcats using the software CAPTURE (Otis et al. 1978). CAPTURE estimates the size of monitored populations through the following steps: 1) tests that capture and recapture assumptions were not violated, including whether the monitored population behaved as a closed population; 2) checks the capture history (data) with various statistical tests (null model, catch heterogeneity model, catch response model, temporal variation model in catch probability, and the combination of all these models), to determine which model is the most appropriate for those data; and 3) estimates the probability of capture and the population size or the absolute abundance (N), with standard error and a confidence interval. The size of the effective sampling area was calculated by two methods: the first method considered a circular buffer around each camera trap station, with radius of half the mean maximum distance moved (1/2 MMDM) among multiple captures of individual bobcats during the sampling period (Wilson and Anderson 1985); the second method considered a circular buffer around each camera trap site but the radius was the mean maximum distance moved (MMDM) among multiple captures of individual bobcats during the sample period (Soisalo and Cavalcanti 2006).
In combination with the density estimates obtained at each site and MaxEnt (Phillips et al. 2006), the potential habitat available was calculated for each site. First, an ecological model for the entire bobcat range in México was constructed with 530 GBIF bobcat records plus our own observations, and 23 continuous variables (19 of worldclim, plus vegetation of México, slope, topography, and elevation). The cells were 0.01 km2 for each grid. We used 50 % of the records to construct the model and 50 % were used for validation of the model. Also, the proportional contribution of each variable was calculated with a Pearson correlation analysis using program R to calculate their weight in the bobcat distribution model (R Core TEAM 2015). Using the best model, the size of each polygon, and estimated bobcat density, we predicted the number of bobcats present in each studied area.
Results
With an effort of 2,070 camera trap days, we obtained 41 bobcat photographs. Bobcats, like other spotted or striped cats, can be identified individually by their coat pattern (Figure 4). Density analysis was made using 35 photographs; six photographs were only a tail or a foot and thus not useful to identify individuals (Table 1). Densities varied from 0.053 to 0.523 bobcat/km2 in the rainy season to 0.174 to 0.536 bobcats/km2 in the dry season (Table 2). The most robust model in most cases was model heterogeneity (Mh; Table 1). Janos, Chihuahua, had the highest reported density at 0.536 bobcat/km2, and San Miguel Topilejo, Distrito Federal, had the lowest reported density at 0.053 bobcats/km2 (Table 2). In Monte Grande, Sierra Fria, Aguascalientes, in 540 trap-days we did not obtain any bobcat records. Instead, we obtained 21 photographs of mountain lions (P. concolor) and the first record of ocelot (Leopardus pardalis) for the state of Aguascalientes (Barcenas and Medellin 2010).
Table 1 Number of captures and recaptures of bobcats identified in each season and site, the best-fit model selected by CAPTURE, and the probability of capture in each sample. M (h) is the heterogeneity model, M (bh) is the behavior/heterogeneity model, and M(0) is the null model.
| Site | Season | Model selected | Estimated probability of capture | Bobcats_ID | Capture/recaptures |
|---|---|---|---|---|---|
| Janos, Chihuahua | Rainy | M (h) 1.00 | 0.0771 | Chi_1 | 4 |
| Chi_2 | 2 | ||||
| Chi_3 | 1 | ||||
| Dry | M (h) 1.00 | 0.0606 | Chi_1 | 3 | |
| Chi_4 | 1 | ||||
| Chi_5 | 1 | ||||
| Sierra Seri, Sonora | Rainy | M (bh) 1.00 | 0.1000 | Son_1 | 2 |
| Son_2 | 1 | ||||
| Dry | M (h) 1.00 | 0.0426 | Son_3 | 4 | |
| Son_4 | 1 | ||||
| Son_5 | 1 | ||||
| Son_6 | 1 | ||||
| Topilejo, D. F. | Rainy | M (h) 1.00 | 0.1250 | Top_1 | 2 |
| Top_2 | 1 | ||||
| Top_3 | 1 | ||||
| Acatlán, Puebla | Rainy | M (h) 1.00 | 0.1333 | Pue_1 | 3 |
| San Ignacio, Sinaloa | Rainy | M (0) 1.00 | 0.1074 | Sin_1 | 4 |
| Sin_2 | 1 | ||||
| Sin_3 | 1 |
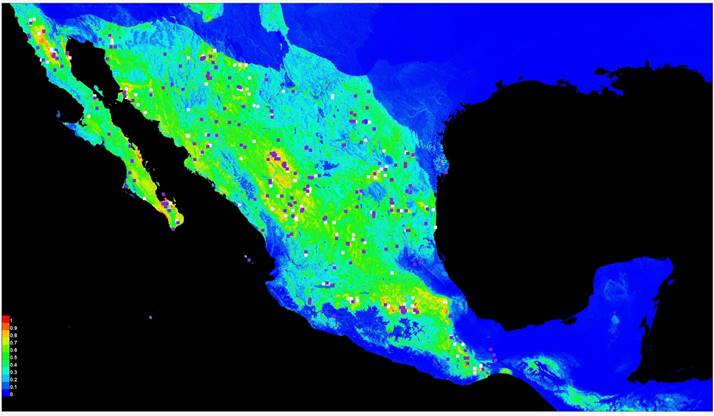
Figure 2 Potential distribution of bobcats in Mexico as predicted by Maxent model based on 530 GBIF records plus our own observations. White squares represent 50 % of the 530 GBIF records and were used to build the model, and purple squares are the other 50 % that were used to validate the model.
The MaxEnt ecological niche model obtained for all the distribution is depicted Figure 2. The model showed an area under the curve (AUC) of 0.843. Correlations were calculated using cor.test in R package stats (R Core TEAM 2015) and show that five variables contributed approximately 60 % of the total variance: vegetation type (21.6 %), precipitation of the driest trimester (11.8 %), annual range in temperature seasonality (11.1 %), isothermality (8.7 %), and mean temperature of the coldest quarter 5.7 %; www.worldclim.org). After the ecological niche was defined, the calculated abundances were extrapolated to estimate the population size in each area (Figure 3). The largest area estimated by MaxEnt was San Miguel Topilejo with 16,663 km2 and 883 to 2,066 bobcats, and the smallest area but with the highest density was in San Ignacio, Sinaloa, with only 1,861 km2 and an estimated population of 592 to 890 bobcats (Table 3).
Table 2 Bobcat (Lynx rufus) density estimates by site and season in México.
| Site | Season | Density | Effective area (km2) | Density (bobcats/km2) | ||
|---|---|---|---|---|---|---|
| CAPTURE | Wilson and Anderson (1985) | Soisalo and Cavalcanti (2006) | Wilson and Anderson (1985) | Soisalo and Cavalcanti (2006) | ||
| Janos, Chihuahua | Rainy | 5 (se ± 1.96) | 9,558 | 16,448 | 0.523 (se ± 0.205) | 0.303 (se ± 0.119) |
| Dry | 5 (se ± 1.99) | 9,328 | 16,156 | 0.536 (se ± 0.123) | 0.309 (se ± 0.213) | |
| Sierra Seri, Sonora | Rainy | 2 (se ± 0.0004) | 13,858 | 26,316 | 0.144 (se ± 0.00002) | 0.075 (se ± 0.00001) |
| Dry | 4 (se ± 2.51) | 12,515 | 22,932 | 0.319 (se ± 0.200) | 0.174 (se ± 0.109) | |
| Topilejo, D. F. | Rainy | 3 (se ± 1.38) | 24,070 | 56,564 | 0.124 (se ± 0.057) | 0.053 (se ± 0.024) |
| San Ignacio, Sinaloa | Rainy | 3 (se ± 1.07) | 6,575 | 11,428 | 0.478 (se ± 0.162) | 0.318 (se ± 0.093) |
| Acatlán, Puebla | Rainy | 1 (se ± 0.00) | 8,160 | 15,289 | 0.122 (se ± 0.000) | 0.065 (se ± 0.000) |
Discussion and Conclusions
The densities reported in this study suggest the density patterns in the general bobcat range (Table 4). We speculate that the highest densities of this species are found in northern México, close to the middle of the species range, and densities decline towards the southern end of the species range. This can be related to the optimal ecological niche hypothesis (Hutchinson 1958), in this case apparently located in the area between northern México and the southern U.S.A. The México-U.S.A. border wall will very likely disrupt bobcat dispersal and movements, because the gap between the bollards (steel beams) is 100 mm and the bobcat zygomatic breadth is 84.2 to 107.1 mm (Hall 1981). Only the smallest bobcats would be able to squeeze between bollards, and adult bobcats probably will not be able to cross the border wall. Given our result of the high density in northern México, this restriction in movements will reduce bobcat genetic flow between México and the U.S.A.
Table 3 Minimum and maximum bobcat population size in each area as estimated by MaxEnt.
| Site | *Density estimating bobcats /km2 | Estimation area by MaxEnt (km2) | Number of bobcats in the estimate area | ||
|---|---|---|---|---|---|
| Minimum | Maximum | Minimum | Maximum | ||
| Janos, Chihuahua | 0.309 (se ± 0.213) | 0.536 (se ± 0.123) | 4,033 | 1,246 (se ± 859) | 2,161 (se ± 496) |
| Sierra Seri, Sonora | 0.174 (se ± 0.109) | 0.319 (se ± 0.200) | 8,849 | 1,540 (se ± 964) | 2,823 (se ± 1,779) |
| San Ignacio, Sinaloa | 0.318 (se ± 0.093) | 0.478 (se ± 0.162) | 1,861 | 592 (se ± 173) | 890 (se ± 144) |
| San Miguel Topilejo, D.F. | 0.053 (se ± 0.024) | 0.124 (se ± 0.057) | 16,663 | 883 (se ± 399) | 2,066 (se ± 949) |
| Acatlán de Osorio, Puebla | 0.065 (se ± 0.000) | 0.122 (se ± 0.000) | 10,446 | 679 (se ± 0.00) | 1,274 (se ± 0.00) |
Prior to this study, there were no data on bobcat density or abundance in México. In the U.S., bobcat densities vary from 0.05 to 0.58 bobcat/km2. Our data from five Mexican locations show a very similar density variation, between 0.05 to 0.53 bobcat/km2. In fact, our highest density estimates in Janos, Chihuahua, in dry (0.309 to 0.536 bobcat/km2) and rainy (0.303 to 0.523 bobcat/km2) season, and in San Ignacio, Sinaloa, in wet season (0.478 bobcat/km2) are within the five maximum densities reported for bobcats in the U.S. and second only to the density reported from South Carolina (0.318 to 0.478 bobcat/km2; Marshall 1969). It is important to highlight that the highest bobcat densities reported in the southern U.S.A. are similar to the highest densities reported from northern México, indicating likely suitable conditions for this species and providing robustness to our data (Table 4).
Table 4 Comparison of bobcat abundance estimates from the United States and those reported in this study.
| Site | Bobcats/ km2 | Methods | References |
|---|---|---|---|
| South Carolina | 0.58 | Telemetry | Marshall 1969 |
| Northeastern California | 0.5 | Telemetry | Zezulak 1998 |
| Welder Wildlife Foundation Refuge in southern Texas | 0.43 | Camera trap | Heilbrun et al. 2003 |
| Coast Range, California | 0.39 | Camera trap | Larrucea et al. 2007 |
| Reservation Creek in California | 0.35 | Camera trap | Larrucea et al. 2007 |
| San Ignacio, Sinaloa (dry) | 0.318-0.478* | Camera trap | This study |
| Janos, Chihuahua (dry) | 0.309-0.536* | Camera trap | This study |
| Janos, Chihuahua (wet) | 0.303-0.523* | Camera trap | This study |
| Sacramento Valley in California | 0.27 | Camera trap | Larrucea et al. 2007 |
| Southeastern Illinois | 0.27-34 | Telemetry | Nielsen and Woolf 2001 |
| Three Bar Wildlife in Arizona | 0.24-0.27 | Capture/Recapture | Jones and Smith 1979 |
| Three Bar Wildlife in Arizona | 0.25 | Telemetry | Lawhead 1984 |
| Sierra Seri, Sonora (dry) | 0.174-0.319* | Camera trap | This study |
| Sierra Seri, Sonora (wet) | 0.075-0.144* | Camera trap | This study |
| Southeastern Oklahoma | 0.09 | Telemetry | Rolley 1985 |
| Southeastern Idaho | 0.05 | Telemetry | Bailey 1974 |
| Topilejo, CDMX (wet) | 0.053-0.124* | Camera trap | This study |
| Acatlán de Osorio (dry) | 0.065-0.122* | Camera trap | This study |
| Topilejo, CDMX (dry) | 0 | Camera trap | This study |
San Ignacio, Sinaloa, is a tropical dry forest in the coastal plain of the Mexican Pacific. Before this study, there was only one report of the presence of bobcat in this habitat (Lopez-Gonzalez et al. 1998) and our results show that this region supports one of the highest densities reported in México for the species (0.318 to 0.478 bobcat/km2), contrasting with other studies (Jones and Smith 1979; Larrucea et al. 2007) that bobcats prefer sites with rocks and accidental orography (Larivière and Walton 1997).
We also found a very low density (0.05 to 0.12 bobcat/km2) in Topilejo Distrito Federal (now state Ciudad de México) that is comparable to those obtained in Idaho (0.05 to 0.09 bobcat/km2). Idaho and Topilejo are close to the northern and southern extremes of the species range. However, it is striking that Topilejo is less than 10 km from one of the largest cities in the world (México City), so it is very surprising that bobcats can continue to survive and are still present in densities comparable to other regions in North America (Table 4).
In some sites and seasons, we did not record any bobcat photographs. For example, there were no records from Topilejo during the dry season. One possible cause may be the persistent and abundant presence of illegal hunters during the monitoring period; six of our camera traps were stolen. We also did not document any bobcats in the Sierra Fria, Aguascalientes. One possible explanation for its absence is the high relative abundance of mountain lions, with 21 photographs corresponding to at least three different individuals in a very small area (around 10 km2) and few days. At sites where mountain lions are abundant, bobcats tend to be less abundant and vice versa (Leopold 1959). In addition, other studies show that mountain lions can prey on bobcats; in some areas the bobcat can be part of the mountain lion diet in occurrence of 1.6 to 3.0 % (Hass 2009; Lindzey 1987).
Our study sets the stage for the first time for the authorities of México to make decisions and implement policies that are scientifically informed. The bobcat is included in CITES Appendix II (CITES 2021), and exports of bobcat parts and products is legal if non-detriment finding reports are filed. There is an important international trade in bobcat pelts from the U.S. and México issues legal hunting permits every year. Bobcats are a surprisingly resilient species, surviving in areas very close to México City, and its conservation and science-based management can become an important example of conservation success.
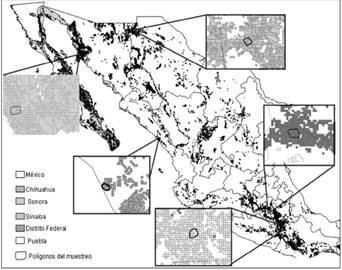
Figure 3 Potential distribution of bobcats in Mexico according to MaxEnt. The polygons in each box are the study areas and the shading around the areas represent potential distribution as calculated with MaxEnt.
One of the most important features of our study is that we were able to compare our data across a great spatiotemporal scale containing drastically different habitats used by bobcats. In México, the Ley General del Equilibrio Ecologico y la Protección al Ambiente (LGEEPA) is the main legal instrument for conservation, recovery, and preservation of natural resources and for sustainable use of natural resources. Under this idea, in 1997 the Unidades de Manejo para la Conservación de Vida Silvestre (UMA) were created. These are sites where alternative schemes of sustainable use of biodiversity compatible with conservation of wildlife in a determined privately-owned area can be implemented, provided a management plan is submitted for approval (Organ et al. 2012). There are two types of UMA, one considered as extractive (hunting, for pet trade or ornamentals, arts and crafts, etc.), and the other not extractive (research, photography, ecotourism, exhibition, environmental education, etc.). On the ground, in UMAs, focal species monitoring for sustainable use in UMAs use indirect methods (tracks, scats, etc.) to estimate population levels. Our study confirms that camera trapping is likely the best and easiest method to estimate populations of animals that may be subjected to a sustainable use program, in particular the bobcat in México. Our study also confirms that bobcats can be individually identified by the patterns on their skins. We strongly recommend that the Mexican government implements a similar method to allocate adequate harvest quotas of bobcat in extractive UMAs.


