


 text new page (beta)
 English (pdf)
 Article in xml format
 Article references
 Send this article by e-mail
 Cited by SciELO
  Similars in
SciELO
Similars in
SciELO 
 Permalink
Introduction
Bats are the dominant mammal group in Neotropical low-land ecosystems, representing nearly half of the total number of species (Voss and Emmons 1996; Simmons and Voss 1998; Voss et al. 2001; Lim and Engstrom 2005; Ochoa et al. 2005; Castaño and Corrales 2010). These mammals make up assemblages of a high number of species that supply large amounts of biomass (Lim and Engstrom 2001). In addition, these bats display a great variety of feeding habits that include the use of plant and animal materials in various ways (Findley 1993; Kalko et al. 1996; Schnitzler et al. 2003; Patterson et al. 2003; Saldaña-Vázquez 2014), thus playing key roles in the functioning of ecosystems as regulators of complex ecological processes (Muscarella and Flemming 2007; Kalka et al. 2008; Kunz et al. 2011; Maine and Boyles 2015). Most studies on the ecology of bats in the Neo-tropics have been conducted in rainforests covering low-lands in the Amazon watershed, Central America and Mexico (Sánchez-Palomino et al. 1993; Voss and Emmons 1996; Montenegro and Romero-Ruiz 1999; Lim and Engstrom 2005; García-García and Santos-Moreno 2008; Calderon-Patron et al. 2013). However, the current knowledge about the diversity of bats is scarce in other extensive ecosystems such as the Neotropical savannas (Aguirre 2002).
Neotropical savannas cover more than 3,000,000 km2 distributed in seven regions: the savannas of Central America, the plains (“Llanos”) of Colombia and Venezuela, Guyana and the Guiana Shield, the Cerrado, the Llanos de los Moxos, El Pantanal and El Chaco (Sarmiento 1983, 1994). The Llanos of Colombia and Venezuela are one of the most extensive savanna areas in America. In general, there are three types of savannas: piedmont savannas, high-plain savannas, and alluvial floodplain savannas (Sarmiento 1983). The latter occur on depressions between Andean foothills and the Meta River in Colombia, in the Departments of Arauca and Casanare, remaining flooded for nearly eight months during the rainy season due to the accumulation of rainfall that drains very slowly (Sarmiento 1983). The floodplain savanna region is subdivided into several ecosystems such as alluvial savannas and aeolian savannas, introduced pastures and plantations, and a wide strip of riparian forest bordering water courses (Etter 1998; Romero-Ruiz et al. 2010).
In general, bat assemblages in Neotropical savannas display a high species diversity and turnover (Aguirre et al. 2003; Bernard and Fenton 2007; Larrea-Alcazar et al. 2010; Gregorin et al. 2011; Muylaert et al. 2014). It has been argued, however, that bat assemblages in savannas across the natural Colombian Orinoquia region show low species richness and diversity values relative to other types of ecosystems such as tropical rainforests and other natural regions of the country, such as the Amazon and Pacific basins. This is likely caused by a number of factors, namely the seemingly limited carrying capacity of riparian forests; strong climatic fluctuations due to the marked unimodal rainfall pattern with four months of water deficit and eigth months of high precipitation and flooding of a large part of the territory; and vast plains (savannas) that restrain the establishment of trophic assemblages such as foliage-gleaning insectivorous bats (Mantilla-Meluk et al. 2009; Mantilla-Meluk et al. 2014).
However, the diversity of bats in Colombian savanna ecosystems is still underestimated and the current state of knowledge is poor (Ferrer-Perez et al. 2009; Usma and Trujillo 2011). Most studies are limited to inventories of local species and the characterization of alpha diversity (Sánchez-Palomino et al. 1993; Suarez-Castro and Sánchez-Palomino 2011; Estrada-Villegas and Ramirez, 2013), or to regional lists based on secondary information (Ferrer-Perez et al. 2009; Trujillo et al. 2011; Pardo-Martínez and Rangel-Churio 2014).
Considering that the knowledge of alpha and beta diversity of bat assemblages in savannas of the Colombian Llanos is incipient, and that these comprise several ecosystems. The objectives of this study were the following: 1) characterize the richness and composition of bat assemblages in three ecosystems of alluvial floodplain savannas of Colombia (transformed ecosystems [introduced pastures and plantations], alluvial floodplain savannas along Andean rivers and aeolian savannas). 2) compare the species richness of the study area vs. other natural regions and other types of ecosystems in Colombia. 3) assess any differences in diversity in terms of the structure of assemblages across the three ecosystems studied. 4) evaluate the turnover of bat species among the three ecosystems. We expected a similar richness of bat species in the savanna ecosystems studied relative to other regions of Colombia, a similar species richness and structure of bat assemblages between the areas studied, and a high species turnover at the regional level.
Materials and Methods
Study Area. The study comprised three floodplain savanna ecosystems in the Departments of Casanare and Arauca, located to the northeast of the Colombian Andes (Figure 1). This region is characterized by a unimodal rainfall pattern with a season of rains and flooding from April to November, followed by a short dry season between December and March (Romero-Ruiz et al. 2010). This region displays two main types of landscapes, alluvial floodplain savannas and aeolian savannas, which contain different habitats influenced by the flooding dynamics, such as permanent and temporary water bodies, firm land savannas, riparian forests associated with temporal streams, and riparian forests associated with Andean rivers (Gossen 1964; Sarmiento 1984; Romero-Ruiz et al. 2010; Mora-Fernández and Borrás-Ulloa 2011). At the floristic level, savannas are characterized by a homogeneous vegetation structure across the distribution range, although with differences in composition (Sarmiento 1983); this contrasts with the forests associated with these savannas, which may vary broadly in structure, floristic composition and phenological rhythms (Lasso et al. 2010).
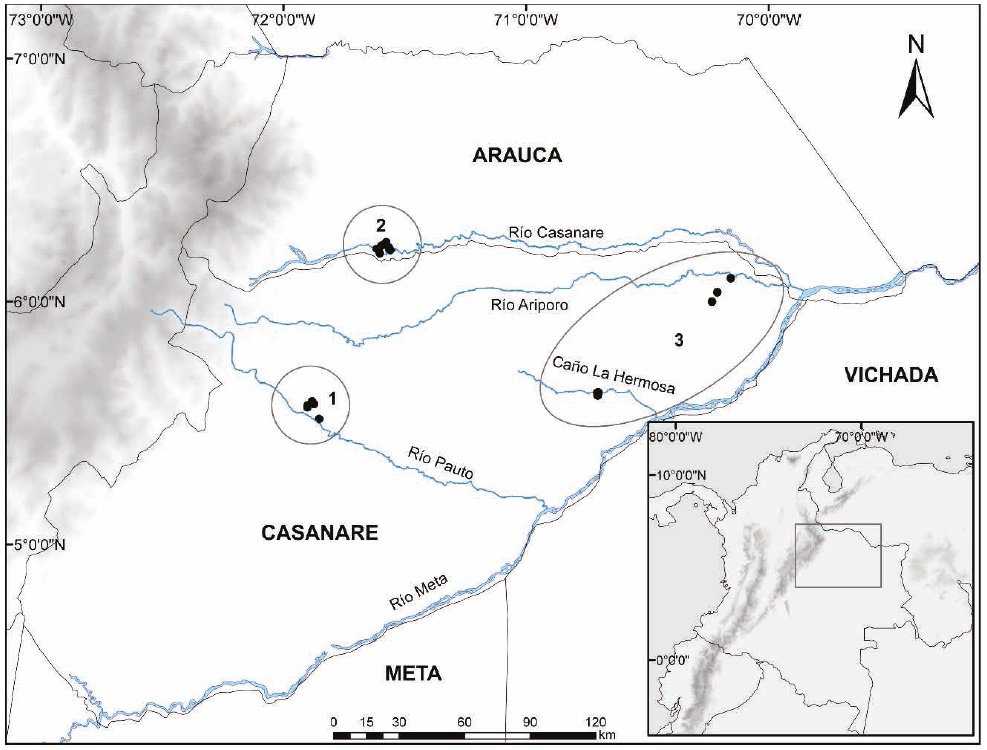
Figure 1 Geographical location of the localities studied in the three ecosystems sampled in the Colombian floodplain savanna: 1. Sampling localities in the mosaic of floodplain savannas and floodplain forests with a remnant cover of less than 20% of the original natural vegetation (E1). 2. Sampling localities in dense high forest growing on the flood plains of white-water Andean rivers (E2). 3. Sampling localities in floodplain savannas covering aeolian savannas (E3).
The three ecosystems sampled are adjacent to one another, but differ in geographic location with respect to the Andes Mountain Range, the influence of Andean rivers, and the extent of anthropic intervention by land use. These ecosystems span across extensive relatively uniform areas, with transitional zones not well defined; therefore, to avoid a potential effect on species that can move across the limits of each ecosystem, sampling localities were placed at a distance of 80 km to 120 km between them. These are described below:
Ecosystem 1 (E1). Mosaic of floodplain savannas and floodplain forests covering less than 20 % of the original area (Etter 1998). Four localities were sampled, three in the municipality of Pore (5.5646°, -71.9017°, 225 m; 5.5782°, -71.8744°, 180 m; 5.5888°, -71.8822°, 197 m; Figure 1); and one in the municipality of Trinidad (5.5169°, -71.8535°, 194 m; Figure 1) in the Department of Casanare, located on alluvial floodplain fans of the Pauto River. This ecosys-tem has been subjected to heavy landscape transformation processes, mostly clearing of riparian forests for crops (improved pastures, oil palm and rice crops), livestock raising, and road and hydrocarbon projects.
Ecosystem 2 (E2). Dense high forest growing on floodplains bordering whitewater Andean rivers (Etter 1998). Two localities were sampled in the municipality of Tame, Department of Arauca (66.2123°, -71.5607°, 201 m; 6.2225°, -71.5668°, 183 m; Figure 1), and two in the municipality of Hato Corozal, Department of Casanare (6.1990°, -71.6038°, 191 m; 6.2169°, -71.6163°, 171 m; Figure 1) located on alluvial floodplain fans of the Casanare River. The area is still covered by large extensions of riparian forests bordering the Casanare River and natural savannas. It is currently facing landscape transformation processes due to the advance of the agricultural frontier and livestock raising, as well as the oil and gas industry.
Ecosystem 3 (E3). Aeolian savannas (Etter 1998). Four localities were sampled in the municipality of Paz de Ariporo (5.6246°, -70.7072°, 120 m; 5.6257°, -70.7021°, 166 m; 6.0959°, -70.1561°, 95 m; 6.0376°, -70.2118°, 111 m; Figure 1) on the eolic floodplain influenced by the Ariporo and Meta white-water rivers. This is a unique ecosystem that spans along the Meta river west bank, including natural savannas that are used primarily for extensive livestock farming. There are no agriculture, hydrocarbon industry or roads in the area.
Sampling of bats. Considering the unimodal rainfall pattern in the region, we conducted a field trip in each of the three ecosystems in each climate season. Sampling in the dry season took place between 16 March and 16 April 2015, and in the rainy season, between 5 August and 4 September 2015. Sampling was always carried out in riparian forests. Bats were captured using between nine and twelve mist nets per night, each measuring six or nine meters long by 2.5 m high. Nets were installed at the understory level, keeping them open between 17:30 and 23:00 hours. The total sampling effort was 15,313 m/net/hour in 56 nights. The sampling effort by type of ecosystem was 5,527 m/net/hour for E1; 4,935 m/net/hour for E2; and 4,851 m/net/hour for E3.
For each individual bat captured, conventional morphometric data, sex and reproductive status were recorded. We collected at least one specimen of each species identified in the field to confirm the identification and build a baseline collection for the region (Appendix 1). Individuals were handled following the procedures described and illustrated by Kunz et al. (2011). All collected specimens were deposited in the “Alberto Cadena García” Collection of Mammals of the Instituto de Ciencias Naturales at the Universidad Nacional de Colombia (ICN), and in the Collection of Mammals of the Instituto Alexander von Humboldt (IAvH). Individuals that were not collected were temporarily marked on the forearm with nail polish to avoid counting an individual more than once. Specimens were collected under a research license as per Resolution No. 500.41-16-0883 dated 19 July 2016 granted by CORPORINOQUIA.
Sampling Representativeness. Sampling representativeness was assessed using the Jackknife 1 non-parametric estimator because it involves little bias and a high precision (González-Oreja et al. 2010). A total of 100 randomizations were carried out to avoid the influence of the order of occurrence in the sampling (Soberón and Llorente 1993). Each capture was considered as a separate and random unit of sampling effort (Willott 2001). Based on the maximum richness values estimated by the index, and considering this value as 100%, the relative (%) representation of species recorded during the field phase was determined (Moreno and Halffter 2000).
Alpha diversity: estimated richness and true diversity measures. The bat species richness was compared between the three ecosystems by means of species accumulation curves extrapolated to the highest capture value across samples (Chao et al. 2014) using the software EstimateS 9.1 (Colwell 2013). The structure of each bat assemblage was described by means of range-abundance curves as suggested by Feinsinger (2004), which were compared using a Kolmogorov-Smirnov test for two samples in search of significant differences in structure between species assemblages.
In turn, the structure of abundances between the three ecosystems was compared by means of an analysis of true diversity or effective number of species (Jost 2006; Moreno et al. 2011). Three values of q were used for the analysis of abundance: q0 is insensitive to abundance and determines species richness; q1 (exponential of the Shannon index) assumes that the weight of a particular species is proportional to its abundance in the community; q2 (the inverse of the Simpson index) considers mostly the common species (Moreno et al. 2011). These analyses considered the estimators recommended by Moreno et al. (2011). For q0, we used the non-parametric estimator ACE (Chao and Lee 1992). For q1, an estimator of the Shannon index that does not require a complete knowledge of the community (“Bias-corrected Shannon diversity estimator”, Chao and Shen 2003). For q2, the MVUE estimator (“minimum variance unbiased estimator”, Chao and Shen, 2010). These analyses were run with the software SPADE (Chao and Shen, 2010).
Beta diversity: species turnover. We evaluated the turn-over of bat species across the ecosystems studied using the Jaccard similarity coefficient, since this qualitative index is insensitive to either sample size or species abundance. In addition, a phenogram was built using the unweighted pair-group method (Crisci and Lopez 1983), assuming that the similarity between ecosystem assemblages is low when it falls below 70%.
Results
Sampling Representativeness. Total of 1,274 individuals were captured, belonging to 50 species from six bat families (Table 1). The sampling representativeness for each ecosystem was above 80% based on the Jackknife 1 estimator. The ecosystem with the highest species richness observed was E2 with 39 species, which yielded a representativeness of 81.3 % (47.98 spp.), followed by E3 with 37 species and a representativeness of 80.0 % (45.98 spp.), and finally E1 with 32 species and a representativeness of 84.2 % (37.99 spp.), all based on the Jackknife 1 estimator.
Table 1 List of bat species, number of individuals captured, acronyms, and type of ecosystem sampled in the Colombian floodland savannas in Colombia.
| Taxa | Acronym | E1 | E2 | E3 |
|---|---|---|---|---|
| Emballonuridae | ||||
| Cyttarops alecto | Ca | 0 | 3 | 0 |
| Peropteryx macrotis | Pm | 3 | 0 | 0 |
| Rhynchonycteris naso | Rns | 4 | 4 | 12 |
| Saccopteryx bilineata | Sccb | 3 | 1 | 3 |
| Saccopteryx canescens | Sccc | 15 | 6 | 6 |
| Saccopteryx leptura | Sccl | 13 | 3 | 5 |
| Phyllostomidae | ||||
| Micronycterinae* | ||||
| Lampronycteris brachyotis | Lb | 0 | 1 | 5 |
| Micronycteris megalotis | Mmg | 0 | 3 | 2 |
| Micronycteris microtis | Mmi | 2 | 4 | 1 |
| Micronycteris minuta | Mmn | 0 | 3 | 2 |
| Desmodontinae | ||||
| Desmodus rotundus | Dr | 45 | 8 | 46 |
| Phyllostominae* | ||||
| Gardnerycteris crenulatum | Mc | 1 | 8 | 12 |
| Lophostoma brasiliense | Lph | 6 | 1 | 6 |
| Macrophyllum macrophyllum | Mmp | 1 | 0 | 0 |
| Phyllostomus discolor | Pd | 8 | 1 | 0 |
| Phyllostomus elongatus | Pe | 3 | 14 | 19 |
| Phyllostomus hastatus | Phs | 9 | 6 | 1 |
| Tonatia saurophila | Tsau | 11 | 6 | 3 |
| Trachops cirrhosus | Crrt | 0 | 8 | 13 |
| Glossophaginae | ||||
| Choeroniscus minor | Ch | 0 | 1 | 0 |
| Glossophaga longirostris | Gl | 0 | 2 | 2 |
| Glossophaga soricina | Gs | 1 | 7 | 1 |
| Carolliinae | ||||
| Carollia brevicauda | Cb | 42 | 99 | 61 |
| Carollia perspicillata | Cp | 29 | 12 | 4 |
| Glyphonycterinae* | ||||
| Trinycteris nicefori | Tri | 0 | 6 | 0 |
| Rhinophyllinae | ||||
| Rhinophylla pumilio | Rhp | 0 | 0 | 15 |
| Stenodermatinae | ||||
| Artibeus lituratus | The | 24 | 38 | 0 |
| Artibeus planirostris | Ap | 139 | 34 | 53 |
| Chiroderma villosum | Cv | 0 | 4 | 1 |
| Dermanura bogotensis | Db | 5 | 1 | 0 |
| Dermanura gnoma | Dg | 1 | 0 | 5 |
| Mesophylla macconnelli | Mm | 5 | 14 | 4 |
| Platyrrhinus brachycephalus | Pbr | 22 | 10 | 18 |
| Platyrrhinus helleri | Phll | 3 | 12 | 1 |
| Sturnira aff. lilium1 | Sll | 2 | 1 | 0 |
| Uroderma bilobatum | Ubil | 55 | 30 | 8 |
| Uroderma magnirostrum | Umag | 15 | 25 | 1 |
| Vampyressa thyone | Vth | 0 | 5 | 0 |
| Vampyriscus bidens | The VBI | 0 | 0 | 1 |
| Noctilionidae | ||||
| Noctilio albiventris | Nal | 0 | 0 | 5 |
| Noctilio leporinus | Nlp | 0 | 0 | 8 |
| Thyropteridae | ||||
| Thyroptera devivoi | Td | 0 | 0 | 1 |
| Molossidae | ||||
| Molossops temminckii | Mt | 0 | 0 | 1 |
| Molossus molossus | Mss | 1 | 0 | 0 |
| Vespertilionidae | ||||
| Eptesicus brasiliensis | Eb | 0 | 1 | 0 |
| Eptesicus diminutus | Ed | 0 | 0 | 3 |
| Eptesicus furinalis | Ef | 1 | 2 | 2 |
| Myotis nigricans | Mcfn | 11 | 23 | 24 |
| Myotis riparius | Cffm | 10 | 15 | 6 |
| Rhogeessa io | Rio | 2 | 1 | 0 |
| Total of individuals | 492 | 421 | 361 | |
| Total Number of species | 32 | 39 | 37 | |
* Subfamilies corresponding to the subfamily Phyllostominae sensu Wetterer et al. (2000) and Simmons (2005) discussed in the text.
1 Considered as Sturnira aff. lilium, as the nominal species S. lilium was restricted to eastern Brazil and the populations of eastern Colombia have no assigned name (Velazco and Patterson 2013).
Alpha diversity of floodplain savannas relative to other natural regions of Colombia. This work recorded diversity values that were either higher than or similar to those reported for various types of ecosystems in other regions of Colombia, such as rainforests of Chocó (30 species, Asprilla-Aguilar et al. 2007), and Amazon (44 species, Sánchez-Palomino et al. 1993; 28 species, Polanco-Ochoa et al. 1999; 46 species, Montenegro and Romero-Ruiz 1999), and dry forests of Caribbean (20 species, Vela-Vargas and Perez-Torres 2012; 25 species, Díaz-Pulido et al. 2014; 22 species, Sampedro et al. 2007) and Inter-Andean valleys (19 species, Perez-Torres et al. 2009; 42 species, Bejarano-Bonilla et al. 2007; 24 species, García-Herrera et al. 2015; 12 species in Patía and 13 species in Chicamocha, Sánchez et al. 2007; Table 2). As regards the number of species in the family Phyllostomidae (33 species) and the subfamily Phyllostominae (sensu Wetterer et al. 2000; Simmons 2005; 13 species). We found values higher than or similar to those reported in the works mentioned above for regions with presumed higher species richness of these taxa (Mantilla-Meluk et al. 2009; Table 2). In Chocó, for instance, 26 species of Phyllostomidae and two species of Phyllostominae have been recorded (Asprilla-Aguilar et al. 2007). In the Amazon, between 25 and 33 species of Phyllostomidae and from 5 to 9 of Phyllostominae (Sánchez-Palomino et al. 1993; Polanco-Ochoa et al. 1999; Table 2). In addition, the percentages of Phyllostominae species (36-40 %; number of species of the sub-family Phyllostominae recorded in each ecosystem relative to the total number of species of the family Phyllostomidae recorded by ecosystem) are higher than those reported for these bats in other natural regions of Colombia (Table 2).
Table 2 Comparison of the total number of bats belonging to family Phyllostomidae and subfamily Phyllostominae (sensu Wetterer et al. 2000) or subfamilies Micronycterinae, Phyllostominae and Glyphonycterinae sensu Baker et al. 2016 reported for different natural regions and ecosystems of Colombia. The percentage of Phyllostominae and non-Phyllostomid bat species is shown.
| Region or ecosystem | Chocó | Amazon | Caribbean | Andean forests | Dry inter-Andean valleys | Orinoquia (floodplain savanna) |
||||||||||
|---|---|---|---|---|---|---|---|---|---|---|---|---|---|---|---|---|
| Sources | 1 | 2 | 3 | 4 | 5 | 6 | 7 | 8 | 9 | 10 | 11 | 12 | 13 | E1 | E2 | E3 |
| Total spp. | 30 | 44 | 28 | 46 | 20 | 25 | 22 | 19 | 42 | 24 | 13 | 12 | 50 | 32 | 39 | 37 |
| Total spp. | 26 | 33 | 24 | 40 | 14 | 15 | 17 | 16 | 34 | 16 | 11 | 12 | 33 | 22 | 29 | 25 |
| Phyllostomidae | ||||||||||||||||
| Total spp. | 2 | 9 | 5 | 17 | 3 | 5 | 6 | 2 | 3 | 6 | 2 | 3 | 13 | 8 | 12 | 10 |
| Phyllostominae | ||||||||||||||||
| % Phyllostominae | 7.7 | 27.3 | 20.8 | 42.5 | 21.4 | 33.3 | 35.3 | 12.5 | 8.8 | 37.5 | 18.2 | 25.0 | 39.4 | 36.4 | 41.4 | 40.0 |
| Total spp. | 4 | 11 | 4 | 6 | 6 | 10 | 5 | 3 | 8 | 8 | 2 | 0 | 17 | 10 | 10 | 12 |
| Non-Phyllostomidae | ||||||||||||||||
| % Non-Phyllostomidae | 13.3 | 25.0 | 14.3 | 13.0 | 30.0 | 40.0 | 22.7 | 15.8 | 19.0 | 33.3 | 15.4 | 0.0 | 34.0 | 31.3 | 25.6 | 32.4 |
Sources: 1. Asprilla-Aguilar et al. 2007, 2. Sánchez-Palomino et al. 1993, 3. Polanco-Ochoa et al. 1999, 4. Montenegro and Romero-Ruiz 1999, 5. Vela-Vargas and Pérez-Torres 2012, 6. Díaz-Pulido et al. 2014, 7. Sampedro et al. 2007, 8. Pérez-Torres et al. 2009, 9. Bejarano-Bonilla et al. 2007, 10. García-Herrera et al. 2015,11. Sánchez et al. 2007 Chicamocha, 12. Sánchez et al. 2007 Patía, 13. This study, E1, E2, E3.
With regard to species diversity of the non-Phyllostomidae families , we recorded a total of 17 species, with a range between 10 and 12 species, by ecosystem sampled. The representativeness of non-phyllostomid bats in the alpha diversity of the whole assemblage was 34 %, with a range between 25 % and 32 % by locality (Table 2), which is higher than other regions. For example, in Chocó these bats only accounted for 13.3%, and in the Amazon between 13 and 25 %, of all species; however, two assemblages of the Colombian Caribbean and one of the Inter-Andean valleys showed a high percentage of non-phyllostomid bats, between 30 % and 40 % (Table 2).
Alpha diversity by ecosystem. According to the rarefaction curves extrapolated to the greatest number of individuals per sample (E1 = 492 individuals), the ecosystems with the highest species richness were E2 and E3, with 40.46 and 39.79 species, respectively, followed by E1 with 32 species (20 % fewer species than the other two locations; Figure 2). The species recorded in E1 belong to four families. The most abundant family is Phyllostomidae with 87.2 % of all individuals captured in E1 (428 ind. captured, 22 species), followed by Emballonuridae with 7.7 % (38 ind. captured, 5 species), Verpertilionidae with 4.9 % (24 ind. captured, 4 species), and Molossidae with 0.2 % (1 individual captured, 1species; Table 1). The most abundant species in E1 were Artibeus planirostris with 28.3 %, followed by Uroderma bilobatum with 11.2 %, Desmodus rotundus with 9.1 %, Carollia brevicauda with 8.5 %, and Carollia perspicillata with 5.9 % (Figure 3).
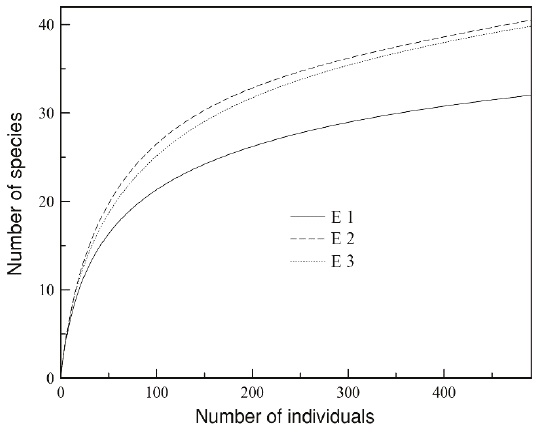
Figure 2 Species accumulation curve extrapolated to 492 individuals of the three ecosystems sampled in the Colombian floodplain savannas: Comparatively, the ecosystem E1 shows a lower estimated species richness relative to the other two ecosystems (E2 and E3).
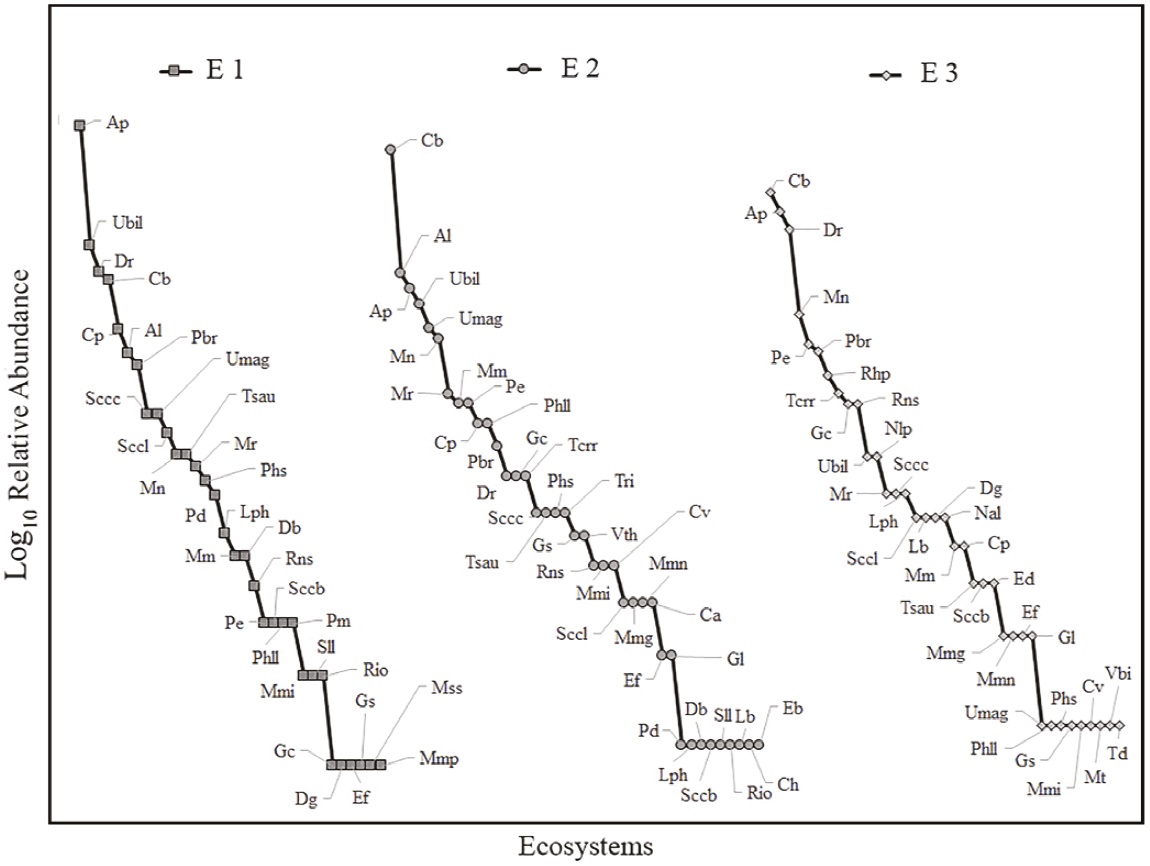
Figure 3 Rank-abundance curves for the three ecosystems sampled in the Colombian floodplain savannas. E1 vs E2 D = 0.157, P > 0.05; E1 vs E3 D = 0.118 P > 0.05; E2 vs E3 D = 0.078 P > 0.05. Species acronyms are listed in Table 1.
The 39 species reported in E2 belong to three families. The most abundant family was Phyllostomidae with 86% of all individuals captured in E2 (362 ind. captured, 29 species), followed by Vespertilionidae with 10.0 % (42 ind. captured, 5 species), and Emballonuridae with 4.0 % (17 ind. captured, 5 species). The most abundant species recorded corresponds to Carollia brevicauda with 23.5 %, followed by Artibeus lituratus with 9.0 %, Artibeus planirostris with 8.1 %, Uroderma bilobatum with 7.1 %, Uroderma magnirostrum with 5.9 %, and Myotis nigricans with 5.5 % of the total number of individuals captured; the remaining species captured account for less than 5.0 % of total captures (Figure 3).
The species recorded in E3 are distributed in six families. The most abundant family was Phyllostomidae with 78.9 % of all individuals captured in E3 (285 ind. captured, 25 species), followed by Vespertilionidae with 9.7 % (35 ind. captured, 4 species), Emballonuridae with 7.2 % (26 ind. captured, 4 species), Noctilionidae with 3.6 % (13 ind. captured, 2 species), and Thyropteridae and Molossidae, each with 0.3 % of all individuals captured in E3 and with 1 species in each family. The most abundant species were Carollia brevicauda with 16.9 %, followed by Artibeus planirostris with 14.7 %, Desmodus rotundus with 12.7 %, Myotis nigricans with 6.6 %, Phyllostomus elongatus with 5.3 %, and Platyrrhinus brachycephalus with 5.0 %; the remaining species accounted for less than 5.0 % of total captures (Figure 3).
Rank-Abundance curves and true diversity measures. There were no significant differences between the rank-abundance curves of the bat assemblages in the ecosystems studied (E1 y E2: D = 0.157, P > 0.05; E1 and E3: D = 0.118, P > 0.05; E2 and E3: D = 0.078, P > 0.05). As regards true diversity, although the richness observed (32 spp.) and the richness calculated by the Jackknife 1 estimator (38 spp.) for E1 are lower vs. E2 and E3, the q0 confidence intervals overlapped (E1 q0 = 36.8 [33.2, 51.6]; E2 q0 = 45.1 [40.7, 60.7]; E3 q0 = 43.1 [38.7, 59.0]); therefore, there are no differences in bat species richness (Figure 4).

Figure 4 True diversity values measured for the three ecosystems sampled in the Colombian floodplain savannas. Circles: E1. Diamonds: E2. Square: E3. q0 = species richness; q1 = exponential of the Shannon index; q2 = inverse of the Simpson index. According to the confidence intervals, E1 stands out for showing lower q1 and q2 diversity values.
In terms of the structure of abundances, we found a higher dominance, ranging between 26 % and 28 %, in E1 (q1 = 1456 [12.98, 16.15]) vs. E2 (q1 = 19.96 [17.46, 22.45]) and E3 (q1 = 19.44 [16.85, 22.04]) (Figure 4). In addition, E1 showed a lower evenness with respect to the abundances of the common species, ranging between 26 % and 31 % (q2 = 8.26 [7.79, 8.73]), vs. E2 (11.16 [10.69, 11.65]) and E3 (11.83 [11.54, 12.13]) (Figure 4). These findings suggest that despite the apparent similarity of the range-abundance curves, the structure differs in terms of the number and relative abundances of common and rare species (Figure 3), as shown by q1 and q2 (Figure 4), with E2 and E3 being more diverse than E1.
Beta diversity: species turnover. We found a high percentage of species turnover (low similarity): E3 displayed the most dissimilar assemblage, with 57 % similarity vs E1 and E2, which in turn showed a 64 % similarity between them (Figure 5).
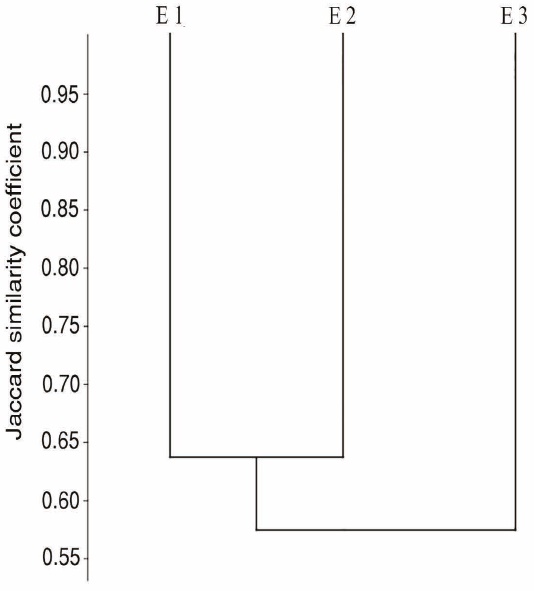
Discussion
Our results show, contrary to Mantilla-Meluk et al. (2009, 2014), that bat assemblages in floodplain savanna ecosystems may be as least as or more diverse as in other natural regions of Colombia, and that this diversity may be influenced by the heterogeneity of these natural ecosystems, and be reduced by anthropogenic transformation processes. On the other hand, the species richness and abundance of bats are probably higher than in other Neotropical savannas. For example, in a study in El Cerrado (Oliveira et al. 2017), the sampling effort was twice the one in this work, but recorded half of the species, and captured one third of individuals captured vs this study.
The species richness values observed in this study are similar to or higher than those reported for other natural regions of Colombia considered as of higher richness, such as El Chocó biogeographical region, the Amazon water-shed, the Caribbean, and the Inter-Andean valleys. Contrary to Mantilla-Meluk et al. (2009, 2014), bat diversity in the Orinoquia is high relative to other natural regions of Colombia, being one of the areas with the highest bat diversity in the country.
Previously, Mantilla-Meluk et al. (2009) reported a low diversity of the family Phyllostomidae in the Orinoco region relative to other natural regions of Colombia, arguing a supposed absence of stratified forests, a limited carrying capacity of riparian forests, and extreme climatic fluctuations of savanna ecosystems; particularly, these authors noted that large open areas prevent the settlement of a number of foliage-gleaning insectivorous species (subfamily Phyllostominae sensu Wetterer et al. 2000; Simmons 2005). This study reports species diversity values for the family Phyllostomidae and the subfamily Phyllostominae that are higher vs. assemblages living in multistratified forests subjected to less marked climatic fluctuations. On the other hand, there is no information about carrying capacity for the various types of ecosystems in different regions. However, our findings show that, if it is hypothesized that multistratified forests (greater vertical stratification) such as the humid forests of the Amazon and the Chocó have a higher carrying capacity vs riparian forests of flooded savanna region, the carrying capacity would not be a limiting factor for bat species richness.
For the savannas of the Brazilian Cerrado, the presence of water courses and the complex vertical structure of riparian forests have been found to be key for the maintenance and conservation of bat diversity, serving as biological corridors and providing shelter, food and water (Redford and Fonseca 1986; Lima et. al. 2017). Our results show that riparian forests in the savanna are home to bat assemblages that are even more diverse than those in Cerrado savannas (Lima et. al. 2017).
Aerial insectivores of the families Emballonuridae and Vespertilionidae showed high richness and abundance in savanna bat assemblages across the ecosystems studied. High abundance for these guilds has been reported in Bolivian floodplain savannas where these may represent up to 40% of the total number of species captured (Aguirre et al. 2003). Therefore, these insectivores may play a key role in the configuration of bat assemblages in the forest understory of floodplain savannas relative to assemblages in other biogeographic regions.
Alpha diversity: true diversity measures. At the regional level, bat assemblages in floodplain savannas show a similar richness across the three ecosystems studied; yet, these differ in terms of species composition and structure. Various hypotheses have proposed that the diversity of bats in floodplain savannas is directly associated with a precipitation gradient that decreases from the eastern slope of the Andes toward the eastern border of savannas along the Meta River (Estrada-Villegas and Ramirez 2013). However, our results indicate that the diversity of bats does not confirm this trend. E1 — the location nearest to the Andes Mountain Range — showed the lowest estimated diversity, while E2, adjacent to the Andes, and E3, on the eastern portion of floodplain savannas, display a similar diversity. Therefore, bat diversity may be more closely associated with the local structure of the natural vegetation and its degree of transformation.
In terms of the structure of the abundances of bat species across the ecosystems studied, we found that E1 shows a high dominance by a few species compared with E2 and E3. It has been found that bat assemblages show a low resilience to habitat loss in Cerrado savannas, where a drop in richness and diversity levels has been observed (Muylaert et al. 2016). Despite the conflicting results about the effect of deforestation on the reduction of forest cover, habitat loss and transformation, and fragmentation in bat diversity (Coutinho and Bernard 2012), it has been found that the structure of bat assemblages may be dominated by a smaller number of species in areas showing a higher deforestation rate (Fenton et al. 1992; Reis and Müller 1995; Brosset et al. 1996; Cosson et al. 1999; Faria 2006).
In general, savannas in the Colombian Orinoco plains show the highest deforestation rates, with a total reduction of 1,636 km2 between 2001 and 2010. The highest forest loss was observed in the interior of the Department in the municipalities of Trinidad and San Luis de Palenque, with a reduction of forest cover of about 27 % in the same period, associated with significant population growth, development of oil extraction infrastructure and intensification of agriculture (Sánchez-Cuervo et al. 2012). Most of the E1 localities sampled belong or are adjacent to the municipality of Trinidad, where remnants of natural vegetation represent less than 20 % of the original area (Etter 1998).
These high rates of deforestation and/or habitat transformation may account for the differences in structure of the abundances of bats, showing a lower diversity in E1 relative to E2 and E3, where there are relative minor impacts on natural ecosystems. This suggests that a higher deforestation rate in floodplain savanna ecosystems coupled with multiple anthropogenic pressures can substantially reduce the diversity of bat assemblages.
Beta diversity: species turnover. We found that savanna bat assemblages show a high species turnover; this high heterogeneity supports a high diversity of species at a regional scale. We consider that this low similarity may be due to the differences in floristic composition and structure at the local level, coupled with the marked seasonality in the region.
In the first case, it has been found that riparian forests located in the Colombian Orinoquia show significant differences in the structure and composition of trees, and their similarity is explained by the geographical distance between forests rather than by the type of habitat (Trujillo and Hainaut-Cárdenas 2018). This could explain why, although all the ecosystems studied are influenced by rivers of Andean origin, marked differences in the composition of their assemblages are evident.
On the other hand, Mantilla-Meluk et al. (2009) and Estrada-Villegas and Ramirez (2013) have proposed that the high seasonality and the decreased rainfall limit the diversity of bats in Orinoquía ecosystems. However, the high species turnover found in this study could be explained by the precipitation patterns, as in the case of the Bolivian savannas, where the composition of each bat assemblage changes after each climate cycle (Aguirre et al. 2003). These precipitation patterns may lead to an increased diversity of bats at the regional level.
The Orinoquia is commonly described as the region with the lowest diversity of mammals in Colombia (Alberico et al. 2000; Rodríguez-Mahecha et al. 2005). However, recent studies have shown that the diversity in this region may be similar to that in other regions of Colombia, including Chocó biogeographical region and the Caribbean (Pardo-Martínez and Rangel-Churio 2014), which is supported by our results. This information is key because the region is currently subject to strong anthropogenic pressures in general, including traditional livestock systems, oil extraction processes, and monoculture tree plantations that have led to high conversion rates of natural ecosystems (Andrade 2011), which are likely to increase since the aim is to make of this region the agricultural frontier of Colombia (DPN 2016).

