


 nueva página del texto (beta)
 Inglés (pdf)
 Artículo en XML
 Referencias del artículo
 Enviar artículo por email
 Citado por SciELO
  Similares en
SciELO
Similares en
SciELO 
 Permalink
Introduction
Runoff process is the product of the interaction of factors such as the climate of the water basin, complex underlying surface conditions, natural environment and geographic condition (Cao et al. 2011; Sivapalan M et al. 2015). It is a special hydrographic phenomenon; it has such characteristics as multi-dimensional, multiple and hierarchy variability. The development of nonlinear characteristics and its multi-scale study method will become the key point in the current study (Deman G et al. 2016; Shao Q et al. 2017). During the past two decades or so, studies on the application of the concepts of nonlinear dynamics and chaos to hydrologic systems and processes have been on the rise (Sivakumar 2000, 2004, 2009; Hu Z et al. 2013). A variety of techniques developed in the context of nonlinear and chaotic dynamics have been employed to hydrological processes to identify their dynamics (Sivakumar 2001; Dhanya et al. 2010; Li et al. 2014; Yan B et al. 2015).
Runoff is a key factor in the hydrographic phenomenon. The traditional methods for identifying chaos of runoff time series are correlation dimension, Lyapunov exponent, false nearest neighbor and Kolmogorov entropy, etc. (Shevchenko I I. 2016; Faggini M. 2014; Kamizawa T T. 2014; Faure P and A Lesne. 2015). All of these methods demand the reconstruction of phase space, by determining an optimum embedding dimension and delay time. However, reconstruction of chaotic phase space is a long existing problem as argued in some papers (Casdagli et al. 1991; Aguirre et al. 2014). For example, there are two opposite opinions regarding the relationship between the two parameters involved in the processes of reconstructed embedding phase space. One is that delay time is correlative with the embedding dimension (Kim et al. 1999); the other is that they are irrelevant to each other (Grassberger and Procaccia 1983a). These problems, in turn, result to some extent of uncertainty and subjectivity in determining the value of the two parameters. In addition, the lack of objective indicators which are required to measure the effect of phase space reconstruction may increase the uncertainty and subjectivity.
Recently, a straightforward and effective method called 0-1 test was proposed (Gottwald et al. 2009). The input is the time series of a relevant variable and the output is zero or one (Sun et al. 2010). The test capable of may provide a clear-cut response on the chaotic behaviour of time series are effectively applied to both on basic theoretical data from various dynamical systems and on observational data bypassing the need for phase-space reconstruction (Falconer 2007; Gottwald et al. 2004, 2005; Litak et al.2009; Xin 2015), such as hydrological data, rainfall, groundwater levels data and so on (Xiong et al. 2016; Li et al. 2012, 2014). In order to demonstrate the reliability and universality of the test, the chaotic character is proved by using a chaotic time series created by logistic map as an example, the monthly runoff time series with more than 8 years from eight hydrologic stations (Tangnaihai, Lanzhou, Toudaoguai, Longkou, Sanmenxia and Huayuankou) in Yellow River, China, are then selected to study the capability of the 0-1 algorithm to analyze the laws of evolution in different spatial scales. The space distribution characteristics of runoff from the Yellow River Basin are analyzed.
0-1 Test of Chaos
Based on the one-dimensional observational data set φ(n) at time n=1,2,…, N. A random number c is generated in the 0-2π range, we use the data φ(n) to drive the 2-dimensional system, one defines the translation variables p c (n) and q c (n) (Grassberger, P., Procaccia, I. (1983a,1983b; Gottwald, Georg A., Melbourne, I. 2002, 2004, 2005):
Where
The improved mean-square displacement of the translation variables p c (n) and q c (n) is defined as(Gottwald, Georg A., Melbourne, I. 2009; Litak, G., Syta, A., & Wiercigroch, M. 2009):
Where
If the behavior of p versus q is Brownian, the results strongly show that the data set φ(n) have chaos property, then M(n) increases with the increase of linear growth. If the trajectory of p versus q is limited the underlying characteristic of data set φ(n) is non-chaotic. Then the trajectory of M(n) is a limited(Sun K., Liu X., Zhu C. 2010; Xin, B. 2015; Xiong, X. Y., Li. W., and Lai. J. J. 2016):
The asymptotic growth rate K c is given by the definition:
The test function K c close to 0 means stable periodic orbits and K c close to 1 implies a complicated non-linear system (Gottwald and Melbourne. 2005). According to these test results, a simple and rapid detection criterion is put forward to chaos identification.
An Example: The Logistic Map
To demonstrate the validity of the algorithm, the Logistic map is chosen as an example, which has been widely studied in nonlinear dynamics. The dynamics may be chaotic or non-chaotic, which is depends on the value of parameter u. The plots of the bifurcation diagram and the largest Lyapunov exponents versus u are shown in Figure 1 (Li et al. 2012).

For the value of u∈(0, 0.729), logistic map converges to an equivalence-point as u is increased beyond 0.729 the trajectory vacillate between 2 points, then 4 points, 8 points and so on, there exists period doubling bifurcation. When the parameter u greater than u chaos =1.399, simulations show that the increase of the parameter u result in the appearance of chaotic gaits. The quasiperiodic interval 1.75<u<1.781 is clearly visible. When u=1.2 the system is in the periodic state, then u=1.6, the system presents a chaotic state. Using the 0-1 test methods, the plot of p versus q, the mean square displacement M(n) and the asymptotic growth rate K c are shown in Figure 2 (Li, X. J., Hu, T. S. et al. 2012):
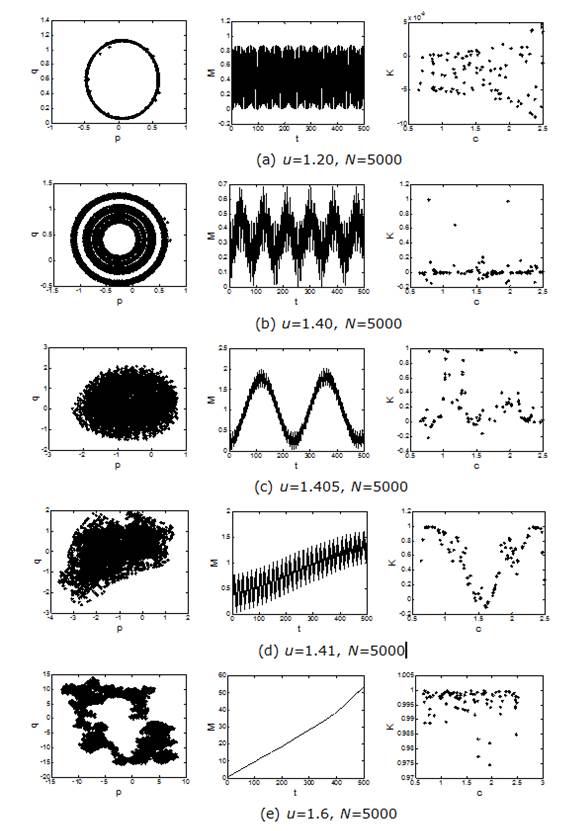
Using the data set φ(n) consists of N=5000, phase plots are experimentally obtained for different values of the parameter of u. For the parameters (u=1.2), trajectories in p versus q stay bounded (Figure 2(a)), M(n) is a limited and asymptotic growth rate (K c =-0.003) implies that the underlying characteristic of Logistic time series (u=1.2) is cyclical.
For the parameters (u=1.40), trajectories in p versus q coordinates show bounded (Figure 2(b)), M(n) grows over time, the asymptotic growth rate is K c =0, the underlying characteristic of Logistic time series (u=1.6) is 4-cyclical.
Table 1 The asymptotic growth rate of Logistic time series.
| u | 1.20 | 1.40 | 1.405 | 1.41 | 1.60 |
| K c | -0.003 | 0 | 0.123 | 0.669 | 0.998 |
For the parameters (u=1.405), trajectories in p versus q coordinates leap from periodic status to chaotic status, M(n) increases with time, and the asymptotic growth rate K c is 0.123, the underlying characteristic of Logistic time series (u=1.405) is under weak chaotic condition, as shown in Figure 2(c).
For the parameters (u=1.41), trajectories in p versus q coordinates leap from periodic status to chaotic status, M(n) increases with time, the asymptotic growth rate K c is 0.669, the underlying characteristic of Logistic time series (u=1.41) is under chaotic condition, as shown in Figure 2(d) .
As shown in Figure 2(e), for the parameters (u=1.6), trajectories in p versus q coordinates show Brownian motion, M(n) increases with time the asymptotic growth rate is K c =0.998, K c close to 1 means that the underlying characteristic of Logistic time series (u=1.6) is chaotic.
Compare Figure 1 and Figure 2, when Logistic time series is a periodic sequence, the asymptotic growth rate K c is trending to zero when the time series is chaos time alignment, the asymptotic growth rate K c is trending to one, the results of 0-1 test is consistent with the result of bifurcation graph. Figure 2 reveals that 0-1 test is an effective method to distinguish chaotic phenomenon in a specific range.
Case Studies
Data Used. Monthly runoff data of the Yellow River in China are analyzed in this study. A total of 8 years (January, 2002-December, 2009) of historic Monthly inflow data is used in the analysis, which is obtained by the Tangnaihai, Lanzhou, Toudaoguai, Longkou, Sanmenxia and Huayuankou, as shown in Figure 3. Tangnaihai hydrological station controls a drainage area of 121972 km2. Lanzhou hydrological station is situated in the lower reaches of Tangnaihai, The valley area is 222551 km2, the runoff is mainly supplied by mountains snowmelt and precipitations, there are no the effects of human activities, therefore, the runoff process at Tangnaihai and Lanzhou is in a basically natural status.
Toudaoguai, Longkou, Sanmenxia and Huayuankou are sited at the middle or lower reaches of the Yellow River. There are many water projects, reservoir hydro-constructions in the river. Hydrologic characteristics are often influenced severely by human activities.

The statistical parameters of monthly runoff time series are shown in Table 2. The variation and skewness coefficients of runoff time series are high and these imply that the discharge data distribution is far from the normal distribution.
Table 2 The statistical tables.
| Runoff series | Drainage area(km2) | Runoff series | |||||
|---|---|---|---|---|---|---|---|
| Min (billion m3) | Max (billion m3) | Mean (billion m3) | Standard-D | Skewness | Kurtosis | ||
| Tangnaihai | 121972 | 2.33 | 52.23 | 15.12 | 11.95 | 1.12 | 0.46 |
| Lanzhou | 222551 | 7.66 | 40.44 | 22.71 | 8.25 | -0.012 | -1.16 |
| Toudaoguai | 367898 | 2.00 | 29.03 | 12.64 | 6.19 | 0.79 | -0.23 |
| Longmen | 497552 | 4.98 | 29.03 | 14.67 | 5.99 | 0.71 | -0.30 |
| Sanmenxia | 688421 | 5.06 | 58.32 | 17.22 | 9.66 | 1.91 | 4.77 |
| Huayuankou | 730036 | 3.70 | 67.91 | 19.64 | 11.49 | 1.49 | 2.94 |
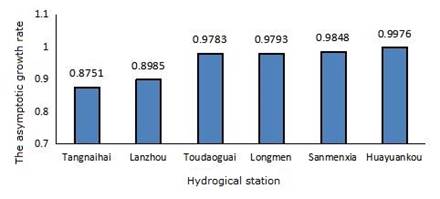
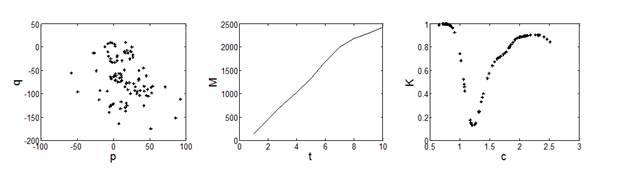
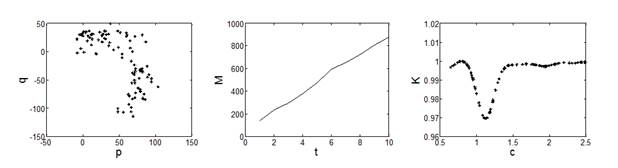
Chaotic Detection Results. The method is applied to the monthly runoff series of Yellow rivers. The plots of asymptotic growth rate Kc are shown in Figure 4. The minimum value of K c is 0.8751 in the Tangnaihai hydrologic station, the maximum value of K c is 0.9976 in the Huayuankou hydrologic station. Taking the data of Tangnaihai and Huayuankou hydrologic station as an example, trajectories in p versus q coordinates, the mean-square displacement M(n) and the asymptotic growth rate K c are shown in Figure 5 and Figure 6.
It is shown that the behavior of p versus q is asymptotically Brownian, the mean-square displacement M(n) grows linearly in time, and the asymptotic growth rate K c is near to 1 for monthly runoff time series of Tangnaihai and Huayuankou hydrologic station in Yellow River which clearly indicates the presence of chaotic behavior in the runoff time series. Results from Figure 7 suggest that Drainage area is an important factor in causing chaos variation.

Conclusions
(1) This paper attempts to have a thorough study of the spatial changes in the Yellow River basin from a new perspective. The dynamical behavior of runoff is identified by 0-1 test method. The research offered a new way for the varying regular research and modeling of time-space of runoff dynamical systems.
(2) Based on the testing result, the asymptotic growth rate K c are 0.8751, 0.8985, 0.9783, 0.9793, 0.9848 and 0.9976 respectively, multiple spatial scales runoff data of Yellow River Basin shows chaotic characteristic. The runoff data in the lower Yellow River has strong characteristics of chaos, and the middle reaches of the yellow river secondly, then to the upper Yellow River. From the spatial scale, the paper analysis variation rules of runoff with drainage area. Results from the runoff data of different hydrologic station show that the chaos characteristic of runoff depends on the meteorology, terrain factors and so on, drainage area is an important factor in causing chaos variation.

