


Services on Demand
Journal
Article
 text in
  Spanish (pdf)
 Article in xml format
 Article references
 Send this article by e-mail
Indicators
-
 Cited by SciELO
 -
 Access statistics
Related links
-
 Similars in
SciELO
Similars in
SciELO
Share

 Permalink
Tecnología y ciencias del agua
On-line version ISSN 2007-2422
Tecnol. cienc. agua vol.9 n.1 Jiutepec Jan./Feb. 2018 Epub Nov 24, 2020
https://doi.org/10.24850/j-tyca-2018-01-10
Notes
Detection of annual meteorological droughts in the state of Zacatecas, Mexico, based on standardized anomaly indices
1Universidad Autónoma de San Luis Potosí, San Luis Potosí, México, campos_aranda@hotmail.com
Meteorological droughts (MD) are a temporary decrease in the normal rainfall received by a location or a region. In order to formulate plans for mitigation of damages, it becomes necessary to study the droughts to estimate related features. In this work the occurrence of annual MD is detected and its severity is estimated through the Pedj drought index (PDI), defined as the difference between the standardized anomalies of the mean temperature and of precipitation, both annual estimates. Sixteen PDI series were calculated, in the state of Zacatecas, Mexico, whose common period was 65 years in the lapse from 1950 to 2014. After verifying their homogeneity, such series were analyzed with various statistical methods, to establish their local and regional behavior. At the local level the most severe sequences of five years are detected and analyzed, as well as the ten most extreme droughts. The regional analysis helped finding the drought years that affected a large number of climatological stations, in each of the three geographical areas analyzed. As the PDI dates from mid-seventies was contrasted with a recent index, the RDIST. Based on all analyzes, it is concluded that the PDI is a simple technique that allows the accurate detection at local and regional level of annual MD; therefore its systematic application is recommended. This implementation will allow the verification of results of other indices of drought and make it possible to know the MD as time series, the latter oriented to forecasting.
Keywords Standard deviation; standardized anomaly index; Pedj drought index; statistical tests; moving averages; major droughts
Las sequías meteorológicas (SM) son un decremento temporal en la precipitación normal que recibe una localidad o región. Para formular planes de mitigación de sus daños, es necesario estudiarlas para estimar sus características. En este trabajo se detecta la ocurrencia de las SM anuales y se estima su severidad a través del índice de sequías de Pedj (ISP), que se define como la diferencia entre las anomalías estandarizadas de la temperatura media y de la precipitación, ambas anuales. Se calcularon 16 series del ISP, en el estado de Zacatecas, México, cuyo periodo común fue de 65 años en el lapso de 1950 a 2014. Después de verificar su homogeneidad, tales series se analizaron con varios métodos estadísticos, para establecer su comportamiento local y regional. A nivel local se detectan y analizan las secuencias más severas de cinco años, así como las diez sequías más extremas. El análisis regional buscó los años con sequía que afectaron un mayor número de estaciones climatológicas, en cada una de las tres zonas geográficas analizadas. Como el ISP data de mediados de los años setenta se contrastó con un índice reciente, el RDIST. De todos los análisis realizados se concluye que el ISP es una técnica simple que permite la detección precisa a nivel local y regional de las SM anuales; por ello se recomienda su aplicación sistemática. Además, permitirá verificar los resultados de otros índices de sequías y hará posible conocer las SM como serie cronológica, orientado esto último a su pronóstico.
Palabras clave desviación estándar; índice de anomalía estandarizada; índice de sequías de Pedj; pruebas estadísticas; promedios móviles; sequías importantes
Introduction
Abnormal extreme climatological and climate phenomena, such as floods and droughts, as well as their associated particularities, storms and heat waves, are generally harmful for a society and its infrastructure, for ecosystems and wildlife (Kunkel, Pielke, & Changnon, 1999).
A drought, in general, is defined as a decrease in water availability and is characterized by three crucial aspects: duration, severity and encompassed area. This concept of drought involves two types of evaluators of water deficiency. The first is associated with the direct effects of the elements of the water cycle, such as precipitation, temperature, evapotranspiration, runoff in rivers, etc. The second type includes the indicators of water resources, which estimate severity in terms of the impact on the supply for water uses, such as urban, industrial, agricultural and ecological (Mawdsley, Petts, & Walker, 1994).
Drought indexes commonly reflect drought conditions based on hydro-climatic variables but are not capable of quantifying economic damage. The indexes that quantify climate variability, however, are useful for drought detection, follow-up and indirect estimation of impacts, all of which are necessary for drawing up prevention and contingency plans to deal with these events (Mishra & Singh, 2010; Lobato-Sánchez, 2016).
The objective of this study was to describe in detail the Pedj drought index (ISP-its abbreviation in Spanish), which is defined by the difference between standardized anomalies of mean annual temperature and of mean annual precipitation. The 65-year (1950 to 2014) registers common to 16 climatological stations in the state of Zacatecas, Mexico, were processed to obtain their ISP series, which were analyzed statistically to verify their homogeneity and obtain the fundamental characteristics of yearly droughts at the local level and in three geographic regions of the state.
Methods and materials
Indexes of climate variability monitoring
Measurements of precipitation and temperature are the most abundant, both temporally and spatially. For this reason, these data have been used individually or together to characterize the climate of a region or territory. Moreover, the correlation, usually negative, between temperature and precipitation has been verified by many authors. That is, dry periods are generally warm and warm periods are usually dry. Also, annual variability of the registers or series of mean precipitation and temperature can be detected through their standardized anomaly indexes (IAE-its abbreviation in Spanish) defined (Elagib & Elhag, 2011) as:
And
where PA is the annual precipitation in millimeters, PMA its mean value, and DEP its unbiased standard deviation, estimated with equation (3). TM is the mean value of annual temperature in °C, TMA its average value, and DET its unbiased standard deviation evaluated with equation (4).
In the above expressions, n is the number of years of the register or processed series.
Drought detection index
Pedj, in 1975 in the USSR, proposed an index for detecting annual droughts, which are defined by the difference between the IAE of the mean temperature minus that of precipitation (Elagib & Elhag, 2011); that is:
The ISP is the Pedj Drought Index, whose annual value classifies atmospheric weather as humid or drought, according to table 1. Elagib and Elhag (2011) verified equation (5) empirically, finding that the ISP correlates negatively with precipitation anomaly and varies directly with mean temperature anomaly, but most importantly, it captures both directions or tendencies. This index has been used by several authors for territorial characterization around the world, for example, Gruza, Rankova, Razuvaev and Bulygina (1999); Qian and Zhu (2001), and Potop and Soukup (2009).
Table 1 Classification of years as wet or drought, according to the ISP value (Potop and Soukup, 2009; Elagib and Elhag, 2011).
| ISP interval | Type or category | Abbreviation | ISP inteval | Type or category | Abbreviation |
|---|---|---|---|---|---|
| -1 ≤ ISP < 0 | Lightly humid | HL | 0 < ISP < 1 | Light drought | SL |
| -2 ≤ ISP < -1 | Moderately humid | HM | 1 ≤ ISP < 2 | Moderate drought | SM |
| -3 ≤ ISP < -2 | Severely humid | HS | 2 ≤ ISP < 3 | Severe drought | SS |
| ISP < -3 | Extremely humid | HE | ISP ≥ 3 | Extreme drought | ES |
Reconnaissance Drought Index
The Reconnaissance Drought Index (RDI) is perhaps the simplest index that has been proposed recently (Tsakiris & Vangelis, 2005; Tsakiris, Tigkas, Vangelis, & Pangalou, 2007; Campos-Aranda, 2014). It is calculated initially as the quotient (a i ) of monthly accumulated precipitation over the respective potential evapotranspiration (ETP), in the k months considered as the duration of drought for each i year of the processed register. When k = 12 in the lapse from January to December, the RDI is an annual index; that is,
Since the magnitudes of a i can be represented probabilistically by the Log-Normal distribution. The standardized RDI values are then obtained easily with the equation:
in which:
In equation (7),
To estimate annual potential evapotranspiration (
Average incident solar radiation (Rs i ) was obtained from the annual map for Mexico presented by Almanza and López (1975), whose value for the city of Zacatecas is 495 cal/cm2/d. To transform Rs i to depth of evaporated water per day, the following formula is used:
in which
Annual climate registers used
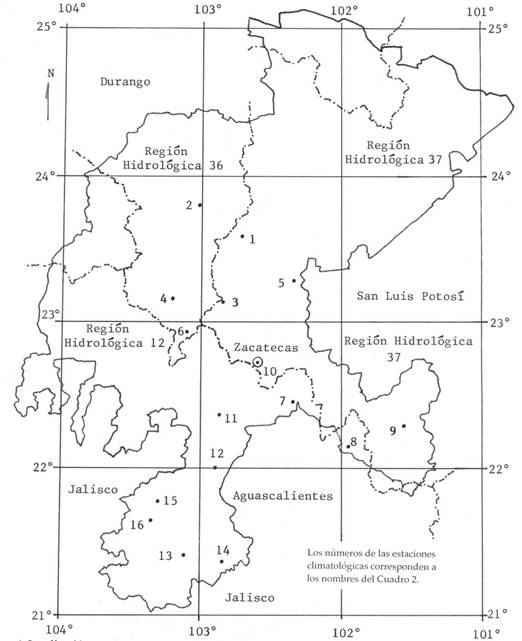
Campos-Aranda (2015) studied the annual precipitation of the state of Zacatecas, Mexico, and observed that 16 rain gauging stations could be selected with a maximum common period of 63 years, the period from 1950 to 2012. These data were expanded to 2014 based on the information provided by the Local Zacatecas Office of the National Water Commission (Conagua). Following a procedure identical to that described for precipitation in the cited references, the 16 yearly registers of mean temperature during the common 65 year period (1950-2014) were integrated. The general characteristics of these 16 climatological stations are presented in table 2 by geographic regions and in progressive order of MAP. Figure 1 shows their location in the state of Zacatecas.
Table 2 General data of the 16 processed climatological stations in the state of Zacatecas, Mexico.
| No. | Station name (No. of AC1) | Latitude N. | Long. W.G. | Altitude (2) | RH3 | Region | PMA (mm) | DEP (mm) | TMA (°C) | DET (°C) | ISP4 | |
|---|---|---|---|---|---|---|---|---|---|---|---|---|
| Minimum | Maximum | |||||||||||
| 1 | Cañitas de Felipe Pescador (9) | 23° 36’ | 102° 44’ | 2025 | 37 | Norte | 371.3 | 132.52 | 16.02 | 1.057 | -3.415 | 3.460 |
| 2 | Río Grande (73) | 23° 48’ | 103° 02’ | 1890 | 36 | Norte | 384.7 | 128.36 | 16.92 | 0.481 | -3.452 | 3.845 |
| 3 | Fresnillo (30) | 23° 11’ | 102° 53’ | 2195 | 37 | Norte | 415.9 | 125.59 | 16.91 | 1.136 | -4.309 | 4.003 |
| 4 | Leobardo Reynoso (El Sauz) (25) | 23° 11’ | 103° 12’ | 2090 | 36 | Norte | 418.3 | 121.79 | 16.08 | 0.471 | -4.433 | 2.648 |
| 5 | Villa de Cos (98) | 23° 17’ | 102° 21’ | 2050 | 37 | Norte | 426.4 | 165.01 | 17.51 | 0.658 | -5.111 | 4.331 |
| 6 | Santa Rosa (69) | 22° 56’ | 103° 07’ | 2240 | 36 | Norte | 459.3 | 149.28 | 14.75 | 0.545 | -3.981 | 2.730 |
| 7 | San Pedro Piedra Gorda (83) | 22° 27’ | 102° 21’ | 2032 | 12 | Centro | 411.5 | 135.24 | 16.85 | 0.828 | -3.611 | 2.793 |
| 8 | Villa García (99) | 22° 10’ | 101° 57’ | 2102 | 12 | Centro | 443.3 | 126.41 | 16.33 | 0.813 | -3.235 | 2.634 |
| 9 | Pinos (65) | 22° 17’ | 101° 35’ | 2408 | 37 | Centro | 448.3 | 151.37 | 16.29 | 1.026 | -4.107 | 3.503 |
| 10 | Zacatecas (103) | 22° 46’ | 102° 35’ | 2485 | 37 | Centro | 463.2 | 133.21 | 15.70 | 0.598 | -3.280 | 3.084 |
| 11 | Villanueva (102) | 22° 22’ | 102° 53’ | 1920 | 12 | Centro | 470.9 | 145.91 | 16.89 | 0.575 | -3.048 | 3.230 |
| 12 | Presa El Chique (68) | 22° 00’ | 102° 53’ | 1620 | 12 | Sur | 543.6 | 117.21 | 20.92 | 0.884 | -3.259 | 3.873 |
| 13 | Juchipila (42) | 21° 23’ | 103° 07’ | 1270 | 12 | Sur | 691.7 | 143.39 | 21.72 | 1.483 | -3.297 | 3.242 |
| 14 | Nochistlán (58) | 21° 22’ | 102° 51’ | 1850 | 12 | Sur | 700.2 | 162.05 | 18.61 | 0.721 | -4.527 | 3.412 |
| 15 | Tlaltenango (94) | 21° 47’ | 103° 18’ | 1700 | 12 | Sur | 701.5 | 157.22 | 18.05 | 1.176 | -4.411 | 2.615 |
| 16 | Excamé (27) | 21° 39’ | 103° 20’ | 1740 | 12 | Sur | 736.5 | 154.47 | 18.53 | 0.493 | -3.662 | 3.330 |
1, 2, 3, 4 Files of conagua meters above sea level hydrological region Pedj drought index
Results and discussion
Calculation of the series of the Pedj drought index
By applying equations (1) through (5) to the 16 annual registers of precipitation and mean temperature to be processed, we obtain the Pedj drought index (ISP) series, whose extreme values are cited in table 2. Table 3 presents the annual data and results for each of the climatological stations considered representative of the three geographical regions defined. These stations were Leobardo Reynoso, Zacatecas and Nochistlán. The first and the last have homogeneous registers, according to the results of table 4 of the following section, while Zacatecas, the state capital, only has persistence.
Table 3 Annual data and calculations of droughts based on ISP at three climatological stations in the state of Zacatecas, Mexico.
| Values | Leobardo Reynoso (El Sauz) | Zacatecas | Nochistlán | ||||||||||
|---|---|---|---|---|---|---|---|---|---|---|---|---|---|
| PMA | DEP | 418.334 mm | 121.793 mm | 463.220 mm | 133.206 mm | 700.160 mm | 162.052 mm | ||||||
| TMA | DET | 16.083 °C | 0.471 °C | 15.703 °C | 0.598 °C | 18.608 °C | 0.721 °C | ||||||
| No. | Year | PA | TM | ISP | TS | PA | TM | ISP | TS | PA | TM | ISP | TS |
| 1 | 1950 | 397.3 | 16.7 | 1.484 | SM | 396.7 | 16.6 | 1.998 | SM | 654.9 | 18.9 | 0.684 | SL |
| 2 | 1951 | 431.6 | 16.7 | 1.202 | SM | 437.6 | 16.3 | 1.190 | SM | 616.5 | 17.9 | -0.465 | - |
| 3 | 1952 | 305.9 | 16.7 | 2.234 | SS | 364.8 | 15.9 | 1.068 | SM | 379.6 | 17.0 | -0.250 | - |
| 4 | 1953 | 453.2 | 15.7 | -1.100 | - | 441.7 | 15.6 | -0.011 | - | 609.5 | 17.1 | -1.531 | - |
| 5 | 1954 | 292.4 | 16.5 | 1.920 | SM | 284.2 | 16.2 | 2.174 | SS | 762.5 | 19.3 | 0.575 | SL |
| 6 | 1955 | 467.6 | 16.0 | -0.581 | - | 584.7 | 15.8 | -0.750 | - | 880.9 | 19.3 | -0.156 | - |
| 7 | 1956 | 281.2 | 15.8 | 0.524 | SL | 389.7 | 16.0 | 1.048 | SM | 730.8 | 18.5 | -0.338 | - |
| 8 | 1957 | 278.3 | 16.2 | 1.398 | SM | 252.1 | 16.6 | 3.084 | SE | 530.5 | 19.0 | 1.591 | SM |
| 9 | 1958 | 807.3 | 15.5 | -4.433 | - | 682.7 | 15.7 | -1.653 | - | 977.9 | 17.7 | -2.972 | - |
| 10 | 1959 | 595.5 | 15.7 | -2.269 | - | 481.5 | 15.9 | 0.192 | SL | 509.0 | 20.1 | 3.248 | SE |
| 11 | 1960 | 306.9 | 16.2 | 1.163 | SM | 321.8 | 16.4 | 2.226 | SS | 480.8 | 19.0 | 1.897 | SM |
| 12 | 1961 | 412.8 | 16.2 | 0.294 | SL | 334.7 | 16.5 | 2.297 | SS | 850.6 | 19.0 | -0.385 | - |
| 13 | 1962 | 310.4 | 16.6 | 1.985 | SM | 309.4 | 16.8 | 2.988 | SS | 697.6 | 19.1 | 0.698 | SL |
| 14 | 1963 | 434.2 | 16.8 | 1.393 | SM | 326.3 | 16.5 | 2.360 | SS | 1001.3 | 18.4 | -2.146 | - |
| 15 | 1964 | 470.3 | 16.3 | 0.034 | SL | 447.7 | 15.7 | 0.111 | SL | 739.7 | 18.1 | -0.948 | - |
| 16 | 1965 | 435.3 | 15.9 | -0.528 | - | 510.9 | 15.6 | -0.530 | - | 784.4 | 18.4 | -0.808 | - |
| 17 | 1966 | 478.8 | 15.9 | -0.886 | - | 514.3 | 15.3 | -1.057 | - | 739.7 | 18.3 | -0.671 | - |
| 18 | 1967 | 455.2 | 16.0 | -0.479 | - | 590.9 | 15.7 | -0.964 | - | 1049.0 | 19.0 | -1.609 | - |
| 19 | 1968 | 463.0 | 15.3 | -2.031 | - | 635.1 | 14.7 | -2.967 | - | 681.7 | 18.4 | -0.174 | - |
| 20 | 1969 | 241.9 | 16.5 | 2.335 | SS | 169.3 | 15.2 | 1.366 | SM | 550.2 | 19.1 | 1.608 | SM |
| 21 | 1970 | 524.7 | 15.7 | -1.687 | - | 549.4 | 15.2 | -1.488 | - | 811.7 | 19.2 | 0.133 | SL |
| 22 | 1971 | 508.1 | 16.1 | -0.701 | - | 764.3 | 15.5 | -2.600 | - | 856.8 | 18.8 | -0.700 | - |
| 23 | 1972 | 344.4 | 16.5 | 1.493 | SM | 414.4 | 15.9 | 0.696 | SL | 712.4 | 19.6 | 1.300 | SM |
| 24 | 1973 | 762.9 | 15.4 | -4.281 | - | 521.7 | 15.5 | -0.778 | - | 888.0 | 19.0 | -0.615 | - |
| 25 | 1974 | 286.9 | 16.0 | 0.903 | SL | 415.9 | 15.6 | 0.183 | SL | 723.2 | 19.0 | 0.402 | SL |
| 26 | 1975 | 412.0 | 15.4 | -1.400 | - | 367.6 | 15.5 | 0.378 | SL | 643.9 | 18.6 | 0.337 | SL |
| 27 | 1976 | 565.9 | 15.0 | -3.513 | - | 570.0 | 14.8 | -2.311 | - | 808.5 | 18.5 | -0.818 | - |
| 28 | 1977 | 314.0 | 15.7 | 0.043 | SL | 405.7 | 15.4 | -0.075 | - | 799.7 | 18.7 | -0.486 | - |
| 29 | 1978 | 285.3 | 16.2 | 1.341 | SM | 278.3 | 15.4 | 0.882 | SL | 696.7 | 19.1 | 0.704 | SL |
| 30 | 1979 | 294.4 | 15.9 | 0.629 | SL | 300.1 | 15.6 | 1.052 | SM | 541.2 | 19.1 | 1.663 | SM |
| 31 | 1980 | 418.4 | 16.5 | 0.885 | SL | 377.0 | 15.6 | 0.475 | SL | 780.1 | 19.6 | 0.882 | SL |
| 32 | 1981 | 429.6 | 16.5 | 0.794 | SL | 588.5 | 15.4 | -1.447 | - | 694.7 | 19.0 | 0.578 | SL |
| 33 | 1982 | 286.2 | 16.8 | 2.608 | SS | 299.6 | 16.3 | 2.226 | SS | 723.1 | 19.5 | 1.095 | SM |
| 34 | 1983 | 394.6 | 15.8 | -0.407 | - | 533.0 | 14.9 | -1.866 | - | 827.1 | 18.5 | -0.933 | - |
| 35 | 1984 | 565.1 | 16.6 | -0.107 | - | 560.1 | 15.4 | -1.234 | - | 773.7 | 19.0 | 0.090 | SL |
| 36 | 1985 | 498.7 | 16.7 | 0.651 | SL | 542.0 | 14.2 | -3.103 | - | 797.1 | 19.2 | 0.223 | SL |
| 37 | 1986 | 481.1 | 16.3 | -0.054 | - | 511.3 | 14.8 | -1.870 | - | 677.7 | 19.4 | 1.237 | SM |
| 38 | 1987 | 565.5 | 16.1 | -1.172 | - | 632.6 | 14.6 | -3.115 | - | 684.6 | 19.0 | 0.640 | SL |
| 39 | 1988 | 502.5 | 16.1 | -0.655 | - | 489.7 | 14.9 | -1.541 | - | 639.4 | 17.9 | -0.606 | - |
| 40 | 1989 | 371.6 | 16.7 | 1.695 | SM | 412.8 | 15.3 | -0.295 | - | 336.0 | 19.0 | 2.791 | SS |
| 41 | 1990 | 507.3 | 17.0 | 1.218 | SM | 721.4 | 14.9 | -3.280 | - | 901.4 | 19.0 | -0.698 | - |
| 42 | 1991 | 494.5 | 16.3 | -0.164 | - | 669.6 | 15.2 | -2.390 | - | 797.4 | 17.6 | -1.997 | - |
| 43 | 1992 | 413.7 | 15.8 | -0.564 | - | 537.1 | 14.9 | -1.897 | - | 1117.5 | 17.2 | -4.527 | - |
| 44 | 1993 | 347.2 | 16.6 | 1.683 | SM | 468.3 | 15.5 | -0.377 | - | 704.8 | 17.7 | -1.287 | - |
| 45 | 1994 | 333.1 | 17.0 | 2.648 | SS | 554.1 | 16.1 | -0.019 | - | 579.0 | 18.3 | 0.321 | SL |
| 46 | 1995 | 380.3 | 16.5 | 1.198 | SM | 342.8 | 15.9 | 1.233 | SM | 806.0 | 18.0 | -1.496 | - |
| 47 | 1996 | 446.4 | 15.9 | -0.619 | - | 568.8 | 15.6 | -0.965 | - | 571.4 | 17.6 | -0.602 | - |
| 48 | 1997 | 310.0 | 15.5 | -0.350 | - | 354.0 | 14.9 | -0.522 | - | 810.6 | 19.0 | -0.138 | - |
| 49 | 1998 | 299.4 | 16.6 | 2.075 | SS | 473.0 | 16.6 | 1.425 | SM | 497.3 | 19.0 | 1.796 | SM |
| 50 | 1999 | 250.2 | 15.8 | 0.779 | SL | 343.5 | 16.0 | 1.395 | SM | 415.1 | 17.7 | 0.501 | SL |
| 51 | 2000 | 306.4 | 16.0 | 0.743 | SL | 339.0 | 16.1 | 1.596 | SM | 532.3 | 16.8 | -1.470 | - |
| 52 | 2001 | 285.8 | 15.6 | 0.062 | SL | 481.9 | 15.5 | -0.480 | - | 409.0 | 17.6 | 0.400 | SL |
| 53 | 2002 | 537.7 | 16.2 | -0.732 | - | 693.3 | 15.7 | -1.732 | - | 868.1 | 17.5 | -2.572 | - |
| 54 | 2003 | 475.3 | 16.0 | -0.644 | - | 559.9 | 15.7 | -0.731 | - | 769.4 | 18.4 | -0.715 | - |
| 55 | 2004 | 540.9 | 15.5 | -2.245 | - | 718.3 | 15.9 | -1.586 | - | 904.9 | 19.0 | -0.720 | - |
| 56 | 2005 | 380.0 | 16.3 | 0.776 | SL | 358.7 | 16.7 | 2.451 | SS | 415.1 | 19.8 | 3.412 | SE |
| 57 | 2006 | 442.7 | 15.9 | -0.589 | - | 520.3 | 16.8 | 1.404 | SM | 634.8 | 19.0 | 0.947 | SL |
| 58 | 2007 | 399.2 | 15.6 | -0.869 | - | 408.8 | 16.2 | 1.239 | SM | 742.6 | 18.6 | -0.273 | - |
| 59 | 2008 | 643.3 | 15.3 | -3.511 | - | 591.3 | 15.7 | -0.967 | - | 705.0 | 19.0 | 0.514 | SL |
| 60 | 2009 | 386.5 | 16.0 | 0.085 | SL | 502.9 | 16.4 | 0.867 | SL | 524.4 | 19.1 | 1.767 | SM |
| 61 | 2010 | 346.9 | 15.1 | -1.503 | - | 493.0 | 15.5 | -0.563 | - | 575.4 | 17.9 | -0.211 | - |
| 62 | 2011 | 183.5 | 16.2 | 2.177 | SS | 245.5 | 15.6 | 1.462 | SM | 493.9 | 19.1 | 1.955 | SM |
| 63 | 2012 | 301.2 | 16.0 | 0.785 | SL | 216.0 | 15.3 | 1.182 | SM | 675.0 | 19.0 | 0.699 | SL |
| 64 | 2013 | 640.2 | 15.9 | -2.211 | - | 487.6 | 16.8 | 1.650 | SM | 695.2 | 18.7 | 0.159 | SL |
| 65 | 2014 | 409.0 | 15.6 | -0.950 | - | 450.1 | 16.4 | 1.263 | SM | 722.1 | 17.6 | -1.532 | - |
| Sumas | - | - | - | 34 | - | - | - | 32 | - | - | - | 32 | |
Symbols
PMA |
mean annual precipitation, in millimeters |
PA |
annual precipitation, in millimeters |
DEP |
standard deviation of precipitation, in millimeters |
TM |
mean temperature of the year in °C |
TMA |
mean annual average temperature, in °C |
ISP |
Pedj drought index, adimensional |
DET |
TM standard deviation of TM, in millimeters |
TS |
drought type (SL light, SM moderate, SS severe and SE extreme) |
Table 4 Serial correlation coefficient of first order (r 1) and results of the homogeneity tests on the 16 annual series of the Pedj drought index (ISP) processed for the state of Zacatecas, Mexico.
| No. | Station | r 1 | Results of the homogeneity tests |
|---|---|---|---|
| 1 | Cañitas de Felipe Pescador | 0.262 | Oscillates little according to basic tests, and exhibits persistence and an upward trend |
| 2 | Río Grande | 0.044 | Homogeneous |
| 3 | Fresnillo | 0.291 | Oscillates little according to basic tests, and exhibits persistence |
| 4 | Leobardo Reynoso | 0.029 | Homogeneous |
| 5 | Villa de Cos | 0.222 | Homogeneous, exhibits persistence |
| 6 | Santa Rosa | 0.209 | Oscillates little according to basic tests, and exhibits persistence and a downward trend |
| 7 | San Pedro Piedra Gorda | 0.358 | Oscillates little according to basic tests, and exhibits persistence |
| 8 | Villa García | 0.169 | Not homogeneous, according to basic tests |
| 9 | Pinos | 0.405 | Oscillates little according to basic tests, and exhibits persistence |
| 10 | Zacatecas | 0.335 | Oscillates little according to basic tests, and exhibits persistence |
| 11 | Villanueva | 0.224 | Oscillates little according to basic tests, and exhibits persistence and a slightly downward trend |
| 12 | Presa El Chique | 0.354 | Oscillates little according to basic tests, and exhibits persistence. |
| 13 | Juchipila | 0.321 | Oscillates little according to basic tests, and exhibits persistence and a downward trend |
| 14 | Nochistlán | 0.071 | Homogeneous |
| 15 | Tlaltenango | 0.324 | Homogeneous, shows persistence |
| 16 | Excamé | 0.102 | Homogeneous |
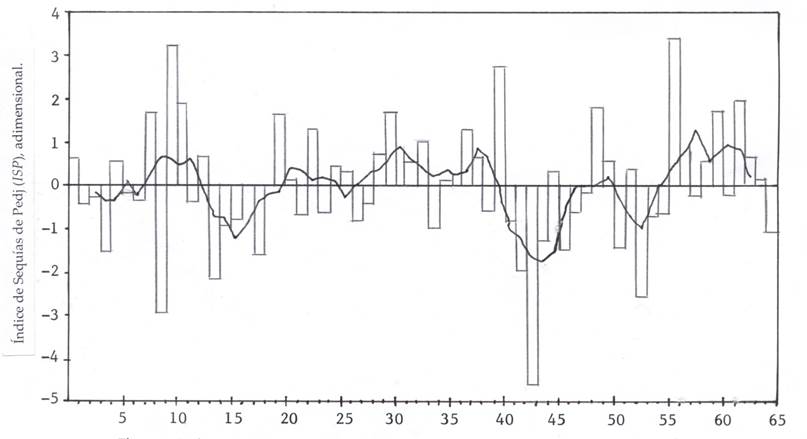
Figure 2 shows the annual ISP chronological series of the Cañitas de Felipe Pescador climatological station in bars and its curve of order 5 mobile averages. This station was not homogeneous, according to the basic tests. It has persistence and an ascending linear trend with a slope statistically different from zero, according to the Student t test (Campos-Aranda, 2015) since t = 2.462 and tc = 1.998. Figure 3 presents the annual ISP chronological series of the Nochistlán station, which was homogeneous.

Figure 2 Chronological series of the Pedj drought index (ISP) in bars, curve of order 5 mobile averages and trend line at the Cañitas de Felipe Pescador climatological station, Zacatecas, Mexico.
Verification of homogeneity
Each annual ISP chronological series was analyzed for statistical quality, searching for deterministic components with three general tests (the Helmert, Sequence and Von Neumann tests) and six specific tests: two persistence tests (Anderson and Sneyers), two trend tests (Kendall and Spearman), one variability test (Bartlett) and one mean change test (Cramer). Most of these tests can be consulted in WMO (1971), Machiwal and Jha (2008, 2012) and Campos-Aranda (2015). Table 4 concentrates the results of these tests. It can be seen that only four registers are perfectly homogeneous, three show a downward trend, one an upward trend, and the rest exhibit persistence, which is a statistical characteristic of most chronological series of annual rainfall and temperature. Table 4 reveals that persistence is associated with the coefficient of first-order serial correlation (r 1), when the latter is greater than 0.200.
Regional analysis: evidence of climate change
According to the results of table 4, only six ISP series are homogenous; the rest are persistent and four of them exhibit trends: three downward and one upward. For this reason, it is convenient to search for evidence of climate change. For simplicity, the register was divided into two periods, 1950 to 1981 and 1982 to 2014, since this search was to be done by counting important drought events, which are shown below by station and period, moderate, severe and extreme (ISP(1.000) drought years. The results are shown in table 5.
Table 5 Number of major droughts (ISP ≥ 1.00) detected in the indicated periods by each of the climatological stations processed.
| Period | Northern region stations | Sum Northern | Central region stations | Sum Central | Southern region stations | Sum Sur | |||||||||||||
|---|---|---|---|---|---|---|---|---|---|---|---|---|---|---|---|---|---|---|---|
| 1 | 2 | 3 | 4 | 5 | 6 | 7 | 8 | 9 | 10 | 11 | 12 | 13 | 14 | 15 | 16 | ||||
| 1950-1981 | 6 | 8 | 5 | 11 | 7 | 11 | 48 | 8 | 11 | 7 | 12 | 11 | 49 | 4 | 10 | 8 | 6 | 10 | 38 |
| 1982-2014 | 10 | 9 | 8 | 8 | 6 | 11 | 52 | 10 | 8 | 11 | 12 | 7 | 48 | 12 | 2 | 5 | 7 | 6 | 32 |
From table 5, we deduce that the indicators of sums of important droughts (ISP(1.000) by region should be considered similar since, although there are differences, they were not generated by all of the stations of each region; rather, some stations had more droughts in the first period and other had more in the second, for example, stations 9 (Pinos) and 11 (Villanueva) in the central region. Moreover, in each geographic region there are stations with similar numbers of droughts per period, for examples stations 2, 5, 6, 10 and 15. Therefore, there is no regional evidence of climate change in the annual meteorological droughts of the state of Zacatecas, Mexico, according to the ISP.
Local analysis: 5-year minimum sequences
Based on the fifth order mobile averages technique, in the 16 ISP chronological series, three minimum sequences, their values and location were identified; details are presented in table 6. The most extreme sequences of the northern region are defined by the Fresnillo and Villa de Cos stations. The former occurred in the first time division 1979 to 1985 and the second in 1960 to 1966. In the central region, at the Pinos station, the most severe sequences occurred in the period 1999 to 2005. Finally, in the southern region, the most extreme five-year sequences occurred at several stations during the early 1950s and the late 1990s, for example, at the Presa El Chique station.
Table 6 Averages and lapses of the three five-year maximum sequences in the ISP chronological series, at the 16 climatological stations processed in the state of Zacatecas, Mexico.
| No. | Station | Region | First sequence | Second sequence | Third sequence |
|---|---|---|---|---|---|
| 1 | Cañitas de Felipe Pescador | North | 1.671 (1997-2001) | 1.516 (1974-1978) | 1.510 (1977-1981) |
| 2 | Río Grande | North | 1.510 (2010-2014) | 1.123 (2009-2013) | 1.057 (1978-1982) |
| 3 | Fresnillo | North | 2.525 (1981-1985) | 2.064 (1980-1984) | 1.862 (1979-1983) |
| 4 | Leobardo Reynoso | North | 1.251 (1978-1982) | 1.148 (1950-1954) | 0.991 (1994-1998) |
| 5 | Villa de Cos | North | 2.030 (1961-1965) | 1.735 (1962-1966) | 1.513 (1960-1964) |
| 6 | Santa Rosa | North | 1.467 (1953-1957) | 1.349 (1994-1998) | 1.337 (1978-1982) |
| 7 | San Pedro Piedra Gorda | Central | 2.286 (1950-1954) | 1.810 (1951-1955) | 1.793 (2008-2012) |
| 8 | Villa García | Central | 1.349 (1961-1965) | 1.345 (1962-1966) | 1.194 (1978-1982) |
| 9 | Pinos | Central | 2.533 (2000-2004) | 2.508 (2001-2005) | 2.046 (1999-2003) |
| 10 | Zacatecas | Central | 2.012 (1959-1963) | 1.996 (1960-1964) | 1.445 (1961-1965) |
| 11 | Villanueva | Central | 1.811 (1978-1982) | 1.519 (1979-1983) | 1.429 (1977-1981) |
| 12 | Presa El Chique | South | 1.961 (1953-1957) | 1.867 (1996-2000) | 1.749 (1997-2001) |
| 13 | Juchipila | South | 1.445 (1953-1957) | 1.429 (1950-1954) | 1.344 (1965-1969) |
| 14 | Tlaltenango | South | 1.806 (1961-1965) | 1.651 (1960-1964) | 1.220 (1998-2002) |
| 15 | Nochistlán | South | 1.273 (2005-2009) | 0.984 (1978-1982) | 0.945 (2008-2012) |
| 16 | Excamé | South | 2.061 (1950-1954) | 1.554 (1951-1955) | 1.177 (1953-1957) |
Local analysis: The ten driest years
From the series of ISP values ordered from highest to lowest, the ten highest were selected, and their years of occurrence were obtained. These ISP values and their respective years are concentrated in table 7. In the series of ordered ISP values, we detected that the number of droughts (ISP > 0) varied from 29 in Cañitas de Filipe Pescador to 40 in Tlaltenango, while the number of extreme, severe and moderate droughts (ISP ( 1.0) varied from 12 in Juchipila to 24 in Zacatecas. Furthermore, in table 7 we observe that the maximum extreme ISP values occurred in Villa de Cos and Fresnillo, with 4.331 and 4.003, respectively, but they can be as low as 2.615 and 2.634, which occurred in Tlaltenangeo and Villa García.
Table 7 Values of the ten highest annual Pedj drought indexes (ISP) and their respective years at 16 climatological stations processed in the state of Zacatecas, Mexico.
| No. | Name | Data | Maximum ISP values in descending order of magnitude and their respective years | |||||||||
|---|---|---|---|---|---|---|---|---|---|---|---|---|
| 10 | 9 | 8 | 7 | 6 | 5 | 4 | 3 | 2 | 1 | |||
| 1 | Cañitas de Felipe Pescador | ISP | 3.460 | 2.925 | 2.512 | 2.424 | 2.379 | 2.213 | 2.152 | 1.961 | 1.866 | 1.690 |
| Año | 1974 | 1980 | 1975 | 1977 | 2012 | 1999 | 2001 | 1979 | 2009 | 2011 | ||
| 2 | Río Grande | ISP | 3.845 | 3.304 | 3.192 | 2.637 | 2.447 | 2.353 | 1.810 | 1.804 | 1.745 | 1.625 |
| Año | 2011 | 1989 | 1982 | 2012 | 2014 | 1995 | 1977 | 1998 | 1957 | 1956 | ||
| 3 | Fresnillo | ISP | 4.003 | 3.066 | 2.608 | 2.446 | 2.142 | 1.837 | 1.729 | 1.279 | 1277 | 1.195 |
| Año | 1982 | 2011 | 1981 | 1985 | 2012 | 1984 | 1983 | 1960 | 1964 | 1965 | ||
| 4 | Leobardo Reynoso | ISP | 2.648 | 2.608 | 2.335 | 2.234 | 2.177 | 2.075 | 1.985 | 1.920 | 1.695 | 1.683 |
| Año | 1994 | 1982 | 1969 | 1952 | 2011 | 1998 | 1962 | 1954 | 1989 | 1993 | ||
| 5 | Villa de Cos | ISP | 4.331 | 2.418 | 2.348 | 2.050 | 2.001 | 1.587 | 1.465 | 1.440 | 1.358 | 1.338 |
| Año | 1963 | 1964 | 1965 | 1954 | 1995 | 1989 | 1974 | 1998 | 1973 | 1956 | ||
| 6 | Santa Rosa | ISP | 2.730 | 2.626 | 2.429 | 2.303 | 2.125 | 2.087 | 1.986 | 1.882 | 1.846 | 1.819 |
| Año | 1962 | 1957 | 2014 | 1956 | 1969 | 1996 | 1964 | 1994 | 1954 | 1950 | ||
| 7 | San Pedro Piedra Gorda | ISP | 2.793 | 2.766 | 2.674 | 2.660 | 2.523 | 2.444 | 2.074 | 1.869 | 1.787 | 1.684 |
| Año | 1950 | 2011 | 1954 | 1969 | 1952 | 2009 | 1982 | 2012 | 1951 | 1979 | ||
| 8 | Villa García | ISP | 2.634 | 2.580 | 2.481 | 2.198 | 2.190 | 2.063 | 1.958 | 1.721 | 1.697 | 1.651 |
| Año | 1954 | 1962 | 1965 | 2011 | 1982 | 1957 | 2009 | 2000 | 1969 | 1999 | ||
| 9 | Pinos | ISP | 3.503 | 3.488 | 2.784 | 2.776 | 2.316 | 2.272 | 2.232 | 1.953 | 1.735 | 1.486 |
| Año | 1987 | 2001 | 2003 | 2004 | 2002 | 1962 | 1969 | 1977 | 1968 | 1954 | ||
| 10 | Zacatecas | ISP | 3.084 | 2.988 | 2.451 | 2.360 | 2.297 | 2.226 | 2.226 | 2.174 | 1.998 | 1.650 |
| Año | 1957 | 1962 | 2005 | 1963 | 1961 | 1960 | 1982 | 1954 | 1950 | 2013 | ||
| 11 | Villanueva | ISP | 3.230 | 2.410 | 2.403 | 2.237 | 2.005 | 1.929 | 1.87 | 1.553 | 1.486 | 1.646 |
| Año | 1969 | 1994 | 1982 | 1979 | 2012 | 2011 | 1963 | 1978 | 1981 | 1960 | ||
| 12 | Presa El Chique | ISP | 3.873 | 3.642 | 2.952 | 2.772 | 2.512 | 1.955 | 1.935 | 1.884 | 1.777 | 1.775 |
| Año | 2011 | 1957 | 1953 | 1998 | 2009 | 2000 | 1961 | 1989 | 1999 | 1993 | ||
| 13 | Juchipila | ISP | 3.242 | 3.151 | 2.623 | 2.229 | 2.217 | 2.086 | 2.021 | 1.984 | 1.739 | 1.614 |
| Año | 1957 | 1968 | 1994 | 2011 | 1956 | 1967 | 1952 | 1972 | 1950 | 1951 | ||
| 14 | Tlaltenango | ISP | 2.615 | 2.612 | 2.177 | 2.028 | 1.835 | 1.769 | 1.662 | 1.637 | 1.454 | 1.441 |
| Año | 1962 | 1950 | 2011 | 1963 | 1972 | 1998 | 1964 | 2000 | 1965 | 1999 | ||
| 15 | Nochistlán | ISP | 3.412 | 3.248 | 2.791 | 1.955 | 1.897 | 1.796 | 1.767 | 1.663 | 1.608 | 1.591 |
| Año | 2005 | 1959 | 1989 | 2011 | 1960 | 1998 | 2009 | 1979 | 1969 | 1957 | ||
| 16 | Excamé | ISP | 3.330 | 2.962 | 2.845 | 2.661 | 2.501 | 2.493 | 2.323 | 2.164 | 2.097 | 1.982 |
| Año | 1994 | 1969 | 2011 | 1967 | 1957 | 1954 | 1951 | 1950 | 1952 | 1972 | ||
Regional analysis: affected climatological stations
To determine in what years the largest number of major, or extreme, droughts occurred (values in table 7), a tabulation was done by geographic region, with 65 rows relative to each year of the analyzed period (1950-2014) and ten columns for the orders of decreasing magnitude (10, 9, , , , 2, 1). After each of the ten years of each register (table 7), the data were transported to the tabulation of the respective region, marking only the occurrence of a drought in its corresponding row and column; the respective orders of magnitude were added together and designated by SUM.
The years in which three or more droughts occurred, that is, affected climatological stations (ECA) with the most extreme droughts are given in table 8. We observe that exclusively the 2011 drought extended over three geographic regions. In the northern region the most extreme droughts were those of 1982 and 2011, with SUM of 27 and 26, respectively. In contrast, in the central region the five years of the most extreme and most frequent droughts were of similar severity. Finally, in the southern region, the droughts in 2011 and 1957 are outstanding for their severity, according to the SUM. From table 8, we deduce that droughts are more frequent in the northern region.
Table 8 Years of major droughts with three or more affected climatological stations (ECA), by geographic regions in the state of Zacatecas, México.
| Northern Region (EC = 6) | Central región (EC = 5) | Southern region (EC = 5) | ||||||
|---|---|---|---|---|---|---|---|---|
| Year | ECA | SUM | Year | ECA | SUM | Year | ECA | SUM |
| 1954 | 3 | 12 | 1954 | 4 | 22 | 1950 | 3 | 14 |
| 1956 | 3 | 9 | 1962 | 3 | 23 | 1957 | 4 | 26 |
| 1964 | 3 | 15 | 1969 | 4 | 23 | 1972 | 3 | 10 |
| 1982 | 3 | 27 | 1982 | 4 | 22 | 1998 | 3 | 17 |
| 1989 | 3 | 16 | 2011 | 3 | 21 | 2011 | 5 | 40 |
| 1998 | 3 | 11 | - | - | - | - | - | - |
| 2011 | 4 | 26 | - | - | - | - | - | - |
| 2012 | 3 | 19 | - | - | - | - | - | - |
Contrast with RDIST
Because the Pedj index is one of the first drought-characterizing algorithms to use mean precipitation and temperature, we believed it convenient to contrast it with a more recent, simpler one that uses potential evapotranspiration as well as precipitation, the RDIST. This contrast was based on percentages of each type of drought defined by the two indexes and on the total number of these events (NTS), which have been concentrated in table 9.
Table 9 Percentages and total number of drought types, estimated with the Pedj index and with the RDIST, at 16 processed climatological stations in the state of Zacatecas, Mexico.
| No. | Station | Region | Estimation with the Pedj drought index | Estimation with RDIST | ||||||||
|---|---|---|---|---|---|---|---|---|---|---|---|---|
| %SL | %SM | %SS | %SE | NTS | %SL | %SM | %SS | %SE | NTS | |||
| 1 | Cañitas de Felipe Pescador | Northern | 44.8 | 31.0 | 20.7 | 3.4 | 29 | 62.1 | 13.8 | 20.7 | 3.4 | 29 |
| 2 | Río Grande | Northern | 43.3 | 36.7 | 10.0 | 10.0 | 30 | 68.8 | 18.8 | 3.1 | 9.4 | 32 |
| 3 | Fresnillo | Northern | 62.9 | 22.9 | 8.6 | 5.7 | 35 | 66.7 | 16.7 | 10.0 | 6.7 | 30 |
| 4 | Leobardo Reynoso | Northern | 44.1 | 38.2 | 17.6 | 0.0 | 34 | 58.6 | 31.0 | 6.9 | 3.4 | 29 |
| 5 | Villa de Cos | Northern | 62.9 | 22.9 | 11.4 | 2.9 | 35 | 74.2 | 12.9 | 9.7 | 3.2 | 31 |
| 6 | Santa Rosa | Northern | 26.7 | 53.3 | 20.0 | 0.0 | 30 | 68.8 | 15.6 | 9.4 | 6.3 | 32 |
| 7 | San Pedro Piedra Gorda | Central | 45.5 | 33.3 | 21.2 | 0.0 | 33 | 60.7 | 21.4 | 7.1 | 10.7 | 28 |
| 8 | Villa García | Central | 42.4 | 39.4 | 18.2 | 0.0 | 33 | 57.1 | 21.4 | 14.3 | 7.1 | 28 |
| 9 | Pinos | Central | 48.6 | 31.4 | 14.3 | 5.7 | 35 | 64.5 | 16.1 | 9.7 | 9.7 | 31 |
| 10 | Zacatecas | Central | 25.0 | 50.0 | 21.9 | 3.1 | 32 | 62.1 | 24.1 | 6.9 | 6.9 | 29 |
| 11 | Villanueva | Central | 40.0 | 43.3 | 13.3 | 3.3 | 30 | 62.1 | 17.2 | 10.3 | 10.3 | 29 |
| 12 | Presa El Chique | Southern | 50.0 | 34.4 | 9.4 | 6.3 | 32 | 65.5 | 20.7 | 3.4 | 10.3 | 29 |
| 13 | Juchipila | Southern | 57.1 | 17.9 | 17.9 | 7.1 | 28 | 69.2 | 19.2 | 0.0 | 11.5 | 26 |
| 14 | Tlaltenango | Southern | 67.5 | 22.5 | 10.0 | 0.0 | 40 | 77.1 | 8.6 | 8.6 | 5.7 | 35 |
| 15 | Nochistlán | Southern | 59.4 | 31.3 | 3.1 | 6.3 | 32 | 57.7 | 23.1 | 7.7 | 11.5 | 26 |
| 16 | Excamé | Southern | 50.0 | 21.9 | 25.0 | 3.1 | 32 | 66.7 | 14.8 | 7.4 | 11.1 | 27 |
| Minimum values | 25.0 | 17.9 | 3.1 | 0.0 | 28 | 57.1 | 8.6 | 0.0 | 3.2 | 26 | ||
| Maximum values | 67.5 | 53.3 | 25.0 | 10.0 | 40 | 77.1 | 31.0 | 20.7 | 11.5 | 35 | ||
Based on the results of the 16 processed climate series of the state of Zacatecas, we observe that both indexes exhibit fluctuating results. The ISP results vary notably in extreme droughts and those of RDIST vary in the severe. Regarding the NTS, which should be 32 or 33, the RDIST index, in general, underestimates the value while the ISP is closer. Both indexes overestimate the magnitude in the Tlaltenango station. Table 10 presents the annual results of both indexes for contrast in the climatological station Cañitas de Felipe Pescador, one of the most discordant of the stations, according to what is observed or deduced from table 9. In table 10 we observed that both indexes detect 22 common years with drought, of the 29 total (table 9) and, of these, the 10 following years coincide in the type of drought identified: 1954, 1956, 1969, 1972, 1975, 1980, 1995, 1997, 1999 and 2010.
Table 10 Annual values of the Pedj and RDIST indexes and their drought types (TS) in the climatological station Cañitas de Felipe Pescador in the state of Zacatecas, Mexico.
| No. | Year | Cañitas de Felipe Pescador | No. | Year | Cañitas de Felipe Pescador | ||||||
|---|---|---|---|---|---|---|---|---|---|---|---|
| ISP | TS | RDIST | TS | ISP | TS | RDIST | TS | ||||
| 1 | 1950 | -0.830 | 0.526 | 34 | 1983 | -0.613 | 0.484 | ||||
| 2 | 1951 | -0.106 | -0.203 | SL | 35 | 1984 | -0.245 | -0.350 | SL | ||
| 3 | 1952 | 0.824 | SL | -1.557 | SS | 36 | 1985 | -0.693 | 0.322 | ||
| 4 | 1953 | -2.123 | 1.486 | 37 | 1986 | -0.692 | 0.060 | ||||
| 5 | 1954 | 0.383 | SL | -0.834 | SL | 38 | 1987 | -0.289 | 0.178 | ||
| 6 | 1955 | -0.283 | -0.007 | SL | 39 | 1988 | -1.042 | 0.564 | |||
| 7 | 1956 | 0.308 | SL | -0.727 | SL | 40 | 1989 | 0.666 | SL | -1.128 | SM |
| 8 | 1957 | -0.735 | -1.501 | SS | 41 | 1990 | -0.426 | 0.391 | |||
| 9 | 1958 | -3.063 | 1.570 | 42 | 1991 | -1.812 | 0.988 | ||||
| 10 | 1959 | -1.781 | 1.027 | 43 | 1992 | -1.289 | 0.233 | ||||
| 11 | 1960 | -1.399 | 0.077 | 44 | 1993 | -0.789 | -0.220 | SL | |||
| 12 | 1961 | -0.934 | -0.152 | SL | 45 | 1994 | 0.430 | SL | 0.061 | ||
| 13 | 1962 | -0.153 | -0.827 | SL | 46 | 1995 | 0.898 | SL | -0.357 | SL | |
| 14 | 1963 | -0.870 | 0.486 | 47 | 1996 | -3.415 | 2.507 | ||||
| 15 | 1964 | -1.351 | 0.459 | 48 | 1997 | 0.874 | SL | -0.656 | SL | ||
| 16 | 1965 | -3.182 | 1.543 | 49 | 1998 | 1.581 | SM | 0.118 | |||
| 17 | 1966 | -1.847 | 0.601 | 50 | 1999 | 2.213 | SS | -1.800 | SS | ||
| 18 | 1967 | -1.860 | 1.024 | 51 | 2000 | 1.533 | SM | -0.186 | SL | ||
| 19 | 1968 | -0.673 | 0.384 | 52 | 2001 | 2.152 | SS | -1.364 | SM | ||
| 20 | 1969 | 1.525 | SM | -1.217 | SM | 53 | 2002 | -0.584 | 1.436 | ||
| 21 | 1970 | -0.784 | 0.633 | 54 | 2003 | -0.373 | 1.199 | ||||
| 22 | 1971 | -0.129 | 0.580 | 55 | 2004 | 0.050 | SL | 0.572 | |||
| 23 | 1972 | 0.973 | SL | -0.555 | SL | 56 | 2005 | 1.043 | SM | 0.053 | |
| 24 | 1973 | -0.876 | 1.149 | 57 | 2006 | 0.633 | SL | 0.580 | |||
| 25 | 1974 | 3.460 | SE | -1.603 | SS | 58 | 2007 | 1.415 | SM | -0.671 | SL |
| 26 | 1975 | 2.512 | SS | -1.680 | SS | 59 | 2008 | -0.014 | 0.626 | ||
| 27 | 1976 | -1.214 | 1.097 | 60 | 2009 | 1.866 | SM | -0.572 | SL | ||
| 28 | 1977 | 2.424 | SS | -1.089 | SM | 61 | 2010 | 0.813 | SL | -0.815 | SL |
| 29 | 1978 | 0.400 | SL | 1.067 | 62 | 2011 | 1.690 | SM | -2.233 | SE | |
| 30 | 1979 | 1.961 | SM | -0.932 | SL | 63 | 2012 | 2.379 | SS | -0.776 | SL |
| 31 | 1980 | 2.925 | SS | -1.778 | SS | 64 | 2013 | -2.652 | 1.614 | ||
| 32 | 1981 | -0.160 | 0.383 | 65 | 2014 | 0.061 | SL | 0.336 | |||
| 33 | 1982 | 1.290 | SM | -0.623 | SL | - | - | - | - | - | - |
Conclusions
The Pedj drought index (ISP), based on the difference in standardized anomalies between mean annual temperature and precipitation, is a quite simple technique that allows detection of annual meteorological droughts at the local and regional levels when these series are analyzed in a common period. For the presented case of the state of Zacatecas, Mexico, 16 ISP series were processed with a 65-year common lapse, from 1950 to 2015, in three geographic regions of the state: northern, central and southern.
Local detection of the droughts was illustrated in table 3, while the regional results of the years with three or more affected climatological stations, according to table 8, were 1950, 1954, 1956, 1957, 1962, 1964, 1969, 1972, 1982, 1989, 1998, 2011 and 2012. Only the drought in 2011 had major generalized presence.
Because of the simplicity of calculating the ISP series and the implicit importance of the results of local and regional analyses for detection and follow-up of annual meteorological drought, we recommend its systematic application. This would permit verifying the results of other drought indexes, as shown in the section in which ISP and RDIST are contrasted. Moreover, it would make it possible to broaden understanding of the behavior of drought as a chronological series with the aim of forecasting (Mishra and Singh, 2011).
Acknowledgements
The author thanks Humberto Abelardo Díaz Valdez of the Local Zacatecas Office of CONAGUA for providing updates of the climatological information processed.
The author is grateful for the comments and suggestions of anonymous referees 1 and 2. The corrections of the first improved the presentation of the results and contributed to their interpretation. The suggestions of the second referee led to the contrast with RDIST.
REFERENCES
Almanza, R., & López, S. (1975). Radiación solar global en la república mexicana mediante datos de insolación (20 pp.). Series del Instituto de Ingeniería 357. México, DF: UNAM. [ Links ]
Campos-Aranda, D. F. (2005). Estimación de la evapotranspiración. Capítulo 3 (pp. 65-96). En: Agroclimatología cuantitativa de cultivos. México, DF: Editorial Trillas. [ Links ]
Campos-Aranda, D. F. (2014). Comparación de tres métodos estadísticos para detección y monitoreo de sequías meteorológicas. Agrociencia, 48(5), 463-476. [ Links ]
Campos-Aranda, D. F. (2015). Búsqueda de tendencias en la precipitación anual del estado de Zacatecas, México; en 30 registros con más de 50 años. Ingeniería. Investigación y Tecnología, 16(3), 357-370. [ Links ]
Elagib, N. A., & Elhag, M. M. (2011). Major climate indicators of ongoing drought in Sudan. Journal of Hydrology, 409(3-4), 612-625. [ Links ]
Gruza, G., Rankova, E., Razuvaev, V., & Bulygina, O. (1999). Indicators of climate change for the Russian Federation. Climatic Change, 42(1), 219-242. [ Links ]
Hargreaves, G. H., & Samani, Z. A. (1982). Estimating potential evapotranspiration. Journal of the Irrigation and Drainage Division, 108(IR3), 225-230. [ Links ]
Kunkel, K. E., Pielke, R. A., & Changnon, S. A. (1999). Temporal fluctuations in weather and climate extremes that cause economic and human health impacts: A review. Bulletin of the American Meteorological Society, 80(6), 1077-1098. [ Links ]
Lobato-Sánchez, R. (2016). El monitor de la sequía en México. Tecnología y ciencias del agua, 7(5), 197-211. [ Links ]
Machiwal, D., & Jha, M. K. (2008). Comparative evaluation of statistical tests for time series analysis: Applications to hydrological time series. Hydrological Sciences Journal, 53(2), 353-366. [ Links ]
Machiwal, D., & Jha, M. K. (2012). Methods for time series analysis (Chapter 4, pp. 51-84). In: Hydrologic time series analysis: Theory and practice. Dordrecht, The Netherlands: Springer. [ Links ]
Mawdsley, J., Petts, G., & Walker, S. (1994). Assessment of drought severity (41 pp.). Occasional Paper No. 3. London: British Hydrological Society. [ Links ]
Mishra, A. K., & Singh, V. P. (2010). A review of drought concepts. Journal of Hydrology , 391(1-2), 202-216. [ Links ]
Mishra, A. K., & Singh, V. P. (2011). Drought modeling-A review. Journal of Hydrology , 403(1-2), 157-175. [ Links ]
Potop, V., & Soukup, J. (2009). Spatiotemporal characteristics of dryness and drought in the Republic of Moldova. Theoretical and Applied Climatology, 96(3-4), 305-318. [ Links ]
Qian, W., & Zhu, Y. (2001). Climate change in China from 1880 to 1998 and its impact on the environmental conditions. Climatic Change , 50(4), 419-444. [ Links ]
Tsakiris, G., & Vangelis, H. (2005). Establishing a drought index incorporating evapotranspiration. European Water, 9/10, 3-11. [ Links ]
Tsakiris, G., Tigkas, D., Vangelis, H., & Pangalou, D. (2007). Regional drought identification and assessment. Chapter 9 (pp. 169-191). In: Methods and tools for drought analysis and management. Rossi, G., Vega, T., & Bonaccorso, B. (eds.). Dordrecht, The Netherlands: Springer . [ Links ]
World Meteorological Organization, WMO. (1971). Standard tests of significance to be recommended in routine analysis of climatic fluctuations (Annexed III, pp. 58-71). InClimatic Change . Technical Note No. 79, WMO-No. 195. Geneva: Secretariat of the World Meteorological Organization. [ Links ]
Received: October 12, 2015; Accepted: January 09, 2017
 Este es un artículo publicado en acceso abierto bajo una licencia
Creative Commons
Este es un artículo publicado en acceso abierto bajo una licencia
Creative Commons
