


Services on Demand
Journal
Article
 text in
  Spanish (pdf)
 Article in xml format
 Article references
 Send this article by e-mail
Indicators
-
 Cited by SciELO
 -
 Access statistics
Related links
-
 Similars in
SciELO
Similars in
SciELO
Share

 Permalink
Tecnología y ciencias del agua
On-line version ISSN 2007-2422
Tecnol. cienc. agua vol.9 n.1 Jiutepec Jan./Feb. 2018 Epub Nov 24, 2020
https://doi.org/10.24850/j-tyca-2018-01-04
Articles
Study of the bacteriological quality and physiochemical parameters of water from the Irrigation District 023
1Universidad Autónoma de Querétaro, Querétaro, México, nmorales17@alumnos.uaq.mx
2Universidad Autónoma de Querétaro, Querétaro, México, edelatorre05@alumnos.uaq.mx
3Universidad Autónoma de Querétaro, Querétaro, México, vgarcia10@alumnos.uaq.mx
4Universidad Autónoma de Querétaro, Querétaro, México, chagcarlos@uaq.mx
San Juan del Río, Querétaro (Mexico), is one of the most important industrial regions of the state, which has led to a great demographic development and the increase in the demand of resources to meet the needs of the growing population, especially in water resources, such as the Irrigation District 023 (DR 023), in which 11 048 ha are destined to the production of crops of agricultural importance. However, with population growth of recent years, urban areas have developed near the canal network, which carries the wastewater discharge to the distribution network. In this work the concentrations of fecal coliform bacteria in the water of 53 points of the DR 023 in April 2015, and the physicochemical conditions were examined. Also, fecal coliform obtained levels were compared with those permitted by the Federal Law of Rights and Applicable Disposition on Matters of National Waters 2015 and NOM-001-Semarnat-1996. We found that most of the points on which sample was obtained, showed high levels of fecal coliform and physicochemical conditions not appropriate for use in irrigation. These results indicate the need for constant monitoring of water bodies for agriculture in the region, as fecal indicator organisms indicate the potential presence of pathogens in the water.
Keywords: Water contamination; fecal coliform; bacteriological quality
San Juan del Río, Querétaro (México), es una de las regiones industriales más importantes del estado, lo que ha llevado a un gran desarrollo demográfico y el incremento en la demanda de recursos para satisfacer las necesidades de la población creciente, sobre todo en los recursos hídricos, como es el caso del Distrito de Riego 023 (DR 023), en el cual, 11 048 ha son destinadas a la producción de cultivos de importancia agrícola. Sin embargo, el problema que se presenta es que con el crecimiento demográfico de los últimos años, las áreas urbanas se han desarrollado cerca de la red de canales, lo que lleva consigo a la descarga de aguas negras a la red de distribución. En este trabajo se examinaron las concentraciones de bacterias coliformes fecales en el agua de 53 puntos del DR 023 en abril de 2015, así como las condiciones fisicoquímicas. Además, se compararon los niveles de coliformes fecales obtenidos con los permitidos por la Ley Federal de Derechos y Disposiciones Aplicables en Materia de Aguas Nacionales 2015 y la NOM-001-Semarnat-1996. Se encontró que la mayoría de los puntos en los que se obtuvo muestra presentaron niveles altos de coliformes fecales y condiciones fisicoquímicas no ideales para su uso en el riego de cultivos. Estos resultados denotan la necesidad de un monitoreo constante de los cuerpos de agua destinados a la agricultura en la región, ya que los microorganismos indicadores fecales indican la potencial presencia de patógenos en el agua.
Palabras clave contaminación del agua; coliformes fecales; calidad bacteriológica
Introduction
Due to the increase of population worldwide, water demand has increased by the need to produce more food (Mazari-Hiriart et al., 2008). In Mexico, much of the water is used in agriculture (Comisión Nacional del Agua, 2014a), however, the demand for fresh water is higher than its availability for agriculture, reason why treated and untreated wastewater (Huibers & Van Lier, 2005; Mazari-Hiriart et al., 2008) is used.
As mentioned in the study by Mazari-Hiriart et al. (2008), Mexico is one of the main countries that uses treated wastewater for irrigation, and yet most of the time, there is no control of water quality. Given the origin of this type of water, there are standards that establish physical, chemical and biological indicators such as fecal coliforms, helminth eggs, Biochemical Oxygen Demand at five days (BOD5), Chemical Oxygen Demand (DQO) and Total Suspended Solids (TSS), pH and temperature (Conagua, 2014a, 2014b; NOM-001-Semarnat-1996) that establish their respective maximum permissible limit to maintain the quality required according to use and destiny (Conagua, 2013). Studies about quality water have been conducted in different Irrigation Districts of the Mexican Republic. For example, Ahumada et al. reported a large number of fecal coliform bacteria, of the genus Enterobacter, Escherichia and Kluyvera in a 3.6 km section of La Michoacana channel in Navolato, Sinaloa. This was attributed to the fact that the channel receives irrigation runoff, discharges of domestic drainage, wastewater and solid waste (Ahumada-Santos et al., 2014).
Similar studies in the DR 035, La Antigua Veracruz, DR 009 Valle de Juárez, Chihuahua and DR 049, Río Verde, San Luis Potosi reported that the amounts of fecal coliforms are above those indicated by NOM-001-Semarnat-1996 (Megchún-García et al., 2015; Olivas-Enriquez et al., 2011; Sarabia-Meléndez, Cisneros-Almazán, Aceves-de-Alba, Durán-García, & Castro-Larragoitia, 2011) and even in a study conducted in the Mezquital Valley within the DR 003 and DR 100, the presence of clinically important parasites such as Ascaris lumbricoides, Giardia lamblia and Entamoeba histolytica was reported ( Cifuentes, Blumenthal, Ruíz-Palacios, Bennett, & Peasey, 1994; Hernández-Acosta, Quiñones-Aguilar, Cristóbal-Acevedo, & Rubiños-Panta, 2014).
Regarding the physicochemical variables in the DR 030, pH levels, temperature, total dissolved solids, electrical conductivity, salinity, among others were examined and it was determined that the water of that site is not recommended for agricultural use (Bonilla, Ayala-Osorio, González-Contreras, Santamaría-Juárez, & Silva-Gómez, 2016).
In a study by Saldaña-Fabela, Díaz-Pardo and Gutiérrez-Hernández (2011) the physicochemical quality of water was analyzed in three points of the DR 023, San Juan del Río. In this study it was concluded that the water of this region is not suitable for use in agricultural irrigation, as well as in the conservation of biota and fish farming, besides considering the system as eutrophic.
The physicochemical and bacteriological information of water in the DR 023 is scarce, however the region is classified in environmental risk since it has a high degree of pollution (Saldaña-Fabela, Díaz-Pardo, & Gutiérrez-Hernández, 2011; Vázquez-Sánchez & Pineda-López, 2010), reason why it requires an update. The aim of this study was to present an analysis of the water quality in the DR 023 in April 2015, in order to ascertain the current state of the region's water resources, as well as to warn of a possible contamination risk in water bodies, the DR 023 water is expected to be contaminated mainly by the different discharges of wastewater that receives, due to the lack of monitoring to regulate these sources of pollution.
Materials and methods
Description of the study area
Irrigation district 023 is located between the municipalities San Juan del Río and Pedro Escobedo in the state of Querétaro and has an area of 11 048 ha. The water for irrigation is obtained from the dams San Ildefonso, Constitution of 1917, La Llave, from the border la Venta and 54 deep wells (Cisneros Estrada & Castanedo Guerra, 2014). A random sampling was carried out at 44 points, 1 sample per point, in the supply network of irrigation water in the DR 023: 5 dams, 4 dikes, 3 main channels, 17 lateral channels, 2 sublateral channels, 2 at different points of the San Juan River, 3 intake works, 2 sources of supply and 6 treated water discharges, and 9 points in the drains with location close to some sampling points (table 2). The results shown in this table are explained in detail in the results section.
Table 2 Description of temperature conditions, electrical conductivity, dissolved solids, hydrogen potential (pH), and CFU average for total coliforms, fecal and enterobacteria of the sampling collection points (P < 0.05) of the Irrigation District 023, as well as the classification of the types of water according to the Official Mexican Standard NOMCCA-033-ECOL/1993. The "-" dash was used for data that does not fall into the classification according to the standard. The "x" sign was used for samples that did not show total coliforms and did not fall within the classification of the standard.
| CFU/100 ml average | ||||||||||
|---|---|---|---|---|---|---|---|---|---|---|
| Point | Name | Temperature (°C) | Electrical conductivity (mS/cm) | Dissolved solids (ppm) | pH | Total coliforms | Fecal coliforms | Enterobacteria | Type of water according to the fecal coliform load (NOMCCA-033-ECOL/1993) | Type of water according to the fecal coliform load total (NOMCCA-033-ECOL/1993) |
| 1 | Discharge Kimberly | 30 | 0.37 | 200 | 7.6 | 3.7x10⁷ | 0 | 8.5 x10³ | - | - |
| 2 | Constitución 1857 dam | 18 | 0.09 | 78 | 8.2 | 5.1 x10⁴ | 5.3 x10³ | 6.7 x10³ | Tipo 3 | - |
| 3 | Desander Constitución 1857 | 17 | 0.1 | 82 | 7.5 | 1 x10⁵ | 0 | 2.3 x10⁴ | - | - |
| 4 | Lomo de Toro diverter dam | 19.6 | 0.05 | 97 | 7 | 3.8 x10⁴ | 3 x10³ | 1.4 x10⁴ | Tipo 3 | - |
| 5 | Lomo de Toro gaging station | 20.2 | 0.1 | 80 | 6.9 | 0 | 0 | 0 | - | x |
| 6 | Kimberly lateral channel | 21.6 | 1.29 | 950 | 7.6 | 8.9 x10⁴ | 1 x10³ | 9.3 x10³ | Tipo 2 | - |
| 7 | Kimberly farm intake | 21.6 | 1.1 | 96.9 | 8 | 3.5 x10⁵ | 4 x10³ | 3.7 x10⁴ | Tipo 3 | - |
| 8 | Lateral 6+640 | 20.2 | 0.1 | 80 | 7.3 | 9.4 x10⁴ | 2 x10³ | 5.3 x10³ | Tipo 3 | - |
| 9 | Dike well 7 | 20.7 | 0.1 | 82 | 7.2 | 4.9 x10⁴ | 2 x10³ | 5 x10³ | Tipo 3 | - |
| 10 | La Llave dam | 18.4 | 1.52 | 388 | 6.6 | 2.9 x10⁶ | 1.7 x10⁶ | 3 x10³ | Tipo 4 | - |
| 11 | Drain Culebra | 19.8 | 0.77 | 580 | 7.1 | 1.6 x10⁸ | 2.2 x10⁷ | 1.7 x10⁴ | Tipo 4 | - |
| 12 | Drain Santa Matilde (middle point) | 21.1 | 0.44 | 305 | 6.8 | 1.1 x10⁶ | 5.6 x10⁵ | 1.7 x10³ | Tipo 4 | - |
| 13 | Drain Caracol Organal | 20.3 | 0.34 | 200.49 | 6.9 | 3.1 x10⁴ | 1.6 x10³ | 2.8 x10³ | Tipo 3 | - |
| 14 | Sublateral 9+345 | 21.8 | 0.16 | 124 | 7.3 | 7.8 x10⁴ | 3 x10⁴ | 8.5 x10³ | Tipo 3 | - |
| 15 | Lateral 8+705 bridge | 22.2 | 0.19 | 146 | 8.9 | 1.2 x10⁸ | 2.1 x10⁷ | 3.4 x10⁴ | Tipo 4 | - |
| 16 | Lateral 9+345 after well 17 | 24.3 | 0.13 | 98 | 7.4 | 3.3 x10⁴ | 1.1 x10⁴ | 5.5 x10⁴ | Tipo 3 | - |
| 17 | Lateral 8+705 next to well 15 | 21 | 0.08 | 70 | 7.6 | 2.0 x10⁴ | 1.3 x10³ | 9.9 x10³ | Tipo 3 | - |
| 18 | Lateral 10+795 next to well 23 | 21.6 | 0.08 | 62 | 7.4 | 2.5 x10⁴ | 5.3 x10³ | 5.1 x10⁴ | Tipo 3 | - |
| 19 | Drain Santa Matilde (beginning) | 21.7 | 0.32 | 240 | 7.2 | 4.2 x10⁴ | 2.6 x10³ | 1.4 x10⁴ | Tipo 3 | - |
| 20 | Damping tank drain Caracol | 22 | 0.2 | 223 | 6.7 | 2.3 x10³ | 0 | 3 x10² | - | - |
| 21 | Outlet works Constitución 1917 dam | 26.4 | 0.12 | 51 | 8.3 | 2.6 x10⁴ | 1 x10³ | 8.9 x10³ | Tipo 2 | - |
| 22 | Lateral 2+607 | 23.7 | 0.12 | 92 | 6.7 | 7.2 x10⁴ | 4.3 x10⁴ | 6.4 x10³ | Tipo 3 | - |
| 23 | Lateral 8+100 | 24.6 | 0.12 | 99 | 7.3 | 4 x10⁴ | 2 x10⁴ | 4.3 x10³ | Tipo 3 | - |
| 24 | Lateral 8+590 initial point | 23.6 | 0.1 | 87 | 7.3 | 8.3 x10⁴ | 5 x10⁴ | 4.5 x10³ | Tipo 3 | - |
| 25 | Lateral 13+103 | 23.2 | 0.14 | 10 | 7.1 | 6.2 x10⁴ | 3.6 x10⁴ | 6.7 x10³ | Tipo 3 | - |
| 26 | Lateral 13+163 (inicio) next to well 41 | 24.1 | 0.15 | 117 | 7.1 | 1 x10⁵ | 6.6 x10⁴ | 1.6 x10⁴ | Tipo 3 | - |
| 27 | Lateral 17+810 of to well 44 | 25.7 | 0.15 | 114 | 6.8 | 4.9 x10⁴ | 1.6 x10⁴ | 6.2 x10³ | Tipo 3 | - |
| 28 | Radial dike 9 | 27.5 | 0.27 | 199 | 6.7 | 0 | 0 | 1 x10³ | - | x |
| 29 | La Venta dam | 27.3 | 0.35 | 250 | 9.3 | 7.8 x10⁴ | 1.3 x10⁴ | 1.4 x10⁴ | Tipo 3 | - |
| 30 | Drain Culebra (beginning) | 22.8 | 0.59 | 429 | 7.3 | 1.4 x10⁷ | 1.9 x10⁶ | 2 x10⁴ | Tipo 4 | - |
| 31 | Outlet works La Venta dam | 27.8 | 0.23 | 167 | 8.2 | 7.3 x10⁴ | 3.3 x10³ | 3.4 x10⁴ | Tipo 3 | - |
| 32 | Lateral chanel 13+103 (final) well 38 | 24.8 | 0.34 | 245 | 8.8 | 9.6 x10³ | 3.6 x10⁴ | 2.8 x10⁴ | Tipo 3 | - |
| 33 | La D drain | 24.9 | 0.62 | 448 | 7.5 | 2.8 x10⁶ | 1.4 x10⁶ | 3.9 x10³ | Tipo 4 | - |
| 34 | Lateral 8+590 before the Panamericana road | 22.4 | 0.12 | 98 | 7.8 | 7.3 x10⁴ | 4.3 x10⁴ | 4.8 x10³ | Tipo 3 | - |
| 35 | Sublateral 2+407 road to Chintepec | 23.8 | 0.12 | 92 | 9.5 | 1 x10⁵ | 3 x10³ | 6.3 x10⁴ | Tipo 3 | - |
| 36 | Lateral 8+100 crross to road to Chintepec | 24 | 0.12 | 95 | 8.7 | 3.3 x10⁴ | 1.3 x10⁴ | 2.8 x10³ | Tipo 3 | - |
| 37 | Lateral 8+100 (final) | 26.7 | 1.22 | 880 | 7.5 | 1.3 x10⁶ | 0 | 1 x10³ | - | - |
| 38 | Channel of called pumps "La Valla" | 23 | 1.85 | 1354 | 7.5 | 2.1 x10⁷ | 1.3 x10⁶ | 4.9 x10³ | Tipo 4 | - |
| 39 | Lourdes drain | 22.7 | 1.78 | 1322 | 7.6 | 1.3 x10⁷ | 3.6 x10⁶ | 9 x10³ | Tipo 4 | - |
| 40 | Culebra drain, bridge | 26.4 | 1.56 | 1133 | 7.6 | 1.8 x10⁷ | 3.3 x10⁵ | 3.2 x10³ | Tipo 4 | - |
| 41 | Outlet works San Ildelfonso point 1 | 15 | 0.09 | 73 | 7.5 | 0 | 0 | 1.2 x10³ | - | x |
| 42 | Outlet works San Ildelfonso point 2 | 15.2 | 0.09 | 66 | 7.8 | 1.6 x10³ | 0 | 6 x10² | - | - |
| 43 | Vessel of the San Ildelfonso dam | 21.1 | 6.1 | 79 | 8.6 | 8.7 x10⁴ | 3.5 x10⁴ | 1.2 x10⁴ | Tipo 3 | - |
| 44 | Ñado waterfall | 17.4 | 0.17 | 130 | 7.4 | 3.6 x10³ | 0 | 2.4 x10³ | - | - |
| 45 | Prieto river | 21.7 | 0.06 | 47 | 7.3 | 8.3 x10³ | 0 | 3.1 x10³ | - | - |
| 46 | Left arm Río San Juan | 22 | 5.15 | 10000 | 8.6 | 9.7 x10⁴ | 3.3 x10³ | 1.4 x10⁴ | Tipo 3 | - |
| 47 | Discharge of the treatment plant San Pedro 2 | 28.5 | 2.41 | 1720 | 7.5 | 7.8 x10⁶ | 4.1 x10⁶ | 9.5 x10³ | Tipo 4 | - |
| 48 | Downstream of the discharge San Pedro 1 | 27 | 2.73 | 10000 | 7.7 | 1.4 x10⁸ | 4.1 x10⁷ | 4.1 x10³ | Tipo 4 | - |
| 49 | San Pedro 1 Municipal discharge | 27.6 | 7.58 | 10000 | 7.5 | 8.4 x10⁶ | 4.2 x10⁶ | 3.8 x10⁴ | Tipo 4 | - |
| 50 | Discharge Ponderosa | 27.8 | 2.2 | 1644 | 7.5 | 3.7 x10⁶ | 1.7 x10⁶ | 3.8 x10³ | Tipo 4 | - |
| 51 | Before the discharges | 26.5 | 4.7 | 10000 | 7.9 | 5.2 x10⁷ | 2.1 x10⁷ | 6.5 x10³ | Tipo 4 | - |
| 52 | San Juan river | 28.2 | 2.98 | 10000 | 7.3 | 7.9 x10⁶ | 5.6 x10⁶ | 2.7 x10³ | Tipo 4 | - |
| 53 | Lateral channel 2+607 after the well 27 | 25.2 | 0.13 | 98 | 8.2 | 6.3 x10⁴ | 5.3 x10³ | 1 x10⁴ | Tipo 3 | - |
Sample collection
According to the availability of water during April 2015, samples of 53 points were taken in the District of Irrigation 023, San Juan del Río (figure 1). The water samples were collected in 100 ml plastic bottles, previously labeled. They were covered with aluminum foil and deposited in ice buckets for later analysis in the laboratory. Physico-chemical values of pH, electrical conductivity (EC), total dissolved solids (TDS) and temperature (T) were obtained with the HI9813 -5 portable Multiparameter Meter in the same area where the water samples were taken (table 2).

Isolation of coliforms and enterobacteria
Under sterile conditions in the laboratory, samples were homogenized and according to the degree of turbidity, dilutions were made with sterile distilled water. From the dilution obtained, one milliliter was taken and, in triplicate, inoculated into 3M™ Petrifilm™ Plates for coliforms and enterobacteria, following the manufacturer's instructions. However, this method lacks the sensitivity needed to be able to identify at the genus level (eg., Escherichia, Klebsiella) but allows us to distinguish between groups of bacteria that can ferment lactose and are associated with pathogens. The plates were incubated at 37 °C for 24 hours. The coliform count was carried out by the method approved by the French Association for Standardization (3M Microbiology [3M], 2003), which consists of counting all red colonies with or without gas production. In some cases where colony growth was abundant (higher than 150 CFU), the counting was done by quadrants, in which the colonies of several representative quadrants are counted, the average is obtained and multiplied by 20 (since the growth area of the plate is 20 cm2). For the water quality analysis, the quadrants were compared with the maximum permissible limits of fecal coliforms of the NOM-001-Semarnat-1996, as this Standard regulates the levels of pollutants in the discharges of wastewater which are poured into national waters and properties, however, at present there is not a standard to regulate the quality of water being specific to national assets or the irrigation water, for this reason, we take the Federal Law of Rights, Disposion Applicable on Matter of National Waters 2015 (table 1) to compare the samples belonging to the entire distribution network except for the points corresponding to drains.
Table 1 Standards used as reference to establish the maximum permissible limits.
| Standar | Parameter | Maximum limit | Type of water |
|---|---|---|---|
| NOM-001-Semarnat-1996 | Fecal coliforms | 1 000 - 2000 MPN per each 100 ml | Wastewater discharges |
| pH | 5-10 | ||
| Temperature | 40 °C | ||
| Federal Law of Rights. Disposition Applicable on Matters of National Waters 2015 | Fecal coliforms | 1 000 MPN per each 100 ml | National waters: seas lagoons, estuaries, lakes, water of constant and intermittent streams, rivers and direct and indirect tributaries, springs, channels, vessels, banks and underground water |
| pH | 6.0 - 9.0 | ||
| Dissolved solids | 500 mg/l |
Statistical tests
Data of the samples were classified into groups according to the origin of the sample: lateral, sublateral, sources of supply, main channels, discharges, dams, dikes, and intake works and drain. By not complying with the assumptions of normality, a nonparametric unilateral test (Kruskal-Wallis) was performed to see the differences between the means of the groups, and then the Dunn’s test was performed, which is a multiple comparison test and is applied when rejection of the Kruskal -Wallis test occurs and determines differences or similarities within the groups that were sampled.
Results
a) Summary of physicochemical data and type of water according to the load of total fecal coliforms
Physicochemical conditions such as pH, T, TDS and EC, are shown in table 1. These results were compared when applicable, with the maximum permissible values established by the Federal Law of Rights and Disposition Applicable on Matter of National Waters 2014 and NOM-001-Semarnat-1996.
In general, the water temperature was in a range between 15 °C and 30 °C, in which, the point of the San Ildefonso intake work point 1 and San Ildefonso intake work point 2 were the sites that showed the lowest temperature (15 and 15.2 °C respectively) while the discharge of the Kimberly company was the point with the highest temperature (30 °C). The temperature of discharges was compared to the values indicated by the NOM-001-Semarnat-1996; none of the discharges exceeded the limit of 40 °C (table 2).
Regarding the EC, the minimum value was 50 μS/cm and the resulting maximum value was 7580 μS/cm, which corresponded to the municipal discharge called San Pedro 1. Any legislation or Mexican Standards do not regulate EC values, so they were not compared with standard values (table 2), however the effect of this parameter on water quality will be discussed later.
In the case of dissolved solids, the Federal Law of Rights and Disposition Applicable on Matter of National Waters 2015, was taken as a base, which indicates a maximum value of 500 mg/L. In the DR 023 it was observed that the points left arm San Juan river, downstream municipal discharge San Pedro 1, upstream of the discharges and the San Juan River, were the sites with the highest dissolved solids value with a value of 1 0000 ppm while the minimum value obtained was 10 ppm corresponding to the lateral 13 + 103. The obtained highest values even exceed the maximum limits for drinking water established by NOM-127-SSA1-1994, which establishes as maximum value 1 000 ppm.
The pH values were in the range of 6.6 and 9.5. Regarding the water of discharges, no point exceeded the pH limit indicated by NOM-001-Semarnat-1996 (pH 10). However, when comparing the values obtained with the Federal Law of Rights and Disposition Applicable on Matter of National Waters 2015, the points that exceeded the maximum limit of pH was the dam La Venta and the sublateral 2+407 that is located in the road to Chintepec with a pH 9.3 and 9.5 respectively.
To verify the validity of water use in irrigation of vegetables and to know the bacteriological conditions of the DR 023 water, the sampling points were classified as indicated by NOM-CCA-033-ECOL / 1993 regarding total coliforms and fecal coliforms in 100 ml of water. A total of 15 points were classified as water type IV, which is water containing over 100,000 fecal coliforms, 26 points are in the type III category that is that containing from 1001 to 100,000 fecal coliforms, two points as water type II containing from 1 to 1 000 fecal coliforms and finally three points were found as water type I containing less than 1 000 total coliforms. Seven points could not be classified according to NOM-CCA-033-ECOL/1993 because the growth of fecal coliforms was less than 1 000 (table 2).
b) Count of Fecal Coliforms at the sampling points
Of the 53 analyzed points of the DR 023 samples of six discharges of water were obtained (figure 2), of which, when counting the CFU of fecal coliforms, it was observed that all samples, except the Kimberly discharge, exceeded the limit maximum indicated by NOM-001-Semarnat-1996 (figure 2). The points with the highest amount of fecal coliforms in the discharges were the municipal discharge San Pedro 1 with 41x106 CFU in 100 ml of water. The Ponderosa discharge was the one that presented the least amount of fecal coliforms with 1.73x10⁶ CFU in 100 ml.
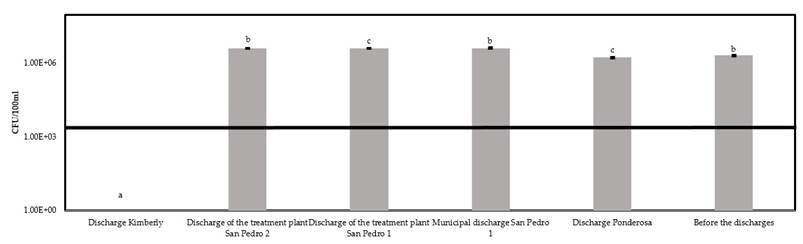
Figure 2 Recount of CFU of fecal coliforms in water of discharges of the Irrigation District 023. The black line represents the maximum permissible limit of fecal coliforms (2000 in each 100 ml as MPN equivalent to CFU) established by the standard NOM-001-Semarnat-1996. The graph is represented in logarithmic scale. a, b, c Equal letters indicate that the samples are statistically equal (P < 0.05).
The water quality of dams is governed under the limits indicated by the Federal Law of Rights and Disposition Applicable on Matter of National Waters 2015. Five dams were sampled in the Irrigation District 023 (figure 3) and in all cases, the amounts of fecal coliforms are above the maximum permissible limit; the 1917 Constitution dam is the point with the lowest amount of fecal coliforms, although it is just within the maximum permissible limit (1 000 CFU/ 100 ml). The point with the highest amount of fecal coliforms corresponds to the dam La Llave with 1.73x10⁶ CFU/100 ml (figure 3).
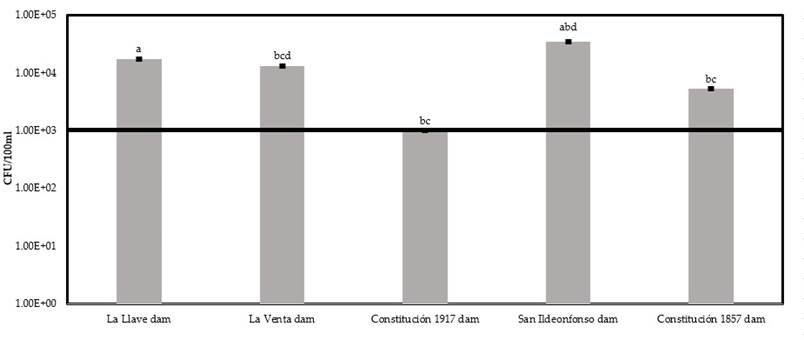
Figure 3 Recount of CFU of fecal coliforms in dam water of the Irrigation District 023. The black line represents the maximum permissible number of fecal coliforms (1 000/100 ml as MPN equivalent to CFU) established by the Federal Law of Rights and Disposition Applicable on Matters of National Waters 2015. The graph is in logarithmic scale. a, b, c, d Equal letters indicate that the samples are statistically the same (P < 0.05).
Of the four points corresponding to dikes, two exceeded the maximum permissible limit of fecal coliforms. The maximum number of fecal coliforms for dikes was 3x10³ CFU/100 ml, while the points corresponding to the Desander Constitution 1857 and Radial Dike 9 did not present growth of fecal coliforms.
Three points of the two Intake Works in the DR 023 (table 1) were sampled, of these; the intake work of the dam La Venta exceeded the limit indicated by the Federal Law of Rights and Disposition Applicable on Matter of National Waters 2015, with 3.3x10³ CFU in 100 ml of water.
Two sub-laterals were sampled (table 1) and both exceeded the corresponding limit of fecal coliforms, being the sublateral 9+500 the point with the highest number of fecal coliforms with 30.6x10³ CFU/100 ml. Within the DR 023, the three sampled lateral channels showed fecal coliform growth above the permissible limit (table 1). The lateral channel with the largest amount of fecal coliforms is the lateral channel 2+607, while the lateral channel Kimberly is located right at the maximum limit of fecal coliforms (1 000 CFU/100 ml).
A sample of two distinct points of the San Juan River (figure 4) was taken, and in both points the maximum permissible limit of fecal coliform bacteria according to the standard 5.66x10⁶ CFU/100 ml. was exceeded. The San Juan River left arm had much less fecal coliforms but still exceeded the limit with 3.33 x 10³ CFU/100 ml.
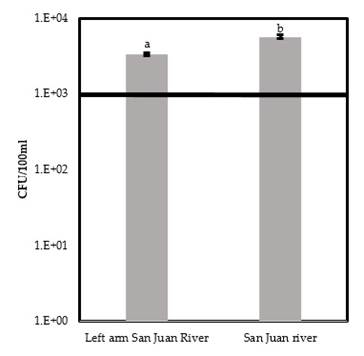
Figure 4 Recount of CFU in water of different points of the San Juan River of the Irrigation District 023. The black line represents the maximum permissible number of fecal coliforms (1 000/100 ml as MPN equivalent to CFU) established by the Federal Law of Rights and Disposition Applicable on Matters of National Waters 2015. a, b Equal letters indicate that the samples are statistically the same (P < 0.05).
Also, nine drains of the DR 023 were sampled (table 1). Because of its origin, this type of water is not governed by any standard indicating fecal coliform limitation, however, almost all of them, with the exception of the Caracol drainage Tank, presented high amounts of fecal coliforms, whereas the point where more fecal coliforms was obtained was the drain Culebra with 22.66x10⁶ CFU/100 ml.
On the other hand, the water of laterals (table 1) had contrasting results with respect to the count results of the CFU, since only water from the lateral 8+100 final did not present fecal coliforms (table 1), while all the remaining laterals presented a large number of CFU exceeding the limit set by the Federal Law of Rights and Disposition Applicable on Matter of National Waters 2015, being the lateral 8+705 bridge, the point with more coliforms with 21.66x10⁶ CFU per each 100 ml. Three main channels were sampled in the Irrigation District 023 (10), on these, two points; the channel called pumps "La Valla" and discharge channel Kimberly, exceeded the limit set by the Federal Law of Applicable Rights and Disposition on Matters of National Waters 2015, with 1.33x10⁶ and 4x10³ CFU/100 ml respectively. In the case of the other main channel, the gaging station Lomo de Toro did not present a growth of fecal coliform bacteria.
Discussion
Due to the arid conditions of Mexico, the use of any economical and effective source of water has been blocked to promote the mass development of agricultural products (Pescod, 1992). However, certain physicochemical variables such as pH, electrical conductivity, total dissolved solids and temperature must be considered and evaluated to guarantee the use of different water sources, since they influence the survival of microorganisms in the water (Ayers & Westcost, 1994; Medema et al., 2013). According to Pescod (1992) and Ayers and Westcost (1994), the ideal interval of irrigation water relative to pH ranges from 6.5 to 8.4; according to this, the water in most of the sampled sites is ideal for growing vegetables, with the exception of seven points, which correspond to the sublateral 2+407 road to Chintepec, La Venta dam, lateral 8+705 bridge, lateral channel 13+103 (final), well 38, lateral 8+100 crossing on the road to Chintepec, Vessel of the San Ildelfonso dam and the left arm San Juan River. Points like the Intake Work of the dam Constitution 1917, dam Constitution 1857, Intake Work of the dam La Venta, lateral channel 2+607 after well 27 are close to reaching and exceeding the established level. In Mexico, the Federal Law of Rights and Disposition Applicable on Matter of National Waters 2015 indicates a maximum value of 9 units, so under this limit the water of the dam La Venta and the sublateral 2+407 road to Chintepec, are not viable for crop irrigation. In the case of water of discharges which are subject to another pH limit value, no site exceeded the limits set by NOM-001-Semarnat-1996.
Total dissolved solids (TDS) is a variable that indicates the value of inorganic and organic compounds in water bodies (Fipps, 2003), many of which are used by microorganisms to proliferate and develop. In general, the Federal Law of Rights and Disposition Applicable on National Waters 2015 indicate a value for TDS of 500 ppm in water destined for agricultural irrigation. Based on this, in the DR 023 there are 13 sites, among which stands out San Juan River, left arm San Juan River, downstream the discharge San Pedro 1, municipal discharge San Pedro 1 and before the discharges, discharge of the treatment plant San Pedro 2, discharge Ponderosa, channel of the so-called pumps La Valla. Fipps (2003) classified the possible use of irrigation water based on the amount of TDS and according to this classification, the waters of the 13 points listed above are classified as permissible (525-1,400 ppm), doubtful (1,400-2,100) and inadequate (≥ 2,100) to be used in irrigation. Ayers & Westcost (1994) also considers values similar to Fipps (2003) but with a different classification, since in this case it indicates values of water restriction to be used in irrigation; according to this, it is severely restricted the use of water of the left arm San Juan River, downstream of the discharge San Pedro 1, municipal discharge San Pedro 1, before discharges and the San Juan River because they exceed 2000 mg/l. TDS high values at these points may be due to the addition of contaminants, which means to discard the use of this water for irrigation of vegetables. Although such classifications rule out the use of certain water sources for agricultural irrigation, this can be flexible in case of considering osmotolerant crops as indicated by Fipps (2003). Similarly, EC-CCA-001/89 indicates this flexibility in the use of water with total dissolved solids levels above 500 mg/l.
Electrical conductivity is another measure used as an indicator, along with others parameters such as total dissolved solids or sodium adsorption from water salinity (Olías, Cerón, & Fernández, 2015; Sarabia-Meléndez et al., 2011), as the high salt content in the water reduces agricultural productivity by affecting sensitive crops such as beans, strawberries, among others; besides deteriorating the quality of the soil (González-Barrios, Calderón-Villegas, Villa-Castorena, Inzunza-Ibarra, & Catalán-Valencia, 2014). According to the results generated in this study, the measurement of the electrical conductivity in the municipal discharge San Pedro 1 was the highest with 7580 μS/cm, compared to the other 52 sampling points. According to the proposal of Olías, Cerón and Fernández (2015) on the classification of the United States Laboratory Salinity (USLS) that define four classes of salinization risk, the samples: Municipal Discharge San Pedro 1, Vaso of the dam San Ildefonso, left arm of San Juan river and the point before the discharges are in the very high category for the risk of salinity. In this category, the measurements that are higher than 3 000 μS/cm are grouped (Olías et al., 2005). Fipps classifies the irrigation water as excellent, good, permissible, doubtful and inadequate according to the measurement obtained of electrical conductivity in μS/cm. In the same way, the points mentioned above are classified as water for inadequate irrigation, since they exceed the 3 000 μS/cm, reason why the water of these points is not suitable for irrigation by its high levels of salinity. While the points corresponding to the discharge of the treatment plant San Pedro 2, downstream the discharge San Pedro 1, discharge Ponderosa and the San Juan river according to the classification of Fipps, these points are classified as doubtful water as they have of 2 000 to 3 000 μS/cm and in the modified USLS classification, these points have a high salinity risk when having from 1 500 to 3 000 μS/cm.
As mentioned in the results, the minimum and maximum temperature in water bodies were 15 °C and 30 °C respectively; the variability of the temperatures obtained in the sites could be due to the time when the sample was taken, since it is known that the water temperature is correlated with the time of day and month (Zheng, 2017). However, these authors report that this is not relevant in the survival capacity and the proliferation rates of fecal coliform microorganisms (Lessard & Sieburth, 1983; Rozen & Belkin, 2001; Cabral, 2010), for example, in the study of Davies, C. & Evison L. (1991) no differences were found in the survival rate of Salmonella Montevideo at 5 °C, 15 °C and 25 °C.
The data obtained regarding the fecal coliform load were compared with the limits stipulated by the Federal Law of Rights and Disposition Applicable on Matter of National Waters 2015 and NOM-001-Semarnat-1996, although the established limits are indicated with the Most Probable Number (MPN) unit, several studies indicate the equivalence between MPN and CFUs used in this study (California Regional Water Quality Control Board-San Francisco Bay Region, n.d.; Kougioulis, 2014; Office of Water Quality, 2006). According to the results, 41 of the 53 points from which we obtained a water sample showed a high degree of biological contamination concerning the fecal coliform load, which was higher than the reference standards used in this study.
Municipal wastewater is the main cause that affect the quality of water bodies and soils, because most of the time they are discharged without being treated, or the proper treatment is not done (Cervantes-Zepeda, Cruz-Colín, Aguilar-Corona, Castilla-Hernández, & Meraz-Rodríguez, 2011), as is the case of the samples obtained from the different dischargers of the DR 023 as they are treated water samples that do not meet the requirements established by NOM-001-Semarnat-1996 (figure 2). The only sample that complied with the standard was the Kimberly discharge, which did not present fecal coliforms. These results show that these waters represent a potential health risk, because contaminated water and its poor treatment increases the risk of acquiring diseases such as: diarrhea, cholera, dysentery, hepatitis A, poliomyelitis among many others (“OMS | Water,” n.d.). That is why it becomes essential that the wastewater receives the appropriate treatment that guarantees the minimum quality requirements, to prevent pollution of rivers and dams. Contrary to what Cisneros-Estrada and Castanedo-Guerra (2014) mention, the treatment plants San Pedro I and San Pedro II, do not comply with the maximum permissible limits allowed by NOM-001-Semarnat-1996, about the number of CFU of fecal coliforms, so the use of these waters for agricultural use is not recommended.
Most of dams exceed the maximum permissible limit, except for the dam Constitution 1917 (figure 4), this is worrisome because it is not known what the source of contamination of these dams is, so it is probable that clandestine discharges are causing such contamination. In the case of the dam San Ildelfonso, the sample corresponding to the Vessel/glass/vase, has very high CFU levels (figure 4), however, the samples that correspond to the intake work, do not present CFU (table 1). This may be due to the fact that fecal coliforms are found on the surface and not in deep areas, because they do not stand a long time in the water and require very specific conditions for their survival (Madigan et al., 2004) and the water that is released into the intake work is from the deep part of the dam San Ildefonso. The samples that correspond to the San Juan River present very high levels of contamination, this agrees with previous reports (De la Llata-Gómez, Rivera Sánchez, Valtierra, Martínez Reséndiz, & Montoya Martínez, 2006) so there is evidence of biological contamination in the San Juan River and in addition, there are reports not only of biological contamination, but also of chemical, reason why the use of this water represents a risk for the inhabitants of the zone (de la Llata-Gómez et al., 2006).
It is likely that in the entire network of distribution of the DR 023, there is contamination caused by clandestine discharges from nearby houses in the area or nearby establishments such as greenhouses or factories, as there is a variation in contamination levels by CFU of fecal coliforms, as can be seen in the samples corresponding to dikes, sub-laterals, laterals and main channels. For example, the lateral 8+100 had high levels of coliforms and in the sample belonging to the final part of the same, there was no coliform presence, so it is suggested there is only one source of contamination near the beginning of the lateral, however, when sampling was done, this source was not detected. Drain samples were taken for comparison of the levels of water contamination, which should in theory be treated and of untreated water as the case of drains (table 1), however in the Damper Tank Caracol drain, the presence of CFU of fecal coliforms was not found, this may be due to the place where the sample was taken.
Conclusion
The physicochemical and bacteriological data of the DR 023 water provides information on the water quality. It is recommended A constant monitoring of the parameters presented, including the coliform load is recommended to guarantee the use of certain water sources to irrigate crops in the region, as well as a more strict supervision of the operations of wastewater treatment plants, due to the high fecal coliform load present in the water of these DR 023 plants. Poor water quality is due to the presence of pollution sources by clandestine discharges as: surrounding houses, greenhouses and factories. As well as the inadequate treatment of water coming from the treatment plants of the area that alter the quality of the water for irrigation. This fact warns us about the risk to the health of the population who uses these waters. Also, recommendations can be given to avoid planting crops such as vegetables that can be infected by this type of water and are potentially harmful to the population.
Acknowledgments
We thank the personnel of the Irrigation District 023, San Juan del Río for their unconditional support during the sampling collection: Eng. Manuel Carrillo Mendoza, Eng. Yonathan Manjarrez and Mr. Marcelino Morales. We also thank Dr. José Antonio Cervantes Chávez for the space during the realization of this project and for allowing us to make use of the equipment for the bacterial analyzes. Finally, thanks to the reviewers for their observations which undoubtedly improved the quality of this work.
REFERENCES
3M Microbiology (2003). 3M TM Petrifilm TM placas para recuento de aerobios. 3M TM Petrifilm TM. Guía de Interpretación. St. Paul, USA: 3M Microbiology. [ Links ]
Ahumada-Santos, Y. P., Báez-Flores, M. E., Díaz-Camacho, S. P., Uribe-Beltrán, M. de J., López-Angulo, G. et al. (2014). Spatiotemporal distribution of the bacterial contamination of agricultural and domestic wastewater discharged to a drainage ditch (Sinaloa, Mexico). Ciencias Marinas, 40(4), 277-289. [ Links ]
Ayers, R. S., & Westcost, D. W. (1994). Water quality evaluation. Water Quality for Agriculture. Roma: Food and Agriculture Organization of the United Nations. [ Links ]
Bonilla, M. N., Ayala-Osorio, A. I., González-Contreras, S., Santamaría-Juárez, J. D., & Silva-Gómez, S. E. (2016). Calidad fisicoquímica del agua del distrito de riego 030 “Valsequillo” para riego agrícola. Revista Iberoamericana de Producción Académica y Gestión Educativa, 2(3), 1-29. [ Links ]
Cabral, J. (2010). Water microbiology. Bacterial pathogens and water. Int. J. Environ. Res. Public. Health, 7(10), 3657-3703. [ Links ]
California Regional Water Quality Control Board-San Francisco Bay Region. (n. d.). Pathogens in the Napa River watershed total maximum daily load (TMDL). No. 510/622-2382. San Francisco, USA: California Environmental Protection Agency. [ Links ]
Cervantes-Zepeda, A. I., Cruz-Colín, M. R., Aguilar-Corona, R., Castilla-Hernández, P., & Meraz-Rodríguez, M. (2011). Caracterización fisicoquímica y microbiológica del agua tratada en un reactor UASB escala piloto. Revista Mexicana de Ingeniería Química, 10(1), 67-77. [ Links ]
Cifuentes, E., Blumenthal, U., Ruíz-Palacios, G., Bennett, S., & Peasey, A. (1994). Escenario Epidemiológico del uso agrícola del agua residual: el valle del Mezquital, México. Salud Pública Méx., 36(1), 3-9. [ Links ]
Cisneros-Estrada, O. X., & Castanedo-Guerra, L. V. (2014). Propuesta para integrar aguas residuales tratadas al riego agrícola en el Distrito de Riego 023. XXVIII Congreso Nacional de Hidráulica, 1(1). 127-131 [ Links ]
Comisión Nacional del Agua, Conagua (2013). Estadísticas del agua en México. Vol. 1. México, DF: Coordinación General de Comunicación y Cultura del Agua de la Comisión Nacional del Agua. [ Links ]
Comisión Nacional del Agua, Conagua (2014a). Estadísticas del agua en México. Vol. 1. México, DF: Coordinación General de Comunicación y Cultura del Agua de la Comisión Nacional del Agua . [ Links ]
Comisión Nacional del Agua, Conagua (2014b). Atlas del agua en México (2014th ed.), vol. 1. México D.F.: Coordinación General de Comunicación y Cultura del Agua de la Comisión Nacional del Agua. [ Links ]
Davies, C., & Evison, L. (1991). Sunlight and the survival of enteric bacteria in natural waters. Journal of Applied Microbiology, 3(70), 265-274. [ Links ]
De la Llata-Gómez, R., Rivera-Sánchez, E., Valtierra, G. J., Martínez-Reséndiz, W. E., & Montoya-Martínez, A. (2006). Caracterización de los ecosistemas, cambios en el uso de suelo y unidades paisajísticas en la reserva de la biosfera “Sierra Gorda” de Querétaro. Querétaro: Concyteq. [ Links ]
Fipps, G. (2003). Irrigation water quality standards and salinity management strategies. College Station, TX, Publication Number B-1667. Texas A&M Agrilife Extension. Texas, USA: Texas A&M Uni. Publication. Collegue Satation. [ Links ]
González-Barrios, J. L., Calderón-Villegas, U., Villa-Castorena, M., Inzunza-Ibarra, M. A., & Catalán-Valencia, E. A. (2014). Impacto de la salinidad del agua de riego en la calidad del fruto de chile jalapeño. Agrofaz, 14(2), 61-66. [ Links ]
Hernández-Acosta, E., Quiñones-Aguilar, E. E., Cristóbal-Acevedo, D., & Rubiños-Panta, J. E. (2014). Biological quality of wastewater used in irrigation of forage crops in Tulancingo, Hidalgo, Mexico. Revista Chapingo. Serie Ciencias Forestales y del Ambiente, 20(1), 89-100. [ Links ]
Huibers, F. P., & Van Lier, J. B. (2005). Use of wastewater in agriculture: The water chain approach. Irrigation and Drainage, 54(S1), S3-S9. [ Links ]
Kougioulis, J. (2014). Triennial Review-Most probable number (MPN)/colony forming units (CFU) enumeration methods and proposed standards reporting revision. New Mexico, USA: New Mexico Environment Department Resource Protection Division. [ Links ]
Madigan, M. T., Martinko, J. M., Parker, J., Brock, T. D., Fernández, C. R. et al. (2004). Brock biología de los microorganismos. Madrid: Pearson Educación. [ Links ]
Lessard, E. J., & Sieburth, J. (1983). Survival of natural sewage populations of enteric bacteria in diffusion and batch chambers in the marine environment. Applied and Environmental Microbiology, 45(3), 950-959. [ Links ]
Mazari-Hiriart, M., Ponce-de-León, S., López-Vidal, Y., Islas-Macías, P., Amieva-Fernández, R. I. et al. (2008). Microbiological implications of periurban agriculture and water reuse in Mexico City. Herman, C. (ed.). PLoS ONE, 3(5), e2305. [ Links ]
Medema, G. J., Shaw, S., Waite, M., Snozzi, M., Morreau, A. et al. (2013). Catchment characteristics and source water quality (pp. 111-158). In: Assessing Microbial Safety of Drinking Water Improving Approaches and Method. London: WHO & OECD, IWA Publishing. [ Links ]
Megchún-García, J. V., Landeros-Sánchez, C., Soto-Estrada, A., Castañeda-Chávez, M. R., Martínez-Dávila, J. P. et al. (2015). Total coliforms and Escherichia coli in surface and subsurface water from a sugarcane agroecosystem in Veracruz, Mexico. Journal of Agricultural Science, 7(6), 110-119. [ Links ]
Office of Water Quality (2006). Total maximum daily load for Escherichia coli (E. coli) for the plummer creek watershed, greene county (pp. 1-12). Indianapolis, USA: Indiana Department of Environmental Management. [ Links ]
Olías, M., Cerón, J. C., & Fernández, I. (2015). Sobre la utilización de la clasificación de las aguas de riego del U.S. Laboratory Salinity (USLS). Geogaceta, 37, 111-113. [ Links ]
Olivas-Enriquez, E., Flores-Margez, J. P., Serrano-Alamillo, M., Soto-Mejía, E., Iglesias-Olivas, J. et al. (2011). Indicadores fecales y patógenos en agua descargada al río bravo. Terra Latinoamericana, 29(4), 449-457. [ Links ]
Organización Mundial de la Salud. (s.f.). WHO. Consultado el 20 de marzo de 2016. Recuperado de Recuperado de http://www.who.int/mediacentre/factsheets/fs391/es/ . [ Links ]
Pescod, M. (1992). Wastewater treatment and use in agriculture. Roma: Food and Agriculture Organization of the United Nations . [ Links ]
Rozen, Y., & Belkin, S. (2001). Survival of enteric bacteria in seawater. FEMS Microbiology Reviews, 25(1), 513-529. [ Links ]
Saldaña-Fabela, M. del P., Díaz-Pardo, E., & Gutiérrez-Hernández, A. (2011). Diagnóstico de la calidad del agua en un sistema de embalses en cascada, cuenca del río San Juan, Querétaro, México. Tecnología y ciencias del agua, 2(3), 115-126. [ Links ]
Sarabia-Meléndez, I. F., Cisneros-Almazán, R., Aceves-de-Alba, J., Durán-García, H. M., & Castro-Larragoitia, J. (2011). Calidad del agua de riego en suelos agrícolas y cultivos del valle de San Luis Potosí, México. Rev. Int. Contam. Ambie., 27(2), 103-113. [ Links ]
Vázquez-Sánchez, G., & Pineda-López, R. (2010). Propuesta de creación de un área de protección de recursos naturales en la cuenca alimentadora del Distrito de Riego 023 San Juan del Río, Querétaro. Ciencia@UAQ, 3(1), 61-70. [ Links ]
Zheng, H. (2017). Chapter 5: Active solar distiller (pp. 323-446). In: Solar Energy Desalination Technology. Zheng, H. (ed.). Beijing, China: Elsevier. [ Links ]
Received: July 22, 2016; Accepted: August 01, 2017
 Este es un artículo publicado en acceso abierto bajo una licencia
Creative Commons
Este es un artículo publicado en acceso abierto bajo una licencia
Creative Commons
