


 text in
  English (pdf)
 Article in xml format
 Article references
 Send this article by e-mail
 Cited by SciELO
  Similars in
SciELO
Similars in
SciELO 
 Permalink
Introduction
Estimation of the water use efficiency at the farm level has been a challenge, because it is not easy to measure crop evapotranspiration. The gravimetric method, which involves taking soil samples to determine moisture content by weighing the wet and then the dry soil, and to estimate the specific gravity for each sample at various places on a plot, are very difficult and expensive. Due to the spatial variability of soil, it requires taking several samples from each plot of each crop which would involve many people to do this task.
The use of lysimeters is another method that requires the construction of these devices which is usually done in research institutions, but its use is not possible in every crop or plot of interest. Turbulent flow measure devices (Eddy Correlation) are also used, but the cost is high and is generally used to calibrate other more simplistic methods.
There are several empirical or semi-empirical methods that have been used to estimate water use of crops for many years, among them, the method of Thornthwaite, Blaney and Criddle, Penman-Monteith, which generally attempt to estimate the potential or reference evapotranspiration, which measures the evapotranspiration demand by climatic factors. On the other hand, the crop evapotranspiration is generally very variable since it depends on the crop vegetative development, on the spatial variability of soil, on water stress in the plant and many other factors whose variability is difficult to assess. Currently available automatic weather stations can be used to estimate the reference evapotranspiration by the Penman-Monteith equation, with software that is installed in the automatic weather station (Palacios, 2002).
As mentioned before, the crop evapotranspiration is highly variable and it is usually estimated, affecting the reference evapotranspiration by a dimensionless factor called crop coefficient (Kc) (Allen, Pereira, Raes, & Smith, 1998). The crop coefficient changes according to the crop development. Interestingly, this factor can be estimated based on a vegetation index called NDVI, which can be obtained using satellite images. In this regard, it should be noted that compared with METRIC, a model developed by the University of Idaho, the method described in this article is easier to develop and gives similar results in the estimation of the water use efficiency when used properly (Palacios & Flores, 2013).
Materials and methods
The overall water use efficiency in irrigated agriculture is defined as the ratio of the volume of water used by the crops, also referred as consumptive use, and the amount of water taken from the sources of supply, in addition to the effective rainfall for irrigation. It is represented by the following function:
Where :
Ewu |
Water use Efficiency, dimensionless |
Vu |
Volume used by the crops, m3 |
Ve |
Volume extracted from different sources, m3 |
Vpe |
Volume of effective rainfall, m3 |
It should be noted that in several cases it is also considered the amount of water required by the crop for washing salts, but in this case it has not been taken into consideration.
The assessment of the overall efficiency of the water is important because it allows us to estimate the water that is wasted, which is vital in the case of Mexico, there are already major water shortages in most of the agricultural areas of the country where it has been noted with concern that the irrigated area in the past 30 years has not changed despite huge investments that have been made.
In the irrigation districts of Mexico, the water is obtained from different sources, in general it can be measured and it is usually measured or estimated with acceptable accuracy. The volume of effective rainfall is difficult to estimate, but there are several empirical methods that can do a reasonable approximation. Estimation of the water used by every planted crop and every plot is the most difficult task to achieve.
There are several methods to estimate water consumption by plants (ETc), but one of the most commonly used methods is the product of the so-called reference evapotranspiration (ETr) multiplied by a crop coefficient, dimensionless Kc, so the function for the calculation is:
Potential evapotranspiration and more recently called reference ETr, is a crop that has no restriction of water generally of small size as grass or alfalfa, which completely covers the ground as defined by Rosenberg (1974). Nowadays, this variable can be calculated with the Penman- Monteith method, which can already be obtained from an automatic weather station in which the software for this calculation has been incorporated.
The value of Kc coefficient is more difficult to be obtained because it involves the measurement of actual evapotranspiration of a crop, which requires special equipment, such as a weighing lysimeter with unchanged soil structure or using a turbulent flow measurement station (Eddy Correlation). However, the water consumption of each crop can be highly variable, since it depends not only on the crop but also on other variables such as fertilization, and water stress, among others, therefore calculation can be made using different methods, as proposed by the FAO (Allen et al., 1998), it considers crops grown under standard conditions, which take place in vast fields under agronomic excellent condition without limitations of soil moisture.
In the year 2000, the project “DEmonstration of Earth observation Technologies in Routine irrigation advisory services” (DEMETER) financed by the European Commission, supported to the Mediterranean Nations of Europe to improve water use efficiency. During five years, several researches were performed, among them, one research was to look for a linear relationship between the vegetation index NDVI and the Kc.
The NDVI is calculated from the reflectance of the red and infrared bands of satellite images according to the following function:
Thus, D'Urso and Calera (2006), in the Proceedings of the AIP Conference discussed, in some detail, this linear relationship between NDVI and Kc and derived general function relating these two variables as shown below:
Subsequently, Calera and Gonzalez (2007), in a document from the project “Participatory multi-Level EO-assisted water Tools for Irrigation Management and Agricultural Decision-Support” (PLEIADES), also funded by the European Commission, presented a similar function as:
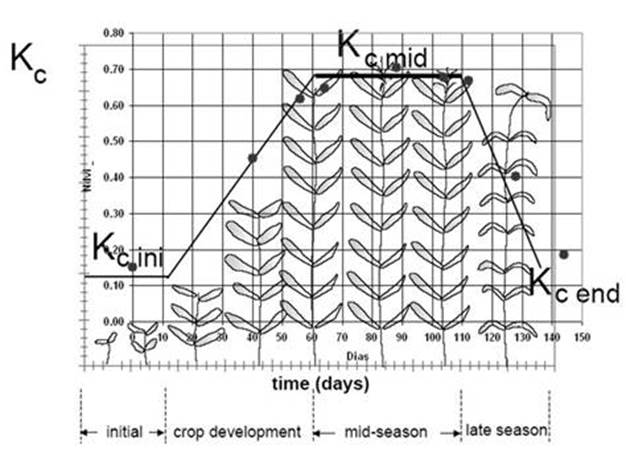
This linear relationship between NDVI and Kc, can be clearly seen by plotting the figure mentioned in the FAO publication (Allen, Pereira, Smith, Raes, & Wright, 2005) and adding the position of the NDVI values obtained from satellite images as shown in figure 1.
As part of the PLEIADES (2007-2010) project, measurements were carried out in the Irrigation District of the Rio Yaqui, Sonora State, as an investigation of three Mexican Institutions (Colpos, Itson and Uson), with additional support from IRD from France with an experiment to measure evapotranspiration in four blocks of the district, including the use of four Scintilometers.
In such experiment, the crop evapotranspiration of wheat was also measured with Eddy Correlation equipment and NDVI indices were calculated, using 10 images from the Landsat 5 satellite. It was obtained similar results as that from Calera and Gonzalez (2007). The relationship is described in an article by Palacios, Palacios and Palacios (2011), whose graph is shown in figure 2.

On the left of the figure, it is shown the variation of Kc during the growing season of wheat and dark points are the NDVI values obtained from 10 images of Landsat 5 and 7 satellites.
The function obtained by Calera and Gonzalez was used to estimate water consumption for all crops, using ETr information from an automatic weather station. In a WEB page from the University Castilla la Mancha in Spain, an online system has been developed for DEMETER and PLEIADeS Projects to show the crop conditions and evapotranspiration estimations using this methodology. Now, an improved display is being used in a new project called Sustainable Irrigation water management and River-basin governance: Implementing User-driven Services (SIRIUS).
The online system (viewer), called SPIDER, uses various types of images and geographic information systems, and allows to its users (all members of the consortium SIRIUS, including Mexico), to observe the state of their plots and calculate their water consumption by crops through an ingenious method of graphical integration, using the function (5).
It is considered that this function is only valid for crops that entirely cover the soil surface when they reach flowering. For other perennial crops such as orchards, which generally do not fully cover the ground, is required to calculate other functions. As an example, it can be mentioned the function found by Rodriguez, for growing table grapes, presented in an article by Palacios, Palacios, Rodriguez and Palacios (2010). This function obtained in the “Costa de Hermosillo Irrigation District” is shown in figure 3.

Considering that the function (5) can be valid to estimate the annual water consumption of crops that cover the entire irrigated area when reach flowering, then it could be used to calculate water consumption on each plot of an irrigation district.
Under this assumption, then it is possible to integrate the total water consumption by crops in an irrigation district.
Results
This methodology has been tested in the Rio Mayo irrigation district in the Sonora state, in northern Mexico, where over 95% of the irrigated area is occupied by annual crops, predominantly wheat and safflower. The total water use efficiency in this irrigation district was calculated.
To evaluate the water use efficiency at plot level, software was developed by one of the authors of this report, which allows to calculate the average value of NDVI (per pixel) within the perimeter of each plot, using a geographic information system (GIS) of the irrigation district. Subsequently, a database with the average NDVI values per plot for each date of the satellite image was generated. Then, using the calculated ETr of a grass crop by the Penman-Monteith formula and climatic data registered in a weather station situated in the central part of the district, the evaluation of the water consumption in each plot was obtained.
Finally a database with average values of NDVI and ETc per plot was obtained, which allowed evaluating water consumption for irrigation in each module in which the district has been divided. In this area, however, the rain as a source of water during crop development is not significant, therefore the total water use efficiency of the irrigation is achieved by the two sources of irrigation supply for this District, the “Adolfo Ruiz Cortines” dam and 130 deep wells to supplement Irrigation needs.
All this information could be available to the water user associations in the district. To show to any water user who requests information about the status of their plots, it is possible to display satellite pictures with this information on a computer, using the "ArcView ®" or other GIS software such as the open source QGIS. The information is also available on the viewfinder SPIDER Internet, which is located on the web site of the Castilla La Mancha University, www.zeus.idr-ab.uclm.es/public. Additionally there is other viewer developed by the doctoral student José Luis Espinosa also available in Internet in: http://hidro.colpos.mx:8080/sig-mon/.
In addition, Excel sheets were generated to show the evaluation of the irrigation efficiencies at module level at the irrigation district Río Mayo in the cycle 2015-2016 using Landsat 7 and Landsat 8, shown in the Appendix section of this article.
Conclusions
It is possible to estimate crop evapotranspiration, at plot level, in Irrigation modules and in Irrigation Districts, using satellite images to calculate the NDVI indices and then the crop coefficients Kc. It is also necessary to have climatic data to estimate daily reference evapotranspiration through all the agricultural cycle. In the state of Sonora there is a network of automatic weather stations that can be used to get this climatic data, “Red de Estaciones Meteorológicas Automáticas de Sonora” (REMAS) www.siafeson.com/remas/.
To make a growing crop follow-up, such as the one described in the article, it is necessary to obtain satellite images, such as the new Landsat 8. The images of the new Landsat 8 are obtained every 16 days; the images of satellite Sentinel 2A, every 10 days with spatial resolution of 10 meters. Both Landsat 8 and Sentinel 2A have no cost. SPOT satellite images obtained from “Ermex”. They are free if provided by means of a government office, or an educational or research institution. The DEIMOS satellite can be another option, it has a spatial resolution of 22 meters, but these images have an approximated cost of 0.15 € per km2.

