


 text new page (beta)
 English (pdf)
 Article in xml format
 Article references
 Send this article by e-mail
 Cited by SciELO
  Similars in
SciELO
Similars in
SciELO 
 Permalink
Introduction
The extensive expansion of agriculture, rapid urbanization, and large-scale industrialization in China over the past three decades were accompanied with inevitable side effects, including water pollution, which is getting more severe each year. Moreover, anthropogenic activities associated with the revival and development of the Silk Road can further aggravate the water pollution crisis (Li, Qian, & Wu, 2014; Li, Qian, Howard, & Wu, 2015). Noteworthy is that surface water pollution has two main sources: (a) point source pollutants, such as industrial wastes and domestic sewage, and (b) non-point source pollutants, such as pesticides, herbicides, and fertilizers from agricultural activities. In addition, pollutants may originate from recharge of poor-quality groundwater and deposition of atmospheric pollutants. Once entering the aquatic environment, these pollutants may alter the composition and functions of ecosystems, thereby leading to a series of irreversible ecological changes (Huo et al., 2014). While the point source pollution can be monitored by routine procedures and techniques, the non-point source one is difficult to control because it comes from the everyday activities of many different people, such as fertilizing a lawn, using a pesticide, or constructing a road or building. The fact that non-point source pollution is dynamic and complex process, which usually covers extensive areas, makes it quite problematic to provide an accurate quantification of its spatial location, extent, and discharge volume (Chowdary, Rao, & Sarma, 2005).
In order to face this challenge, numerous researchers developed various models of the agricultural non-point source pollution, most of which are based on different land use patterns (Whitehead, Johnes, & Butterfield, 2002; Polyakov, Fares, Kubo, Jacobi, & Smith, 2007; Munafo, Cecchi, Baiocco, & Mancini, 2005). Although these models are clearly mechanistic, they require a large number of input data, and it is difficult to directly monitor some of the processes for which data are required. Pollutant mobilization processes and transport to the river network vary by region and river; studies that report model simulations at a range of spatial and temporal scales are also very scarce, so wide-spread application is constrained by both the variability in the landscape and lack of experience (Azzellino, Salvetti, Vismara, & Bonomo, 2006). We have made progress in non-point source pollution research in China by using software combined with remote sensing (RS) and Geographical Information Systems (GIS) (Feier, Huanchun, Yingxu, & Dong, 2003; Guihong & Jiangyong, 2007; Gao, Zhu, Zhou, Zhi, & Tang, 2008). However, these above methods are prone to large discrepancies when there are unique geographical features, complex landscape types, and diverse land use patterns in loess regions, which may, to a certain degree, bias the large-scale simulation results.
In this study, we used the River and Stream Water Quality Model (QUAL2E) developed by the United States Environmental Protection Agency (USEPA, 1992). We also used multi-variate statistics principal component analysis (PCA) and factor analysis (FA) (Melching & Yoon, 1996; Wu, Li, Qian, Duan, & Zhang, 2014) to examine the sources of non-point pollution and to highlight the impacts of point and non-point source pollution on river water quality. The object of this study was the Shaanxi Reach of the Jinghe River in Shaanxi province of China. To provide a robust scientific basis for reducing water pollution in this area, the point source and non-point source loads of ammonia nitrogen and nitrate nitrogen between Jingcun and Zhangjiashan in dry and wet seasons are assessed.
Materials and methods
Study area
The Jinghe River originates in the eastern foot-hills of the Liupan Mountain, Jingyuan County, Ningxia Hui Autonomous Region. It enters Shaanxi Province in Tangqu in Changwu County and merges with the Weihe River in Chenjiatan Village, Gaoling County. The Jinghe River is about 272.5 km long and it drains an area of 9 210 km2 in Shaanxi Province (figure 1). In the Zhangjiashan section, the Jinghe Basin is mainly composed of a loess plateau and hilly gullies. The loess plateau region has a flat surface and is the agricultural center of the area, while the hilly-gully one is subjected to significant soil erosion promoted by high runoff rates and the relatively poor vegetation coverage. There are also small areas of stony soil and mountain forest in the Jinghe Basin. The area downstream from Zhangjiashan is dominated by river terraces. The average precipitation is 556 mm, but there is significant inter- and intra-annual variations in precipitation. Precipitation in the four months from July to October accounts for 56% of the annual precipitation. The industry is yet underdeveloped in this agricultural region, which is the main grain and cotton producer of Shaanxi province. However, in recent years, water quality has been steadily deteriorating in Shaanxi province because of the on-going industrial and agricultural developments.

River water quality model
Three main processes occur when pollutants enter a river, namely, flow migration, random diffusion at pollutant points, and transformation of pollutants (Beck, 1987). It is very difficult to find a solution for a non-steady multidimensional model, and furthermore, the analytical formula is very complex. However, recent studies have shown that one-dimensional steady models can solve the actual problems in many rivers. We used QUAL2E, the updated and improved version of the QUAL-I and II developed by the USEPA in the 1970s, for the simulation. It is based on the stream dispersion mass transfer equation that describes spatial and temporal changes in any water quality variable. In this equation, the source and sink caused by chemical, physical, and biological effects (including the impacts of the branch and discharge outlet) are included along with terms to describe flow migration and dispersion (Reckhow, 1999), as follows:
 (1)
(1)
where c is the average concentration of pollutants in the section of river (mg/l); Q is the average flow of the section (m3/s); Dx is the longitudinal dispersion coefficient (m2/s); A is cross-sectional area (m2); Sα is the source-sink term; x is the distance between the monitoring point and the pollution source (m), and t is the time at the monitoring point (s).
If the flow (flux) is steady, then  = and
= and  . Equation (1) then becomes:
 (2)
(2)
where Sint is the internal source and sink of the water quality variable (i.e., chemical reaction, etc.) (kg/(s.m)), and Sext is the external source and sink (i.e., branch impact, etc.) (kg/(s.m)).
To apply a steady model, the sections of the river must be even, the hydrological conditions should be stable, the current velocity and the dispersion coefficient should not change with time, and the source-sink term should be constant, namely  . Equation (2) can be simplified into:
 (3)
(3)
where u is the average current velocity through the river section (m/s); k is the degradation coefficient of the pollutant (1/d), and S is the external source from the branch (mg/l.d).
As commonly occurs in non-tidal rivers, more pollutants are removed by flow migration than by the dispersion effect. Under steady state conditions, the dispersion effect can be ignored, and we obtain:
 (4)
(4)
If the initial condition is: x = 0, c(x = 0) = c0, equation (4) is solved within the interval from x = 0 to x = x, and the analytical solution to the one-dimensional water quality model is:
 (5)
(5)
The diffuse source pollution between the Jingcun and Zhangjiashan sections is ascribed to the confluent pollutants introduced by the tributaries in the wet season (including the discharge from point sources in the dry season) and can be obtained by subtracting the confluent pollutants from the tributaries in the dry season from those in the wet season.
When the water quality model is applied, the confluent pollutants from the branches between the two sections are the source-sink term distributed evenly between the two sections. The space between the two sections is subdivided into several uniformly-spaced small cells to improve the accuracy, as is shown in figure 2.

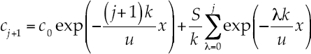
Where S1, S2,… Si,… Sm are sections in the basin; c0 is the concentration of section Si; cn is the concentration of section Si+l; the basin is divided into n parts uniformly spaced between Si and Si+l; c1, c2,… cj,…, cn are the concentrations of all the sections. The precision is higher for higher values of n. The concentration of the jth section is taken as the initial concentration of the j + 1st section. When calculated with equation (5), then:
 (6)
(6)
 (7)
(7)
 (8)
(8)
 (9)
(9)
Similarly,
 (10)
(10)
Then
 (11)
(11)
where the water quality and hydrological values of the conventional sections can be acquired by monitoring, and only the degradation coefficient (k) is unknown. Usually, the degradation coefficient is temperature- dependent, and is calculated using equation (12):
 (12)
(12)
where k(20 °C) is the degradation coefficient of the water quality parameter at a temperature of 20 °C (1/d), and T is the water temperature (°C).
The degradation coefficient of different water quality parameters is determined by different methods. For the water quality parameter BOD5, the methods include the laboratory method, slope method, two-point method, multi-point method, and others. Nitrogen is involved a very complex circulation process in the water environment, comprising nitrifying and denitrifying processes. Since, in general the inorganic nitrogen concentrations in rivers are quite low, the basic reactions are reduced to nitrification and denitrification. In this study, we used the two-point method to calculate the degradation coefficient between Si and Si+1 at 20 °C using the following equation:
 (13)
(13)
where k is the degradation coefficient (1/d); u is the average current velocity between sections (m/s); l is the distance between sections (m); cup is the upstream concentration of the water quality parameter (mg/l), and cdown is the concentration of the water quality parameter downstream (mg/l).
Equation (11) is applied to calculate the source-sink term of the water quality parameter in wet and dry seasons of a hydrological year, respectively; the difference between the source-sink term in wet season and that in dry season is the diffuse source pollution for the water quality parameters between Si and Si+1 in the current hydrological year. The diffuse source pollution from all the adjacent sections in the basin during the hydrological year is calculated, and the total sum being the diffuse pollution load of the basin for the hydrological year.
There are two monitoring sections on the Jinghe River in Shaanxi province, namely the Jingcun and Zhangjiashan sections, with no point source discharges in-between, except for such tributaries as the Taiyu River and Sanshui River. The area between these two sections is the study area, and two water quality parameters, ammonia nitrogen (NH4+-N) and nitrate nitrogen (NO3−-N), were chosen as nitrogen nutrient indices to calculate the diffuse source pollution load in this study by combining the results of PCA for the water quality variables.
The water quality data from the Water Environment Monitoring Center of Shaanxi Provincial Hydrologic Bureau indicated that the average water temperature of the two monitoring stations in June each year was approximately 20 °C (lower than 20 °C for Jingcun and higher than 20 °C for Zhangjiashan, with the temperature difference between them not exceeding 1 °C). Concentrations of nitrite nitrogen were very low in both sections, therefore nitrifying reactions of nitrite nitrogen were disregarded, but only the denitrifying effect of NO3−-N was taken into account. Equation (13) was used to calculate the degradation coefficients of NH4+-N and NO3−-N, based on the values for the year when the precipitation in June was low and on the average values for many years at 20 °C. To account for the impact of temperature on water quality parameters, the degradation coefficients for each month of each year were calculated using equation (12).
Principal component analysis (PCA) and factor analysis (FA)
River pollution is a complex process comprised of several water quality parameters that may interact with each other. This implies that it may not be possible to obtain accurate results because of colinearity between the parameters. PCA groups the original parameters into a few mutually-independent comprehensive indices by a linear transformation to simplify the data and improve the reliability of the analysis results (Wu et al., 2014; Xiaohua, Ruiming, & Yong, 2008). PCA has been applied in recent years to assess surface water quality in combination with other multivariate statistical analysis, such as cluster analysis (CA), factor analysis (FA), and discriminant analysis (DA) (Li, Wu, & Qian, 2013a; Li, Qian, Wu, Zhang, & Zhang, 2013b; Ouyang, 2005; Ouyang, Nkedi-Kizza, Wu, Shinde, & Huang, 2006; Shrestha & Kazama, 2007); it has also been used in non-point source load forecasting along with multiple regression analysis (Geladi & Kowalski, 1986). In particular, FA has been integrated with a water quality model to study the distribution of point and non-point sources of nutrients in surface water (Azzellino et al., 2006). To highlight spatial and temporal changes in water quality in different periods of a year, the SPSS software (version 16.0) was used for PCA and FA of water quality parameters in dry and wet seasons. The analysis involved the following five main steps, as follows (Li et al., 2013a; Li et al., 2013b; Wu et al., 2014):
An original data matrix was set up (Mij(I = 1, 2,…, n; j = 1, 2,…, p)) with n samples and p indices, which were standardized to ensure that they all had equal weights in the analysis.
The covariance matrix Rjk was calculated.
The eigenvalues (λk (k = 1, 2,…, p)) and corresponding eigenvectors (Lk(k = 1, 2,…, p)) were derived.
The variance contribution rate
 and the cumulative variance contribution rate
  were calculated, and the principal components that corresponded to the eigenvalues λ1, λ2,..., λm(m < p) were selected for Dk ≥ 85%.
The factor loading matrix was developed and a varimax rotation was performed on the factor loading matrix to infer the principal parameters. In this study, only those factors that had an eigenvalue greater than one were retained.
Data sources
In this study, 16 sets of monitoring data from the Jingcun and Zhangjiashan sections in the Shaanxi Reach of the Jinghe River were selected for the analysis. We used data from Nov 2001 to Oct 2007; the period from Nov to Feb of the following year represented dry seasons while the period from July to Oct represented wet seasons. The average values of the current velocity and the flow rate from 2002 and 2007 for the two sections were selected. The river reaches from the Jingcun section to Zhangjiashan section is 120 km long.
Results and analysis
PCA was conducted for the 16 sets of water quality data for dry seasons in the Jingcun section and for dry and wet seasons in the Zhangjiashan section from Nov 2004 to Oct 2007. The rotated factor loadings matrixes obtained for the different periods are give elsewhere (Wang et al., 2012). Six factors with eigenvalues greater than 1 extracted from the Jingcun section contributed to 87.737% (> 85%) of the variance in dry seasons, and three and four factors extracted from the Zhangjiashan section corresponded to 87.253 and 92.865% (> 85%) of the variance in dry and wet seasons, respectively. The most meaningful parameters within each component can be identified by investigating the factor loadings matrix. It can be reasonably assumed that parameters of the same component share the same origin.
The main pollutants in the Jingcun section during dry season were salt indices (VF1, including chloride, conductivity, NOx, and salinity) and organic pollution indices (VF2, including volatile phenol and ammonia nirogen), whereas those of the Zhangjiashan section in dry seasons were organism indices (VF1, including sulfate, CODMn, NH4+-N, NOx, and BOD5) and salt indices (VF2, including salinity, electrical conductivity, and chloride). In dry seasons, the river water was recharged by the groundwater, and NOx and chloride in the Jingcun section were closely associated on VF1, which suggests an exchange of water from the groundwater to surface water system. In the Zhangjiashan section, NOx was loaded on VF1 and was thus associated with point source discharges of domestic sewage, and similar other discharges. In dry seasons, ammonia nitrogen and volatile phenol in the Jingcun section were loaded on VF2, the source of which was waste water discharged from papermaking enterprises in the upper reaches of the Jinghe River; in the Zhangjiashan section, ammonia nitrogen and NOx, which came from point source discharges of domestic sewage and similar, were on VF1. In wet seasons, the main pollutants in the Zhangjiashan section were non-point source pollution indices (VF1, including nitrogen nutrient indices (NOx and total nitrogen) and sulfate) and organic pollution indices (VF2, including volatile phenol, ammonia nitrogen, and salinity).
The above analysis shows that, regardless of dry or wet seasons, the water environment between the Jingcun and Zhangjiashan sections was mainly polluted by nitrogen nutrient and organic pollution indices.
The source-sink terms of NH4+-N and NO3−-N in wet and dry seasons from 2002 to 2007, respectively, were calculated using equation (11) and tabulated in table 1.
Table 1 NPS loads of NO3−-N and NH4+-N from 2002 to 2007.

Note: There is no monitoring value of NO3−-N in 2004.
There was a slight variation in the source-sink terms of NO3−-N in dry seasons of the years (Table 1), showing that the point source discharges of domestic sewage and similar were stable; the terms varied considerably in wet seasons, and the values in 2003 and 2007 were much higher than in those the other years. The precipitation and runoff values were large in the wet seasons of 2003 and 2007, so the non-point source pollution loads were also quite large. Examination of the annual precipitation and corresponding non-point source load of NO3−-N (figure 3) shows that, when the precipitation was between 400 and 500 mm, the non-point source load did not change significantly, but as the precipitation increased, the load also increased rapidly, because the increased amount of runoff carried more pollutants. However, with further increases in precipitation, the non-point source load gradually dropped down, which may be attributed to the smaller amount of fertilizers in the soil. Even though 2006 was a normal year, the non-point source load of NO3−-N was less than in the other normal years, due to lower monthly precipitation from July to October in 2006, as compared to those of other normal years. In 2006, the maximum monthly precipitation occurred in June.

There is a wide variation of the source-sink terms of NH4+-N in dry and wet seasons, indicating the instability of point and non-point source discharges, due to different sources of NH4+-N in dry and wet seasons. PCA analysis shows that NH4+-N, CODMn, and BOD5 were loaded on factor VF1 in dry seasons, which indicates that they were from domestic sewage and organic waste water discharged by juice factories. NH4+-N, volatile phenol and salinity were loaded on factor VF2 in wet seasons, showing that the main sources were industrial waste water discharged by papermaking enterprises in the upper reaches of the Jinghe River and NH4+-N adsorbed to eroded non-point source soil particles that were transported in runoff. Because the waste water discharges were different in these years, the source-sink terms of NH4+-N were different in dry and wet seasons. The non-point source load of NH4+-N was 71.3328 tons in 2003, which was higher than those observed in other years. Since 2003 was an unusually wet year, runoff transported large amounts of NH4+-N associated with eroded soil particles to the river channel, whereas in other years, NH4+-N in the river mainly came from point source discharges such as domestic sew-age and organic waste water.
The above method yielded quite expected results for such non-point source pollutants, as NO3−-N, and somewhat contradictory ones on such point source pollutants, as NH4+- N.
Conclusion
In this study, we proposed the combined application of QUAL2E, a river water quality model, and PCA and FA to study the source apportionment of point and non-point pollutant loads to surface water. PCA and FA were used to evaluate pollutant sources in different river sections in dry and wet seasons, and then the amount of point source and non-point source pollution was calculated by using QUAL2E.
The results of PCA and FA show that the water pollution in the lower reaches of the Jinghe River mainly involved nitrogen and organisms. NH4+-N and NO3−-N, as the nitrogen nutrient indices, were taken as the objects, and the QUAL2E model equation was adopted to calculate their source-sink terms in dry and wet seasons, respectively; the difference between the terms in wet and dry seasons were the non-point source loads. The calculation results for NO3−-N were reasonable, while those of NH4+-N were somewhat unexpected, but consistent with the results of PCA and FA. NO3−-N comes from point source discharges of domestic sewage and similar in dry seasons and from non-point source pollution generated by precipitation in wet seasons, whereas NH4+-N was mainly discharged from point sources throughout the year. The instability of the point source discharges caused the above deviation of the calculation results. It is shown that application of the QUAL2E river water quality model provides reliable results for non-point source pollution caused by storm runoff, but unreliable results for point source pollution. Therefore, further model refinement or application of newer version QUAL2K (https://www.epa.gov, http://www.qual2k.com/) may be expedient. In contrast to QUAL2E, which segments the system into river reaches comprised of equally spaced elements. QUAL2K uses unequally-spaced reaches. In addition, multiple loadings and abstractions can be input to any reach, which may be quite instrumental for more accurate account of the local specific features.

