


Services on Demand
Journal
Article
 text in
  English (pdf)
 Article in xml format
 Article references
 Send this article by e-mail
Indicators
-
 Cited by SciELO
 -
 Access statistics
Related links
-
 Similars in
SciELO
Similars in
SciELO
Share

 Permalink
Revista mexicana de ciencias forestales
Print version ISSN 2007-1132
Rev. mex. de cienc. forestales vol.14 n.79 México Sep./Oct. 2023 Epub Oct 06, 2023
https://doi.org/10.29298/rmcf.v14i79.1350
Scientific article
Comparison of climatic databases in modeling the potential distribution of Pinus cembroides Zucc
1
 http://orcid.org/0000-0003-3559-1958
1
http://orcid.org/0000-0003-4969-611X
1
http://orcid.org/0000-0002-9216-7427
1Universidad Autónoma de Nuevo León, Facultad de Ciencias Forestales. México.
2Centro de Investigación Científica y de Educación Superior de Ensenada. México.
The potential distribution of Pinus cembroides populations depends on the spatial and temporal variability of the temperature and precipitation. Given the increase in the availability of different climatic databases in the last decades, the objective of the present study was to evaluate the effect of their spatial and temporal variability on the modeling of the potential distribution of P. cembroides. The Maximum Entropy (MaxEnt) algorithm was used to obtain the potential distribution of P. cembroides from the records of the National Forest and Soil Inventory and the National Biodiversity Information System with data from four sources of climatic information. Despite differences in spatial resolution, four reliable models were obtained with AUC values close to 0.8. The distribution of P. cembroides is limited by the mean temperature of the wettest (Bio 8) and driest (Bio 9) quarters. The WorldClim v2.1 and SCM models presented a higher correlation between the distribution of P. cembroides and the selected bioclimatic variables. In all four models, the species recorded a higher probability of occurrence (>70 %) in the Eastern and Western Sierras Madre. It is concluded that databases with a spatial resolution of at least 15 km2 are necessary for distribution studies of P. cembroides. The type of research should be considered a first step in the planning and development of management and conservation strategies for the species.
Key words: Climate data; species distribution; maximum entropy; distribution models; Pinus cembroides Zucc.; bioclimatic variables
La distribución potencial de las poblaciones de Pinus cembroides depende de la variabilidad espacial y temporal de la temperatura y la precipitación. Dado el incremento en la disponibilidad de diferentes bases de datos climáticos en las últimas décadas, el objetivo del presente estudio fue evaluar el efecto de su variabilidad espacial y temporal en la modelación de la distribución potencial de P. cembroides. Se utilizó el algoritmo de Máxima Entropía (MaxEnt) para obtener la distribución potencial de P. cembroides a partir de los registros del Inventario Nacional Forestal y de Suelos y del Sistema Nacional de Información sobre Biodiversidad, con datos de cuatro fuentes de información climática. A pesar de las diferencias en la resolución espacial, se obtuvieron cuatro modelos confiables con valores de AUC cercanos a 0.8. La distribución de P. cembroides está limitada por la temperatura media de los trimestres más húmedo (Bio 8) y más seco (Bio 9). Los modelos de WorldClim v2.1 y SCM presentaron una mayor correlación entre la distribución de P. cembroides y las variables bioclimáticas seleccionadas. En los cuatro modelos, la especie registró una mayor probabilidad de ocurrencia (>70 %) en las sierras Madre Oriental y Occidental. Se concluye que son necesarias bases de datos con una resolución espacial de al menos 15 km2 para los estudios de distribución de P. cembroides. Este tipo de investigaciones deben considerarse un primer paso en la planeación y desarrollo de estrategias de manejo y conservación de la especie.
Palabras clave Datos climáticos; distribución de especies; máxima entropía; modelos de distribución; Pinus cembroides Zucc.; variables bioclimáticas
Introduction
It is a proven fact that the performance of climate-based species distribution models depends on the spatial resolution and reference period of the climate information used (Jiménez-Valverde et al., 2021; Abdulwahab et al., 2022). Although a large number of climate information sources have been developed in recent years, most are global in scale (Livneh et al., 2015; Fick and Hijmans, 2017) and do not reflect, at the local level, variations in climatic conditions (Harris et al., 2014) and which are important for determining the potential distribution of certain species, especially those located in areas with a pronounced relief (Austin and Van Niel, 2011; Lembrechts et al., 2019).
Thus, there is no knowledge regarding which climate databases are the most appropriate when using species distribution models (SDMs) (Nezer et al., 2017; Stewart et al., 2022). Therefore, climate databases are considered to be of major sources of uncertainty in the development and use of SDMs oriented toward the management and conservation of species (Bucklin et al., 2015).
In order to test the effects of spatial resolution and temporal variability of climatic information on the performance of SDMs, distribution areas of Pinus cembroides Zucc. were selected. This taxon is distributed in the Eastern and Western Sierras Madre and in the Transversal Neovolcanic Axis and is adapted to a wide variety of climates, making it the most widely distributed pine tree species in the country (Constante et al., 2009).
P. cembroides is characterized by growing in dry soils and rocky slopes or at the foot of the mountains, it can reach a height of up to 15 m and a diameter of 30 to 70 cm (Herrera-Soto et al., 2018). It has been identified as one of the most drought-tolerant pine species (Gutiérrez-García et al., 2015).
The most abundant populations of P. cembroides are found in the states of Chihuahua, Durango, Coahuila, Nuevo León, Hidalgo and Zacatecas, where they form part of the transitional vegetation between the xerophytic formations of the Mexican Highlands and the internal slopes of the Eastern and Western Sierras Madre (Carlón et al., 2018).
Several studies have shown that the geographic distribution of P. cembroides is influenced by the spatial and temporal variability of the climate (Aceves-Rangel et al., 2018; Antúnez et al., 2018; García-Aranda et al., 2018). However, no analyses have been conducted to evaluate the use of different climate data sources on the performance of SDMs. Therefore, the objective of this study was to evaluate the effect of the spatial and temporal climate variability reflected in climate databases with differences in their spatial resolution and reference periods, using as a case study models of potential distribution of P. cembroides in Mexico.
Materials and Methods
The study region includes all the national distribution areas of P. cembroides (Figure 1), which are characterized by a great diversity of climates, ranging from semi-arid in the north to temperate and subtropical climates in the center and south of the country (Conabio, 1998). The populations are located at altitudes between 1 350 and 3 500 m, with temperatures between 7 and 40 °C, annual average of 18 °C, and an annual average precipitation of 360 mm to 800 mm (Rzedowski, 1978).
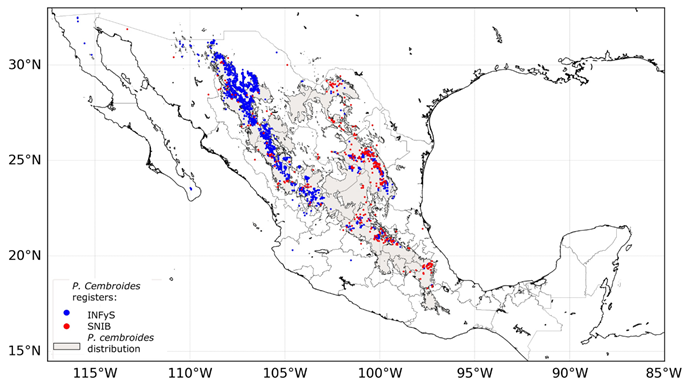
Sources: National Forest and Soil Inventory (INFyS) (Conafor, 2012) and National Biodiversity Information System (SNIB) (Conabio, 2021).
Figure 1 Potential distribution (gray shading) (Téllez-Valdéz et al., 2019) and historical records of Pinus cembroides Zucc. from INFyS (blue dots) and SNIB (red dots) in Mexico.
The coordinates of the presence of P. cembroides were obtained from the National Forest and Soil Inventory (INFyS) of the National Forest Commission (Conafor) (Conafor, 2012) for the 2009-2014 period and from the Geoportal of the National Biodiversity Information System (SNIB) (Conabio, 2021). In order to avoid overestimates and redundancy, duplicate occurrence records were eliminated. For this purpose, a radius was selected around each point of occurrence of P. cembroides, in which the spatial resolution of the climatic predictors (1 km2, 15 km2 and 55.5 km2) was considered. That is, only one individual record of occurrence of P. cembroides was included for each cell of climatic information.
Climate information was obtained from four sources: two at global scale and two at national level, representing the average climate for different historical periods, from 1910 to 2018, and at different spatial resolution (from ~1 km2 to ~55.5 km2) (Table 1).
Table 1 Climate databases.
| Source | Resolution | Period | Reference |
|---|---|---|---|
| WorldClim v2.1 | 0.008° (~1 km2) | 1970-2000 | Fick and Hijmans, 2017 |
| SMN-CLICOM | 0.125° (~15 km2) | 1971-2000 | Zhu and Lettenmier, 2007 |
| ERA5 | 0.500° (~55.5 km2) | 1979-2018 | Vanuyytrecht et al., 2021 |
| SCM | 0.008° (~1 km2) | 1910-2009 | Cuervo-Robayo et al., 2014 |
Climate data from WorldClim v2.1 (Fick and Hijmans, 2017) contain global data obtained from 9 000 to 60 000 stations (depending on coverage) at the global level and interpolated by the thin-spline method considering covariates such as altitude, distance to the coast and cloud cover. The Mexican Climatic Surfaces Database (SCM) (Cuervo-Robayo et al., 2014) was constructed from daily data from 5 000 stations that are part of the surface station network of the National Meteorological Service (SMN), using an interpolation method similar to that proposed by Fick and Hijmans (2017) with longitude, latitude and altitude as independent variables.
SMN-CLICOM climate information was calculated using daily precipitation, maximum temperature and minimum temperature data from approximately 5 000 National Meteorological Service (SMN) stations from 1920s to 2014 (Zhu and Lettenmaier, 2007). Finally, data from ERA5 was used; this is a global reanalysis (global model forecasts and observational data) using hourly and monthly data obtained from a combination of data measured by weather stations, ocean buoys, and data estimated from satellite information (Vanuyytrecht et al., 2021) for the 1979-2018 period.
From each climate database, 19 bioclimatic variables representing different annual, seasonal and monthly averages and trends of mean, maximum and minimum precipitation and temperature variables were used (Table 2).
Table 2 Bioclimatic variables.
| Variable | Description | Units | Variable | Description | Units |
|---|---|---|---|---|---|
| Bio 1 | Annual average temperature | °C | Bio 11 | Average temperature of the coldest quarter | °C |
| Bio 2 | Daytime temperature range | °C | Bio 12 | Annual precipitation | mm |
| Bio 3 | Isothermality (Bio2/Bio7)×100 | - | Bio 13 | Precipitation in the wettest month | mm |
| Bio 4 | Temperature seasonality | % | Bio 14 | Precipitation in the driest month | mm |
| Bio 5 | Maximum temperature of the warmest month | °C | Bio 15 | Seasonality of precipitation | % |
| Bio 6 | Minimum temperature of the coldest month | °C | Bio 16 | Precipitation in the wettest quarter | mm |
| Bio 7 | Annual temperature range (Bio5-Bio6) | °C | Bio 17 | Precipitation in the driest quarter | mm |
| Bio 8 | Average temperature in the wettest quarter | °C | Bio 18 | Precipitation in the warmest quarter | mm |
| Bio 9 | Average temperature in the driest quarter | °C | Bio 19 | Precipitation in the coldest quarter | mm |
| Bio 10 | Average temperature in the warmest quarter | °C |
The potential models of distribution of P. cembroides were obtained from the MaxEnt software (v3.4.3) that uses the principle of maximum entropy (Phillips et al., 2006; Elith et al., 2011). Based on a collinearity analysis, only bioclimatic variables with a variance inflation factor or VIF value of less than 10 were used in each distribution model (Belsley et al., 1991; Guisan et al., 2006). In every case, 80 % were used for training, and 20 % for validation (Marino et al., 2011).
The logistic output format was selected to indicate the likelihood of the presence of the species with values from 0 to 1 to indicate absence and maximum suitability, respectively (Phillips et al., 2006). Thresholds were identified for unfavorable conditions (<10 %), low potential (11-30 %), moderate potential (31-70 %), and high potential (>70 %) (Choudhury et al., 2016).
The relative contribution of each bioclimatic variable was estimated using the jackknife test (Phillips et al., 2006). The models were validated using the area under the curve (AUC) test (Pearson et al., 2007), in which values close to 1 indicate a higher correlation between the selected bioclimatic variables and the potential distribution obtained (Araújo et al., 2005; Phillips and Dudik, 2008).
Results
A total of 1 696 records of P. cembroides were obtained at the national level (1 251 from INFyS, and 445 from SNIB). The states with the highest number were the states of Chihuahua (690), Durango (310), Coahuila (165), Nuevo León (145) and Zacatecas (114), where more than 80 % of the total is concentrated (Table 3).
Table 3 Number of records of Pinus cembroides Zucc. by state.
| State | INFyS | SNIB | State | INFyS | SNIB |
|---|---|---|---|---|---|
| Chihuahua | 661 | 29 | Hidalgo | 6 | 17 |
| Durango | 273 | 37 | Veracruz | 1 | 17 |
| Coahuila | 51 | 114 | Jalisco | 7 | 3 |
| Nuevo León | 51 | 94 | Baja California | 5 | - |
| Zacatecas | 96 | 18 | Baja California Sur | 3 | - |
| Guanajuato | 30 | 17 | Tlaxcala | 1 | 3 |
| Tamaulipas | 17 | 25 | Michoacán | 1 | - |
| San Luis Potosí | 14 | 23 | State of Mexico | - | 1 |
| Querétaro | 9 | 21 | Total | 1 251 | 445 |
| Puebla | 3 | 23 | |||
| Sonora | 22 | 3 |
Source: National Forest and Soil Inventory (INFyS) (Conafor, 2012) and National Biodiversity Information System (SNIB) (Conabio, 2021).
Reliable and significant potential distribution models of P. cembroides were obtained with AUC values close to 0.8 in all four cases (Figure 2). The model with climate data from WorldClim v2.1 had the highest AUC value with 0.888 and the lowest value corresponded to the model with data from the ERA5 reanalysis, with an AUC of 0.793 in the validation.
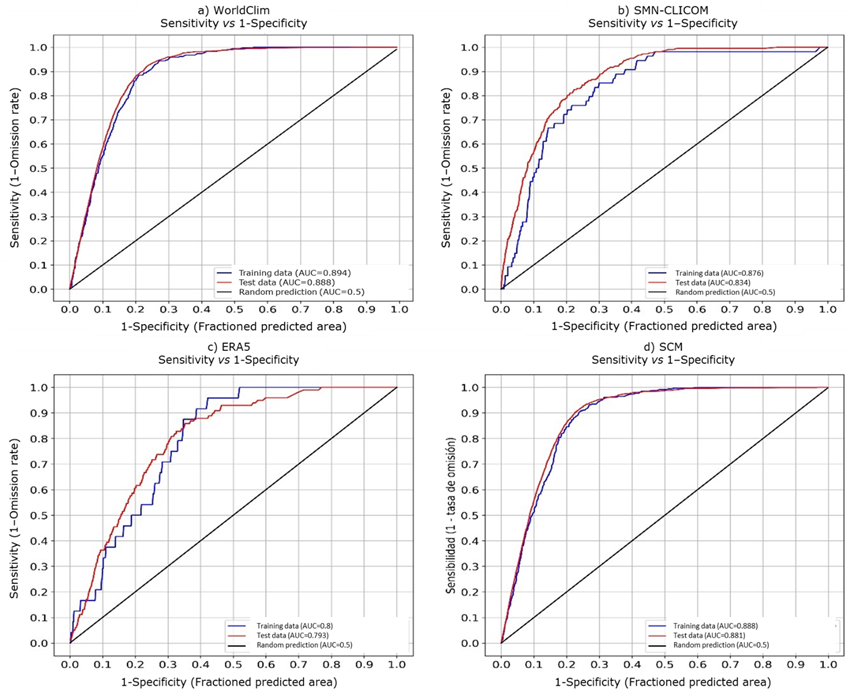
a) WorldClim v2.1; b) SMN-CLICOM; c) ERA5; d) SCM.
Figure 2 Analysis of the area under the curve (AUC).
Despite differences in spatial resolution and historical periods of the climate data, in all models the mean temperature of the wettest (Bio 8) and driest (Bio 9) quarters contributed more than 80 % to the potential distribution of P. cembroides (Table 4). In general, precipitation-derived variables contributed on average less than 5.0 % of the total rainfall.
Table 4 Contribution (%) of bioclimatic variables used in each model.
| Variable | WorldClim v2.1 | SMN-CLICOM | ERA5 | SCM |
|---|---|---|---|---|
| Bio 9 | 17.0 | 78.8 | 90.9 | 60.0 |
| Bio 8 | 68.5 | 12.0 | 3.4 | 30.7 |
| Bio 2 | 3.4 | 3.7 | 0.8 | 2.1 |
| Bio 3 | 4.0 | 1.5 | 1.1 | 1.1 |
| Bio 18 | 2.7 | 1.1 | - | 4.8 |
| Bio 12 | 3.6 | 1.9 | - | - |
| Bio 16 | - | - | 3.1 | - |
| Bio 15 | - | 1.0 | 0.4 | 0.8 |
| Bio 14 | 0.7 | - | 0.2 | 0.0 |
| Bio 19 | 0.3 | - | 0.1 | 0.4 |
The regions with the highest likelihood of the occurrence of P. cembroides were located along the Eastern and Western Sierras Madre with values above 70 %, and close to 50 % in the Transverse Neovolcanic Axis (Figure 3), which has a temperate climate and warm summers with Bio 8 intervals from 16 to 22 °C and Bio 9 from 10 to 16 °C, and an annual precipitation of less than 1 200 mm. However, differences were observed at the regional level between the models. In Coahuila and certain central regions of the country, the models based on climate data from SMN-CLICOM and ERA5 indicated a higher probability (50-70 %), compared to the results obtained with WorldClim v2.1 and SCM, which showed a likelihood of less than 30 %.
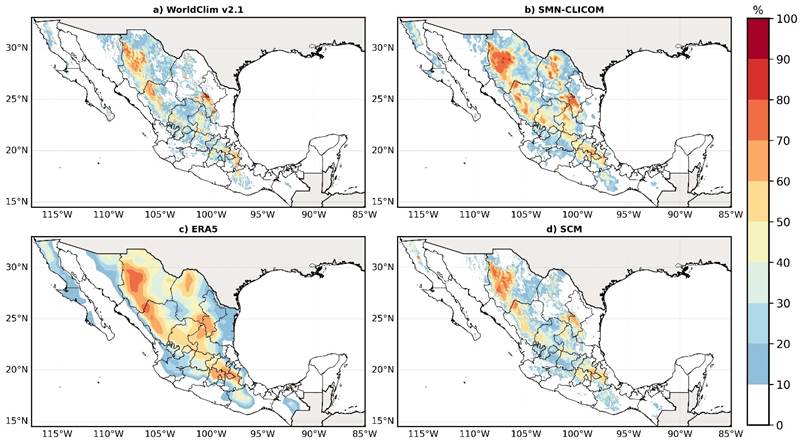
a) WorldClim v2.1; b) SMN-CLICOM; c) ERA5, d) SCM.
Figure 3 Potential distribution of Pinus cembroides Zucc.
The model with climate data from ERA5 overestimated the probability of presence of P. cembroides and showed a larger difference with respect to the other models, with probabilities of 20 to 30 % in the north of the state of Baja California, and above 60 % in the center and south of the country (Figure 3c). In the northern region of Coahuila, the models with lower spatial resolution (SMN-CLICOM and ERA5) overestimated the distribution of P. cembroides compared to the results of WorldClim v2.1 and SCM. Something similar was observed in the central region of the country, where ERA5 registered a likelihood of over 60 %. The WorldClim v2.1 and SCM models presented a similar likelihood of P. cembroides occurrence throughout the distribution, with differences of less than 25 % between them (Figure 4a).
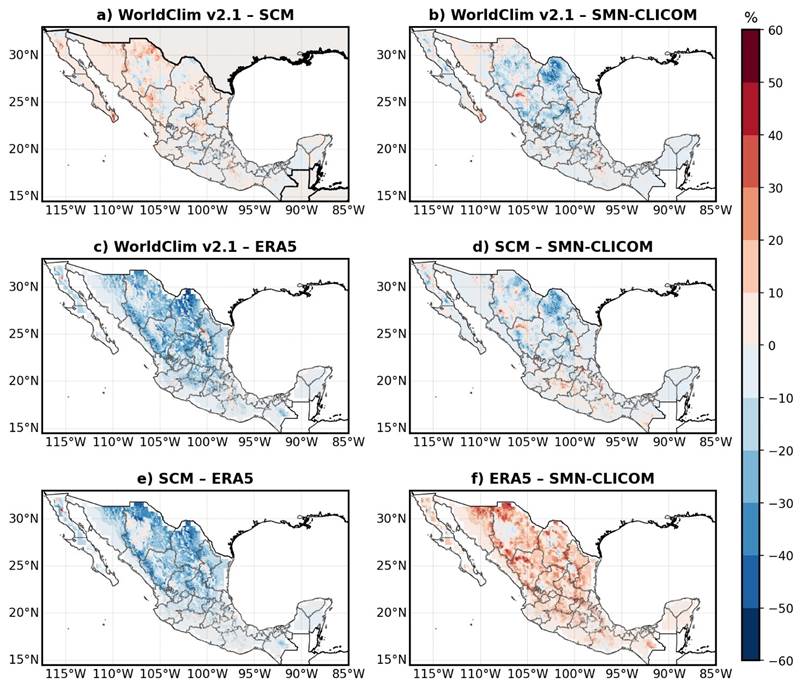
a) WorldClim v2.1-SCM; b) WorldClim v2.1-SMN-CLICOM); c) WorldClim v2.1-ERA5; d) SCM-SMN-CLICOM; e) SCM-ERA5; f) ERA5-SMN-CLICOM).
Figure 4 Probability differences between different models of potential distribution of Pinus cembroides Zucc. in Mexico.
The SMN-CLICOM model had a higher probability than the SCM and WorldClim v2.1 models (Figures 4b and 4c) in the state of Coahuila, with differences of 30 to 40 % and 40 to 50 %, respectively. Differences in probability between WorldClim v2.1, ERA5 and SCM models ranged between 40 and 50 % across the country (Figures 4c, 4e and 4f).
Discussion
Given the increase in the number of climate databases over the last few years (Livneh et al., 2015; Fick and Hijmans, 2017; Vanuyytrecht et al., 2021), it is possible to conduct studies to compare the effects of spatial resolution and temporal variability on the distribution patterns of different species. However, most SDMs research has used only WorldClimate climate data (Romero-Sánchez et al., 2017; Manzanilla-Quijada et al., 2020), and less than 10 % of it compares the use of other databases and the effects of these factors on SDMs performance and interpretation (Bobrowski et al., 2021).
In this work, the performance of distribution models of P. cembroides obtained from four climatic databases was evaluated. The results are consistent in showing that the performance of the distribution models of this species is dependent on the spatial resolution and temporal variability of the climatic information used (Bucklin et al., 2015; Abdulwahab et al., 2022).
The higher resolution WorldClim v2.1 and SCM models performed better with AUC values of 0.888 and 0.881, respectively, which indicates a higher correlation between the selected bioclimatic variables and the generated potential distribution (Connor et al., 2018; Zhang et al., 2021). In comparison, the ERA5 model exhibited the lowest performance, with an AUC value of 0.793; its records are lower than those documented in previous studies of the distribution of the Pinus genus, including P. cembroides, at national and regional level in northeastern Mexico, in which AUC values greater than 0.9 are cited (Aceves-Rangel et al., 2018; García-Aranda et al., 2018). However, it is possible that the performance of the models obtained in these studies is overestimated, as no collinearity analysis was performed to identify the bioclimatic variables with the highest correlation (Guisan et al., 2006; Dormann et al., 2023).
The distribution predictions obtained were higher than 0.750; therefore, all models are considered accurate and function as a tool to determine management and conservation plans for this species (Aguirre and Duivenvoorden, 2010; Aceves-Rangel et al., 2018). This study shows that for P. cembroides, models with a spatial resolution of 1 km2 had a better statistical performance than models with a resolution of over 15 km2. For certain species of limited distribution, SDMs obtained with climate data of low spatial resolution (>50 km2) may have a better statistical performance compared to other SDMs based on climate data with a higher resolution (Watling et al., 2014; Datta et al., 2020).
In previous distribution research based on WorldClim data for the 1950-2000 period, the mean annual temperature (Bio 1), altitude, and annual precipitation (Bio 12) were identified as the variables that influence the distribution of P. cembroides (Aceves-Rangel et al., 2018); however, the results of the present work indicate that in all models the distribution of P. cembroides at the national level is limited by the mean temperature of the wettest quarter (Bio 8) and the mean temperature of the driest quarter (Bio 9). At the regional level, they are consistent with the results obtained by García-Aranda et al. (2018) who for the 1950-2000 period conclude that the mean temperature of the driest quarter (Bio 9) and the maximum temperature of the warmest month (Bio 5) are the most important limiting factors for their distribution in northeastern Mexico.
The differences observed in the performance and interpretation of the distribution models are mainly due to differences in the spatial resolution and reference periods of the utilized predictors (Baker et al., 2017; Silva et al., 2019). Although the WorldClim v2.1 and SCM databases have a higher resolution compared to the SMN-CLICOM and ERA5 databases, they do not consider the increase in temperature observed in the last decade (2011-2020) in certain regions of Mexico (Cavazos et al., 2020). This is reflected in differences in the spatial distribution of bioclimatic variables between each database. For example, in regions of the Baja California Peninsula, the differences in the average temperature of the driest quarter between WorldClim v2.1 and SMN-CLICOM are greater than 5 °C, and in the average temperature of the wettest quarter, differences of over 5 °C were also observed in Chihuahua and areas of Sonora, Durango and Zacatecas. It is possible that if these data are included, the distribution of P. cembroides may be significantly modified, especially in regions where a positive trend in temperature increase has been observed at local and regional level.
In contrast, the ERA5 data does consider such a trend, but due to its spatial resolution no changes in the distribution of precipitation and temperature that might be used to identify climate shelters at the local level were observed (Austin and Van Niel, 2011).
The next step is to generate models of the potential distribution of P. cembroides at the national level, based on climate databases with a spatial resolution of over 15 km2 combining satellite-estimated information and measurements by surface stations, and integrating the climate variability observed in the last 30 years (1991-2020) in Mexico.
Conclusions
The performance of the P. cembroides distribution models depends on the spatial resolution and reference period of the climate data used. The WorldClim v2.1, SCM (1 km2 resolution) and SMN-CLICOM (15 km2) models have a better statistical performance compared to the ERA5 model (55.5 km2). In all models, the mean temperature variables for the wettest quarter (Bio 8), which occurs in the months of June through September in most of the country and in winter in the northwest, as well as the average temperature of the driest quarter (Bio 9) (late winter and early spring in northern, central and southern Mexico) account for over 80 % of the potential distribution of P. cembroides.
In general, it is concluded that it is necessary to use databases with a spatial resolution of at least 15 km2 in order to obtain reliable distribution models for P. cembroides that also include information on the observed warming in recent decades. The climate databases should be selected in collaboration with experts in the ecology of the species to be analyzed. The comparative analysis between different climate databases in SDMs performance is crucial to the process of planning management and conservation strategies for P. cembroides and other coniferous species with a more limited distribution.
Acknowledgments
The authors are grateful to the Consejo Nacional de Humanidades, Ciencia y Tecnología, Conahcyt (National Council for Humanities, Science and Technology) for the support granted for the first author's PhD.
REFERENCES
Abdulwahab, U. A., E. Hammill and C. P. Hawkins. 2022. Choice of climate data affects the performance and interpretation of species distribution models. Ecological Modelling 471:110042. Doi: 10.1016/j.ecolmodel.2022.110042. [ Links ]
Aceves-Rangel, L. D., J. Méndez-Gonzáles, M. A. García-Aranda y J. A. Nájera-Luna. 2018. Distribución potencial de 20 especies de pinos en México. Agrociencia 52(7):1043-1057. https://www.scielo.org.mx/scielo.php?script=sci_arttext&pid=S1405-31952018000701043 . (24 de febrero de 2023). [ Links ]
Aguirre G., J. and J. F. Duivenvoorden. 2010. Can we expect to protect threatened species in protected areas? A case study of the genus Pinus in Mexico. Revista Mexicana de Biodiversidad 81(3):875-882. https://www.scielo.org.mx/scielo.php?pid=S1870-34532010000300027&script=sci_abstract&tlng=en . (22 de febrero de 2023). [ Links ]
Antúnez, P., M. E. Suárez-Mota, C. Valenzuela-Encinas and F. Ruiz-Aquino. 2018. The potential distribution of tree species in three periods of time under a climate change scenario. Forests 9(10):628. Doi: 10.3390/f9100628. [ Links ]
Araújo, M. B., R. G. Pearson, W. Thuiller and M. Erhard. 2005. Validation of species-climate impact models under climate change. Global Change Biology 11(9):1504-1513. Doi: 10.1111/j.1365-2486.2005.01000.x. [ Links ]
Austin, M. P. and K. P. Van Niel. 2011. Improving species distribution models for climate change studies: Variable selection and scale. Journal of Biogeography 38(1):1-8. Doi: 10.1111/j.1365-2699.2010.02416.x. [ Links ]
Baker, D. J., A. J. Hartley, J. W. Pearce-Higgins, R. G. Jones and S. G. Willis. 2017. Neglected issues in using weather and climate information in ecology and biogeography. Diversity and Distributions 23(3):329-340. Doi: 10.1111/ddi.12527. [ Links ]
Belsley, D. A. 1991. Conditioning diagnostics: collinearity and weak data in regression. Wiley. Chichester, WS, United Kingdom. 396 p. [ Links ]
Bobrowski, M., J. Weidinger and U. Schickhoff. 2021. Is new always better? Frontiers in global climate datasets for modeling treeline species in the Himalayas. Atmosphere 12(5):543. Doi: 10.3390/atmos12050543. [ Links ]
Bucklin, D. N., M. Basille, A. M. Benscoter, L. A. Brandt, ... and J. I. Watling. 2015. Comparing species distribution models constructed with different subsets of environmental predictors. Diversity and Distributions 21(1):23-35. Doi: 10.1111/ddi.12247. [ Links ]
Carlón A., T., M. E. Mendoza, J. Villanueva D. and Y. Li. 2018. Climatic response of Pinus cembroides Zucc. radial growth in Sierra del Cubo, Guanajuato, Mexico. Trees 32(2):1387-1399. Doi: 10.1007/s00468-018-1720-1. [ Links ]
Cavazos, T., R. Luna-Niño, R. Cerezo-Mota, R. Fuentes-Franco, … and E. Valenzuela. 2020. Climatic trends and regional climate models intercomparison over the CORDEX-CAM (Central America, Caribbean and Mexico) domain. International Journal of Climatology 40(3):1396-1420. Doi: 10.1002/joc.6276. [ Links ]
Choudhury, M. R., P. Deb, H. Singha, B. Chakdar and M. Medhi. 2016. Predicting the probable distribution and threat of invasive Mimosa diplotricha Suavalle and Mikania micrantha Kunth in a protected tropical grassland. Ecological Engineering 97:23-31. Doi: 10.1016/j.ecoleng.2016.07.018. [ Links ]
Comisión Nacional Forestal (Conafor). 2012. Inventario Nacional Forestal y de Suelos. Informe 2004-2009. Coordinación General de Planeación e Información, Gerencia de Inventario Forestal y Geomática y Conafor. Zapopan, Jal., México. 212 p. https://www.ccmss.org.mx/wp-content/uploads/2014/10/Inventario_nacional_forestal_y_de_suelos_informe_2004_-_2009_.pdf . (7 de julio de 2022). [ Links ]
Comisión Nacional para el Conocimiento y Uso de la Biodiversidad (Conabio). 2008. Catálogo de metadatos geográficos. http://geoportal.conabio.gob.mx/metadatos/doc/html/clima1mgw.html . (23 de octubre de 2023). [ Links ]
Comisión Nacional para el Conocimiento y Uso de la Biodiversidad (Conabio). 2021. Portal de Geoinformación, Sistema Nacional de Información sobre Biodiversidad (SNIB). Comisión Nacional para el Conocimiento y Uso de la Biodiversidad. http://www.conabio.gob.mx/informacion/gis/ . (5 de agosto de 2022). [ Links ]
Connor, T., V. Hull, A. Viña, A. Shortridge, … and J. Liu. 2018. Effects of grain size and niche breadth on species distribution modeling. Ecography 41(8):1270-1282. Doi: 10.1111/ecog.03416. [ Links ]
Constante G., V., J. Villanueva D., J. Cerano P., E. H. Cornejo O. y S. Valencia M. 2009. Dendrocronología de Pinus cembroides Zucc. y reconstrucción de precipitación estacional para el sureste de Coahuila. Revista Ciencia Forestal en México 34(106):17-38. https://www.scielo.org.mx/scielo.php?script=sci_arttext&pid=S1405-35862009000200002 . (22 de febrero de 2023). [ Links ]
Cuervo-Robayo, A. P., O. Téllez-Valdés, M. A. Gómez-Albores, C. S. Venegas-Barrera, J. Manjarrez and E. Martínez-Meyer. 2014. An update of high-resolution monthly climate surfaces for Mexico. International Journal of Climatology 34(7):2427-2437. Doi: 10.1002/joc.3848. [ Links ]
Datta, A., O. Schweiger and I. Kühn. 2020. Origin of climatic data can determine the transferability of species distribution models. NeoBiota 59:61-76. Doi: 10.3897/neobiota.59.36299. [ Links ]
Dormann, C. F., J. Elith, S. Bacher, C. Buchmann, … and S. Lautenbach. 2013. Collinearity: a review of methods to deal with it and a simulation study evaluating their performance. Ecography 36(1):27-46. Doi: 10.1111/j.1600-0587.2012.07348.x. [ Links ]
Elith, J., S. J. Phillips, T. Hastie, M. Dudík, Y. E. Chee and C. J. Yates. 2011. A statistical explanation of MaxEnt for ecologists. Diversity and Distributions 17(1):43-57. Doi: 10.1111/j.1472-4642.2010.00725.x. [ Links ]
Fick, S. E. and R. J. Hijmans. 2017. WorldClim 2: New 1-km spatial resolution climate surfaces for global land areas. International Journal of Climatology 37(12):4302-4315. Doi: 10.1002/joc.5086. [ Links ]
García-Aranda, M. A., J. Méndez-González and J. Y. Hernández-Arizmendi. 2018. Potential distribution of Pinus cembroides, Pinus nelsonii and Pinus culminicola in northeastern Mexico. Ecosistemas y Recursos Agropecuarios 5(13):3-13. Doi: 10.19136/era.a5n13.1396. [ Links ]
Guisan, A., A. Lehmann, S. Ferrier, M. Austin, … and T. Hastie . 2006. Making better biogeographical predictions of species’ distributions. Journal of Applied Ecology 43(3):386-392. Doi: 10.1111/j.1365-2664.2006.01164.x. [ Links ]
Gutiérrez-García, J. V., D. A. Rodríguez-Trejo, A. Villanueva-Morales, S. García-Díaz y J. L. Romo-Lozano. 2015. Calidad del agua en la producción de Pinus cembroides Zucc. en vivero. Agrociencia 49(2):205-219. https://www.redalyc.org/articulo.oa?id=30236851008 . (24 de febrero de 2023). [ Links ]
Harris, I., P. D. Jones, T. J. Osborn and D. H. Lister. 2014. Updated high-resolution grids of monthly climatic observations-the CRU TS3.10 Dataset. International Journal of Climatology 34(3):623-642. Doi: 10.1002/joc.3711. [ Links ]
Herrera-Soto, G. , M. González-Cásares, M. Pompa-García, J. J. Camarero and R. Solís-Moreno. 2018. Growth of Pinus cembroides Zucc. in response to hydroclimatic variability in four sites forming the species latitudinal and longitudinal distribution limits. Forests 7(7):440. Doi: https://doi.org/10.3390/f9070440. [ Links ]
Jiménez-Valverde, A., M. Rodríguez-Rey and P. Peña-Aguilera. 2021. Climate data source matters in species distribution modelling: the case of the Iberian Peninsula. Biodiversity and Conservation 30(1):67-84. Doi: 10.1007/s10531-020-02075-6. [ Links ]
Lembrechts, J. J., J. Lenoir, N. Roth, T. Hattab, A… and I. Nijs. 2019. Comparing temperature data sources for use in species distribution models: From in-situ logging to remote sensing. Global Ecology and Biogeography 28(11):1578-1596. Doi: 10.1111/geb.12974. [ Links ]
Livneh, B., T. J. Bohn, D. W. Pierce, F. Munoz-Arriola, … and L. Brekke. 2015. A spatially comprehensive, hydrometeorological data set for Mexico, the U. S., and Southern Canada 1950-2013. Scientific Data 2:150042. Doi: 10.1038/sdata.2015.42. [ Links ]
Manzanilla-Quijada, G. E., E. J. Treviño-Garza, B. Vargas-Larreta, J. O. López-Martínez y J. M. Mata-Balderas. 2020. Áreas idóneas con potencial para la producción de semillas de Pinus chihuahuana Engelm. y Pinus leiophylla Schltdl. & Cham. en México. Botanical Sciences 98(2):305-316. Doi: 10.17129/botsci.2514. [ Links ]
Marino, J., M. Bennett, D. Cossios, A. Iriarte, ... and S. Walker. 2011. Bioclimatic constraints to Andean cat distribution: a modelling application for rare species. Diversity and Distributions 17(2):311-322. Doi: 10.1111/j.1472-4642.2011.00744.x. [ Links ]
Nezer, O., S. Bar-David, T. Gueta and Y. Carmel. 2017. High-resolution species-distribution model based on systematic sampling and indirect observations. Biodiversity and Conservation 26(2):421-437. Doi: 10.1007/s10531-016-1251-2. [ Links ]
Pearson, R. G., C. J. Raxworthy, M. Nakamura and A. T. Peterson. 2007. Predicting species distributions from small numbers of occurrence records: a test case using cryptic geckos in Madagascar. Journal of Biogeography 34(1):102-117. Doi: 10.1111/j.1365-2699.2006.01594.x. [ Links ]
Phillips, S. J. and M. Dudík . 2008. Modeling of species distributions with Maxent: new extensions and a comprehensive evaluation. Ecography 31(2):161-175. Doi: 10.1111/j.2007.0906-7590.05203.x. [ Links ]
Phillips, S. J. , R. P. Anderson and R. E. Schapire. 2006. Maximum entropy modeling of species geographic distributions. Ecological Modelling 190(3-4):231-259. Doi: 10.1016/j.ecolmodel.2005.03.026. [ Links ]
Romero-Sánchez, M. E., A. González-Hernández, R. Pérez-Miranda, E. Velasco-Bautista y F. Moreno-Sánchez. 2017. Efecto del Cambio Climático a nivel local en la distribución potencial de cuatro especies forestales de la Cuenca Río-Bravo-San Juan, Coahuila, México. Agroproductividad 10(8):42-47. https://revista-agroproductividad.org/index.php/agroproductividad/article/view/1073 . (22 de febrero de 2023). [ Links ]
Rzedowski, J. 1978. Vegetación de México. Limusa, S. A. México, D. F. México. 432 p. [ Links ]
Silva, L. D., E. B. de Azevedo, F. V. Reis, R. B. Elias and L. Silva. 2019. Limitations of species distribution models based on available climate change data: A case study in the Azorean forest. Forests 10(7):575. Doi: 10.3390/f10070575. [ Links ]
Stewart, S. B., M. Fedrigo, S. Kasel, S. H. Roxburgh, … and C. R. Nitschke. 2022. Predicting plant species distributions using climate-based model ensembles with corresponding measures of congruence and uncertainty. Diversity and Distributions 28(5):1105-1122. Doi: 10.1111/ddi.13515. [ Links ]
Téllez-Valdés, O., C. Miguel-Talonia, M. E. Suárez-Mota , R. X. Álvarez-Espino y M. M. Hernández-Moreno. 2019. Distribución potencial de las especies Pinaceae (Pinus) y Fagaceae (Quercus) de México. Informe final SNIB-CONABIO proyecto JM010. Facultad de Estudios Superiores Iztacala y Universidad Nacional Autónoma de México. Tlalnepantla de Reyes, Edo. Méx., México. 26 p. http://www.conabio.gob.mx/institucion/proyectos/resultados/InfJM010.pdf . (23 de octubre de 2022). [ Links ]
Vanuyytrecht, E., H. Wouters, J. Berckmans and K. De Ridde. 2021. Global bioclimatic indicators from 1979 to 2018 derived from reanalysis. Product User Guide. Copernicus Climate Change Service. Reading, WBK, United Kingdom. 40 p. https://datastore.copernicus-climate.eu/documents/sis-biodiversity/C3S_D427.3.1.1_Product_user_guide-Bioclimatic_indicators_ERA5_v2.3.pdf . (23 de octubre de 2023). [ Links ]
Watling, J. I., R. J. Fletcher, C. Speroterra, D. N. Bucklin, … and F. J. Mazzotti. 2014. Assessing effects of variation in global climate data sets on spatial predictions from climate envelope models. Journal of Fish and Wildlife Management 5(1):14-25. Doi: 10.3996/072012-JFWM-056. [ Links ]
Zhang, Y., J. Tang, G. Ren, K. Zhao and X. Wang. 2021. Global potential distribution prediction of Xanthium italicum based on Maxent model. Scientific Reports 11(1):16545. Doi: 10.1038/s41598-021-96041-z. [ Links ]
Zhu, C. and D. P. Lettenmaier. 2007. Long-term climate and derived surface hydrology and energy flux data for Mexico: 1925-2004. Journal of Climate 20(9):1936-1946. Doi: 10.1175/JCLI4086.1. [ Links ]
Received: March 06, 2023; Accepted: June 22, 2023
 Este es un artículo publicado en acceso abierto bajo una licencia
Creative Commons
Este es un artículo publicado en acceso abierto bajo una licencia
Creative Commons
