


Services on Demand
Journal
Article
 text in
  English (pdf)
 Article in xml format
 Article references
 Send this article by e-mail
Indicators
-
 Cited by SciELO
 -
 Access statistics
Related links
-
 Similars in
SciELO
Similars in
SciELO
Share

 Permalink
Revista mexicana de ciencias forestales
Print version ISSN 2007-1132
Rev. mex. de cienc. forestales vol.14 n.79 México Sep./Oct. 2023 Epub Oct 06, 2023
https://doi.org/10.29298/rmcf.v14i79.1342
Scientific article
Mulch decomposition models in temperate ecosystems in Northeastern Mexico
1
 http://orcid.org/0009-0008-4475-5567
2
http://orcid.org/0000-0001-5797-1658
3
http://orcid.org/0000-0002-3047-7278
1
http://orcid.org/0000-0001-8996-0881
1
http://orcid.org/0000-0001-6715-4723
1Universidad Autónoma de Nuevo León. Facultad de Ciencias Forestales. México.
2Universidad Autónoma de San Luis Potosí. Facultad de Agronomía y Veterinaria. México.
3Universidad Autónoma de Nuevo León. Facultad de Economía. México.
Mulch decomposition is an essential process for maintaining the net primary productivity and fertility of forest ecosystems. For this reason, a one-year study was conducted in the Pablillo ejido in Galeana municipality, state of Nuevo León, Mexico, to understand the process of mulch decomposition in three temperate forest ecosystems (pine, oak, and pine-oak) using mathematical models to predict the rate of decomposition. In each ecosystem, 60 black polypropylene bags containing 10 g of mulch were distributed in five 20 m×20 m plots. When comparing the three vegetation types, mass loss was 14 % for pine, 22 % for pine-oak, and 23 % for oak. According to the regression analysis, the Simple Negative Exponential (Olson) and simple linear models showed the best goodness of fit with respect to the logarithmic and power models. The simple linear model presented a better fit with R 2 values=0.719 (oak), 0.626 (pine), and 0.620 (pine-oak); for the Olson model, the R 2 coefficient ranged from 0.710 (oak) to 0.617 (pine-oak). The decomposition process showed significant differences between ecosystems attributable to the chemical composition of the mulch. The pine ecosystem showed the lowest decomposition percentage.
Key words Coefficient of determination; temperate ecosystems; mulch; pine-oak; linear regression; decomposition rate
La descomposición del mantillo es un proceso fundamental para mantener la productividad primaria neta y la fertilidad de los ecosistemas forestales. Por tal motivo, se realizó un estudio en el ejido Pablillo, municipio Galeana, Nuevo León, México durante un año para conocer el proceso de descomposición del mantillo en tres ecosistemas forestales de clima templado (pino, encino y pino-encino) que incluyó modelos para predecir la tasa de descomposición. En cada ecosistema se distribuyeron en cinco parcelas de 20 m×20 m 60 bolsas de polipropileno negro con 10 g de mantillo. Al comparar los tres tipos de vegetación, la pérdida de masa fue de 14 % para pino, 22 % en pino-encino y 23 % para encino. De acuerdo con el análisis de regresión, los modelos exponencial negativo simple (Olson) y lineal simple mostraron la mejor bondad de ajuste respecto a los modelos logarítmico y de potencia. El modelo lineal simple presentó un mejor ajuste con valores de R 2 =0.719 (encino), 0.626 (pino) y 0.620 (pino-encino); para el modelo de Olson, el Coeficiente R 2 varió de 0.710 (encino) a 0.617 (pino-encino). La constante de descomposición del modelo de Olson fluctuó de 1.017 (encino) a 0.946 años (pino-encino), y en el modelo lineal simple de 1.009 (encino) a 0.944 años (pino-encino). El proceso de descomposición tuvo diferencias significativas entre ecosistemas atribuibles a la composición química del mantillo. En el ecosistema de pino se presentó el menor porcentaje de descomposición.
Palabras clave Coeficiente de determinación; ecosistemas templados; mantillo; pino-encino; regresión lineal; tasa de descomposición
Introduction
The decomposition of organic matter provided by mulch is the precursor and regulator of nutrient availability patterns and is responsible for supplying, in part, the energy flow in forest ecosystems (Weltzin et al., 2005). It is estimated that 80 % of the total nutrients that the plants require are released during this decomposition process (Liu et al., 2006; Sayer et al., 2020), therefore, it is key to the functioning of biogeochemical cycles, as it favors the physical, chemical and biological conditions of the soil (Liu et al., 2004; Castellanos and León, 2010).
Mulch and soil decomposition have regulators in common that act differently, for example, soil aeration affects the decomposition of organic matter, but has very little impact on mulch decomposition. Other regulators that directly affect the decomposition process are climate, litter composition, soil fauna and microorganisms (Pando-Moreno et al., 2018); vegetation structure and composition are some of the most important factors, as they determine local variation in mulch accumulation and decomposition processes (Gaspar-Santos et al., 2015).
Cornelissen (1996) highlights that the chemical composition of the mulch is a key element in the rate at which organic matter decomposes. In general, the decomposition process of the organic matter provided by the mulch consists of two stages: an initial stage of rapid development due to the leaching of soluble compounds and the decomposition of sugars, phenols and proteins (Arellano et al., 2004), and a second phase, characterized by slower decomposition due to the content of cellulose, lignin, and hemicellulose (recalcitrant substances), resulting in a lower decomposition rate (Crespo, 2015).
In temperate forest ecosystems dominated by the Pinus and Quercus genera, the in situ decomposition process has shown that certain climatic variables, species composition and distribution tend to be factors that determine the rate or dynamics of mass loss (Moreno et al., 2018). Therefore, the study of the process of mulch decomposition in temperate ecosystems is essential to attain a large-scale understanding of nutrient release (Bohara et al., 2019). Therefore, the objective of this study was to understand the process of mulch decomposition in pine, oak, and pine-oak ecosystems, including models to predict the decomposition rate in each plant community, based on the following hypothesis: decomposition in the pine ecosystem is slower than in the oak and pine-oak ecosystems, where the mulch has different physicochemical characteristics due to the conditions of the vegetation structure.
Materials and Methods
Study area
This research was carried out in three different ecosystems (pine, oak and pine-oak), which are located in the Pablillo ejido, Galeana municipality, state of Nuevo León (Figure 1), whose climate is arid, temperate, with over 18 % of the rainfalls per year occurring between summer and winter (García, 2004). The predominant plant communities in the area are scrub and coniferous forests with the presence of Pinus pseudostrobus Lindl. and mixed stands with Pinus teocote Schltdl. & Cham., P. ayacahuite var. brachyptera Shaw, P. arizonica Engelm., P. cembroides Zucc., P. hartwegii Lindl., Pseudotsuga menziesii (Mirb.) Franco var. glauca (Mayr) Franco and the association of Pinus pseudostrobus with Quercus spp., as well as with Quercus sideroxyla Bonpl., secondly: P. culminicola Andresen & Beaman, Arbutus glandulosa M. Martens & Galeotti, Quercus crassifolia Bonpl., Alnus acuminata Kunth, and Juniperus deppeana Steud. var. robusta Martínez (Tapia y Návar, 2011).
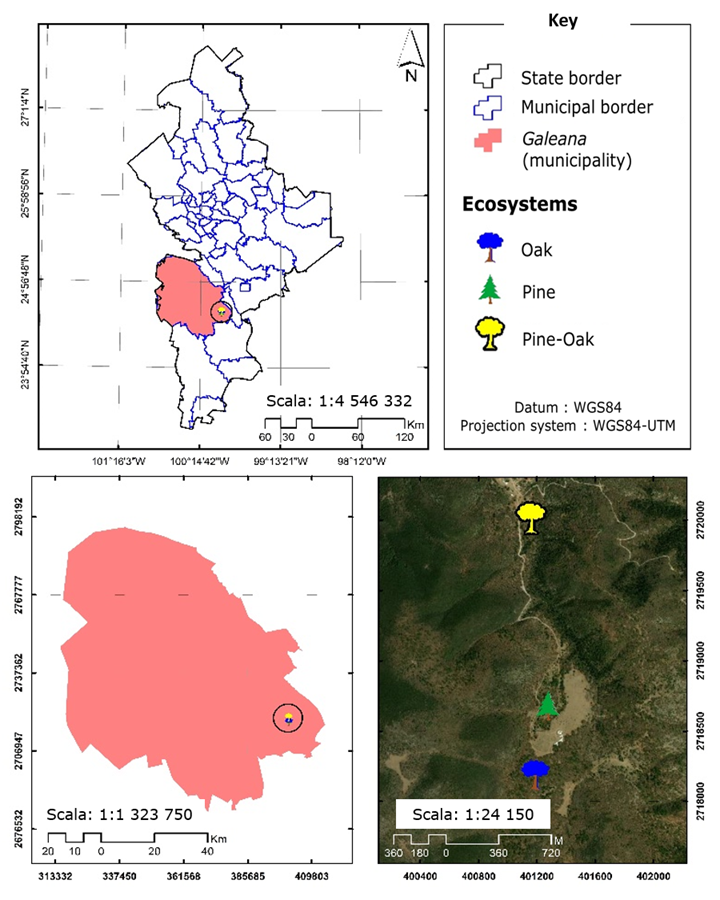
The altitudinal range in which the ecosystems under study develop is 2 267 masl for pine (geographic location: 24°34'44.34" N; 99°58'30.12" W), 2 313 masl for oak (geographic location: 24°34'28.32" N; 99°58'33.180" W), and 2 160 masl for pine-oak (geographic location: 24°35'27.66" N; 99°58'34.50" W).
Mulch degradation and harvesting frequency
Based on the litter decomposition bag method proposed by Bocock and Gilbert (1957), the decomposition process of mulch in three temperate ecosystems was evaluated over a one year period under outdoor conditions. Mulch corresponds to all the material that is formed once the leaf litter falls to the ground forming an organic layer (Pérez-Vázquez et al., 2021); it was handled uniformly in the three ecosystems, for this purpose, 10 g dry weight of a uniform mixture of the litter components (leaves, branches, bark, reproductive structures and other miscellaneous components), collected in each of the ecosystems one month before the start of the experiment so that it would be fresh material and placed in paper bags, it was then dried at 65 °C. The collection was carried out randomly at each site (López-Hernández et al., 2018).
A total of 60 decomposition bags were used for each ecosystem type; 12 were randomly distributed in five 20 m × 20 m experimental plots adjacent to one other in order to cover the total area of the site in each ecosystem. The 25 cm × 20 cm bags were made of 1 mm nylon fabric (Rodríguez et al., 2019), allowing invertebrate detritivores to access the interior but minimizing fragmentation losses (Martínez-Atencia et al., 2020). Each bag was placed on the surface of the soil without altering the conditions of the decomposing substrate, in order to avoid modifying the natural conditions in which the decomposing microorganisms develop, in addition to maintaining contact with the organic matter of the soil (Rodríguez et al., 2019).
The assessment was carried out during 12 sampling dates between February 2021 and January 2022; five bags were collected every 30 days from each plot and study ecosystem. The material was transported to the Chemistry Laboratory of the Graduate School of Forest Sciences of the Universidad Autónoma de Nuevo León, where the methodology proposed by López-Hernández et al. (2018) was applied to dry it in a FE-292AD Felisa® forced-air oven at a constant 65 °C temperature, until a constant weight (g) was obtained. Several studies (Rivera et al., 2013; Tapia-Coronado et al., 2022) consider that soil particles adhering to the plant material do not alter the results and can be regarded as negligible, however, in order to remove them, the subsamples were cleaned with a brush. The remaining weight (g) of the mulch from each repetition was obtained in order to estimate the degree of decomposition by the difference between the initial weight and the final weight of each sampling date, both were recorded with a LC 620 S Sartorius® digital balance, with a 0.001 g resolution.
Using the Simple negative exponential model proposed by Olson (1963), the decomposition rate of the uniform mixture of the mulch components (10 g) was estimated for each ecosystem. In addition to Olson's (1963) exponential model, and in order to estimate mulch decomposition rates, other mathematical models (simple linear, logarithmic, and power) were tested to determine which had a better fit in estimating the decomposition rate compared to the reference model:
Where:
H = Remaining mulch fraction (years)
T = Time (years)
nl = Natural logarithm
β 0 = Percentage of initial weight of mulch
β 1 = Mulch degradation rate
Statistical analyses
The averages of the remaining mulch fraction by sampling date and ecosystem were subjected to statistical analysis to test the assumptions of normality (Kolmogorov-Smirnov test with Lilliefors correction) and homogeneity of variances (Levene's test) (Ott, 2001). Since both assumptions were demonstrated, an analysis of variance was performed according to an experimental design with a classification criterion (Steel and Torrie, 1980) in order to detect the differences in the amount of remaining mulch fraction between forest ecosystems for each sampling date. A comparison of means of the remaining mulch fraction by date was performed using Tukey's HDS test (p=0.05) (Ott, 2001). The evaluation of the goodness of fit of each utilized model for determining the mulch decomposition rate was carried out based on the graphs of the residues, the root mean square values of the error, and Pearson's coefficients of determination (R 2 ) and correlation (r) (Ott, 2001). All statistical analyses were performed with the Statistical Package for Social Sciences (SPSS) version 22.0 for Windows (IBM, 2016).
Results and Discussion
Mulch decomposition
Table 1 shows the average remaining mulch fraction by ecosystem. The statistics and p-values of the Kolmogorov-Smirnov test and Levene's test (L), as well as the F and p-values of the analysis of variance by sampling date, are also included. According to Tukey's HDS test, most of the collection dates showed significant differences (p<0.05) between ecosystems, except for the fourth (MAY-21), sixth (JUL-21) and last (JAN-22) sampling dates.
Table 1 Average remaining mulch fraction by date of collection and ecosystem.
| Collection date | Remaining mulch fraction | K-S | P Value | L | P Value | F | P Value | EMSE | ||
|---|---|---|---|---|---|---|---|---|---|---|
| Oak | Pine | Pine-Oak | ||||||||
| 1. FEB-21 | 0.944a | 0.935a | 0.913b | 0.193 | 0.139 | 5.54 | 0.020 | 14.26 | 0.001 | 0.0042 |
| 2. MAR-21 | 0.947a | 0.928b | 0.914c | 0.218 | 0.052 | 1.69 | 0.225 | 25.95 | 0.001 | 0.0033 |
| 3. ABR-21 | 0.958a | 0.944a | 0.920b | 0.142 | 0.200 | 1.86 | 0.198 | 21.14 | 0.001 | 0.0042 |
| 4. MAY-21 | 0.924a | 0.920a | 0.905a | 0.156 | 0.200 | 0.03 | 0.975 | 1.46 | 0.270 | 0.0085 |
| 5. JUN-21 | 0.907a | 0.918a | 0.871b | 0.118 | 0.200 | 1.01 | 0.392 | 9.58 | 0.003 | 0.0078 |
| 6. JUL-21 | 0.897a | 0.928a | 0.896a | 0.200 | 0.111 | 0.05 | 0.951 | 0.82 | 0.462 | 0.0201 |
| 7. AGO-21 | 0.812b | 0.891a | 0.820b | 0.206 | 0.085 | 1.63 | 0.237 | 30.50 | 0.001 | 0.0079 |
| 8. SEP-21 | 0.819b | 0.904a | 0.866ab | 0.120 | 0.200 | 0.32 | 0.731 | 10.58 | 0.002 | 0.0130 |
| 9. OCT-21 | 0.792b | 0.880a | 0.806ab | 0.171 | 0.200 | 1.24 | 0.330 | 5.18 | 0.029 | 0.0213 |
| 10. NOV-21 | 0.704b | 0.848a | 0.838a | 0.196 | 0.148 | 1.45 | 0.276 | 7.61 | 0.008 | 0.0322 |
| 11. DIC-21 | 0.692b | 0.826a | 0.776a | 0.161 | 0.200 | 1.45 | 0.281 | 12.79 | 0.002 | 0.0198 |
| 12. ENE-22 | 0.765a | 0.857a | 0.788a | 0.230 | 0.187 | 7.36 | 0.024 | 1.18 | 0.369 | 0.0441 |
EMSE = Estimated mean standard error. ** Means of the remaining mulch fraction with the same letter are not statistically different (p>0.05) according to Tukey's HSD test.
Figure 2 shows the dynamics of the remaining mulch fraction for the three ecosystems during the study period. In the first three dates (FEB-21 to APR-21), the remaining fraction of mulch ranged between 0.913 (pine-oak ecosystem) and 0.958 (oak ecosystem). Between APR-21 and DEC-21, the fraction of remaining mulch in the pine ecosystem gradually decreased to 0.83 %, while in the pine-oak and oak ecosystems this fraction was 0.78 % and 0.69 %, respectively; decomposition was more noticeable in the oak ecosystem. With respect to the last collection date (JAN-22), a slight increase in the remaining fraction of mulch was observed in the three ecosystems, according to Pinos et al. (2017), this phenomenon happens due to the particular climatic conditions that develop during the decomposition process, which act in a direct way, slowing or increasing the process. In the same sense, von Arx et al. (2012) state that the decomposition process is strongly influenced by climate characteristics such as humidity, temperature, and precipitation, which actively slow down decomposition during specific periods of time, and even stop it.
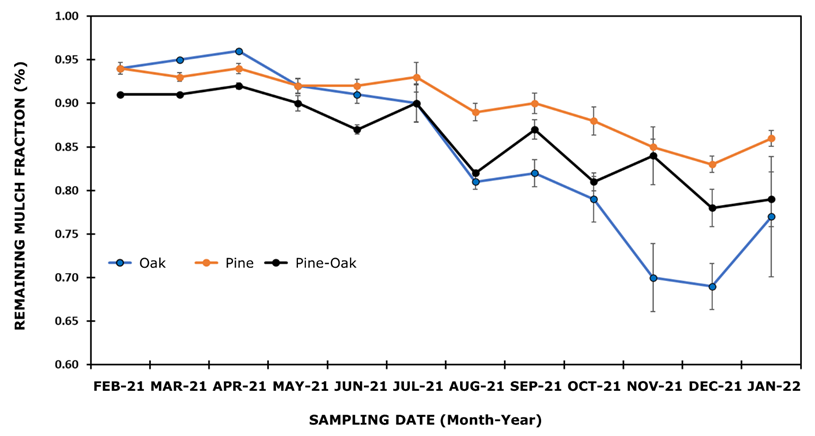
Each plotted value represents the mean of n ij observations of ecosystem i on sampling date j, with i = 1, 2, 3; j = 1, ... , 12 ± Standard error of the mean.
Figure 2 Fraction of remaining mulch of the three ecosystem types.
The results of the present study are congruent with the research conducted by Xuluc-Tolosa et al. (2003), but differ from that documented by Torres et al. (2018), who indicate that the rate of decomposition in the first months is higher and then the slope becomes slower and is significantly reduced, which largely responds to the type of ecosystem studied; the rapid mass loss in the first period is associated with the low presence of tannins and nitrogen released during the decomposition process of mangrove-associated species. On the contrary, temperate forest ecosystems may exhibit a slow decomposition process in the first phase due to the chemical composition of pine needles (Moreno et al., 2018).
Rivera et al. (2013) point out that the first stage is controlled by fragmentation by the soil fauna and is related to water-soluble compounds, while in the second stage it is more directly related to the lignin content of the mulch, which slows down decomposition. This may explain the differences in mulch decomposition in the pine ecosystem, which was slower than in the oak ecosystem (Figure 2).
This reasoning allows us to assume differences in the chemical composition of the mulches in the ecosystems studied. In this regard, Bruno-Eutimio et al. (2022) document that the chemical composition of the mulch is a determining factor that is reflected during the decomposition process. In the same sense, Avendaño-Yáñez et al. (2020) and Berg and McClaugherty (2020) conclude that the differences observed during the decomposition process are associated with the type of litter and its chemical composition, which can pause or drive the process in different ecosystems. The percentage of mulch decomposition at the end of the study was 14 % for the pine ecosystem, 22 % for the pine-oak ecosystem, and 23 % for the oak ecosystem.
According to the results of Rodríguez et al. (2019), the loss of the remaining mulch fraction for pine, oak, and pine-oak ecosystems was 17, 27 and 23 %, respectively; which coincide with the intervals observed in the present study. Therefore, the decomposition process in pine, oak, and pine-oak ecosystems follows a trend, even when these ecosystems are located in different areas, with different soil types and particular characteristics, and these similarities can be explained at the local scale by the chemical composition of the mulch typical of mixed forests, which generally have low fertility (Reed et al., 2012).
From the research study developed by Soong et al. (2015) under laboratory conditions at the Colorado State University, mulch fraction losses for pine (Pinus ponderosa P. Lawson & C. Lawson) is 28 %, and 58 % for oak (Quercus macrocarpa Michx.), with higher decomposition compared to the results of the present research for oak, results that are associated with some factors acting passively in the decomposition process, for example: chemical and biotic factors that play a fundamental role in the behavior of mulch mass loss, even when they are species of the same genus (Bangroo et al., 2017).
An important factor to consider in mulch decomposition studies is the time to evaluate the process of mass loss, mainly associated with forest ecosystems, as suggested by Prescott (2005), who indicates that decomposition patterns can be modified in long-term experiments, since the percentage of decomposition of mulch in the long term reaches a higher disintegration and thus a better understanding of the process is achieved. In this regard, Horodecki and Jagodziński et al. (2019) document that, in order to understand processes such as mineralization and humidification, it is necessary to fully analyze the process, whereby a more accurate understanding of nutrient release can be attained.
The study period for the present study was one year, considered convenient for temperate climate species associated with forest ecosystems (Edwards, 1977; Rocha-Loredo and Ramírez-Marcial, 2009; López-Hernández et al., 2018), which compared to other studies in tropical climate ecosystems is sufficient to stabilize the decomposition process. For example, Oliveira et al. (2019) only analyzed leaf litter decomposition over a period of 136 days for Urochloa brizantha (Hochst. ex A. Rich.) R. D. Webster, and conclude that the residual mass of mulch after one day of decomposition adds to the mass of newly deposited mulch that continues to decompose day after day; thus, it is a continuous process that needs to be studied at continuous time intervals. Rivera et al. (2013) studied the process of disintegration of organic matter in a temperate ecosystem in the Selva El Ocote Biosphere Reserve for 223 days, including several species, among them: Enterolobium cyclocarpum (Jacq.) Griseb., Salix bonplandiana Kunth, Cecropia peltata L., Heliocarpus appendiculatus Turcz. and Mastichodendron capiri (A. DC.) Cronquist. The most determining factor in the decomposition process was the age of the individuals. Tapia-Coronado et al. (2022) in 210 days analyzed the decomposition behavior of leaf litter from forest species [Gmelina arborea Roxb. ex Sm., Tabebuia rosea (Bertol.) DC. and Acacia mangium Willd.] in tropical dry climate silvopastoral systems, whose decomposition process is similar to that of the present work, with a rapid initial loss of material that favors the active release of nutrients, and then becomes a slower process. Zhang et al. (2008) observed that variations in mulch decomposition rates are mainly due to differences in litter quality, microclimates, microbial community type and composition, and soil properties, with mulch quality being the main factor in the decomposition process.
In general, in broadleaved forests where precipitation and temperatures are high, the decomposition process is usually more accelerated than in ecosystems where temperature and precipitation are lower, for example, coniferous forests. Another determining factor is the acidity of the soils in coniferous forests, which, being more acidic than in other ecosystems, such as grasslands, limits microbial activities and, therefore, reduces the decomposition process of mulch (Gholz et al., 2000).
Mulch decomposition models
The values of the fit statistics of the four decomposition models evaluated are described in Table 2; it is observed that the Coefficient of determination presented a fluctuation from 0.455 to 0.719, relatively lower values in relation to those documented by Moreno et al. (2018) in mixed ecosystems (0.965 to 0.069), and Rodríguez et al. (2019) who refer for this statistic an interval between 0.577 and 0.899 in forest ecosystems in the north of the country.
Table 2 Regression models fitted for the estimation of the fraction of remaining mulch during the study period for the three ecosystem types.
| Model | Ecosystem | Estimated coefficient | 95 % confidence intervals | Estimated coefficient | 95 % confidence intervals | Statistics | ||||
|---|---|---|---|---|---|---|---|---|---|---|
|
|
|
|
|
|
|
R 2 | RMSE | Pearson’s coefficient |
||
| Exponential | Oak | 1.017 | 0.983 | 1.051 | 0.352 | 0.290 | 0.414 | 0.71 | 0.054 | 0.843 |
| Pine | 0.961 | 0.946 | 0.976 | 0.128 | 0.101 | 0.156 | 0.621 | 0.026 | 0.788 | |
| Pine-Oak | 0.946 | 0.926 | 0.967 | 0.180 | 0.141 | 0.220 | 0.617 | 0.034 | 0.785 | |
| Simple linear | Oak | 1.009 | 0.979 | 1.039 | -0.303 | -0.354 | -0.252 | 0.719 | 0.053 | 0.848 |
| Pine | 0.960 | 0.946 | 0.975 | -0.116 | -0.141 | -0.092 | 0.626 | 0.025 | 0.791 | |
| Pine-Oak | 0.944 | 0.924 | 0.963 | -0.156 | -0.190 | -0.123 | 0.62 | 0.034 | 0.788 | |
| Logaríthmic | Oak | -0.276 | -0.312 | -0.24 | -0.126 | -0.157 | -0.094 | 0.537 | 0.085 | 0.733 |
| Pine | -0.144 | -0.158 | -0.13 | -0.044 | -0.056 | -0.031 | 0.462 | 0.034 | 0.680 | |
| Pine-Oak | -0.203 | -0.224 | -0.183 | -0.063 | -0.081 | -0.045 | 0.489 | 0.047 | 0.699 | |
| Power | Oak | 0.770 | 0.744 | 0.797 | -0.112 | -0.140 | -0.084 | 0.543 | 0.068 | 0.737 |
| Pine | 0.867 | 0.854 | 0.880 | -0.042 | -0.054 | -0.029 | 0.455 | 0.031 | 0.675 | |
| Pine-Oak | 0.819 | 0.802 | 0.836 | -0.059 | -0.076 | -0.042 | 0.485 | 0.04 | 0.696 | |
β 0 and β 1 = Model coefficients; LL and UL = Lower and upper limit of the model coefficients, respectively; R 2 = Coefficient of determination; RMSE = Root mean square error.
The values obtained from the fit of the models in the three ecosystems under study for the Correlation coefficient ranged between 0.675 and 0.848, which are low compared to those cited by Del Valle-Arango (2003) of 0.966, and Ibarra et al. (2011) of 0.946. The Simple negative exponential model (Olson, 1963) presented a good fit according to the Coefficient of determination, ranging from 0.617 (pine-oak ecosystem) to 0.710 (oak ecosystem). Pearson's correlation coefficient was distributed between 0.785 and 0.843. This model is the most commonly used to describe the rate of mulch decomposition (Swift et al., 1981; Burghouts et al., 1998; Gama-Rodrigues et al., 2003; Tapia-Coronado et al., 2022).
The Simple linear model had a Coefficient of determination (R 2 ) ranging from 0.620 (pine-oak ecosystem) to 0.719 (oak ecosystem). The logarithmic and power models presented low determination coefficients (0.462 to 0.543), with respect to the exponential and simple linear models.
Mulch decomposition rate
The decomposition rate (constant k) of mulch resulting from the exponential and simple linear models, which were considered as a reference based on the highest values of the coefficients of determination, are presented in Table 2; it is observed that this constant for the three ecosystems was 0.352, 0.180, and 0.128, respectively, from which the theoretical time required for 25 %, 50 %, and 75 % of the mulch to degrade was estimated. The estimated values, according to the model proposed by Olson (1963), ranged from 0.866 (oak ecosystem) to 10.455 years (pine ecosystem) (Table 3).
Table 3 Estimated time (years) to disintegrate 25 % (t0.25), 50 % (t0.5), and 75 % (t0.75) of the mulch in the three types of ecosystems.
| Model | PD | Ecosystems | ||||||||
|---|---|---|---|---|---|---|---|---|---|---|
| Oak | Pine | Pine-Oak | ||||||||
| Estimate | LL | UL | Estimate | LL | UL | Estimate | LL | UL | ||
| Exponential | 25 | 0.866 | 0.656 | 0.934 | 1.929 | 1.690 | 2.294 | 1.289 | 1.156 | 1.494 |
| 50 | 2.018 | 1.635 | 2.330 | 5.076 | 4.285 | 6.291 | 3.534 | 2.997 | 4.368 | |
| 75 | 3.985 | 3.309 | 4.717 | 10.455 | 8.721 | 13.123 | 7.370 | 6.144 | 9.281 | |
| Simple linear | 25 | 0.854 | 0.646 | 1.147 | 1.803 | 1.389 | 2.434 | 1.240 | 0.918 | 1.739 |
| 50 | 1.678 | 1.351 | 2.138 | 3.942 | 3.159 | 5.137 | 2.835 | 2.230 | 3.772 | |
| 75 | 2.503 | 2.056 | 3.130 | 6.080 | 4.928 | 7.840 | 4.430 | 3.542 | 5.805 | |
PD = Percentage of decomposition; LL = Lower Limit: UL = Upper Limit. Both limits with a 95 % confidence interval.
The values of the decomposition constant (k) of the Simple linear model ranged from -0.116 (pine-oak ecosystem) to -0.303 (oak ecosystem) (Table 2). Estimates of the time required to degrade mulch 25, 50, and 75 % ranged from 0.854 (oak ecosystem) to 6.080 years (pine ecosystem) (Table 3). These results indicate, in general, that the estimation of mulch decomposition is higher with the Olson model than when using the Simple linear model, as the average decomposition times are longer. It should be noted that the decomposition times of mulch at 25, 50, and 75 % in both models should be considered with reservations, since the environmental conditions ―biotic, abiotic, and chemical― do not remain constant.
In this sense, Tresch et al. (2019) point out that the process is influenced by the environmental conditions of each site, which modify the decomposition rates; Correa-Araneda et al. (2020) refer to the fact that the environmental conditions prevailing at specific time intervals control decomposition through various direct and indirect processes that are rarely constant, for example, Bölscher et al. (2020) mention that high temperatures and precipitation facilitate soil acidification, which probably increases the presence of decomposing agents, and therefore microbial activities, which can be altered by extraordinary climatic phenomena, and, consequently, decomposition rates are modified.
Figure 3 illustrates the dispersion of the data (observed and predicted) of the remaining mulch fraction considering the Exponential model and the Simple linear model during the study period in the three temperate forest ecosystems.
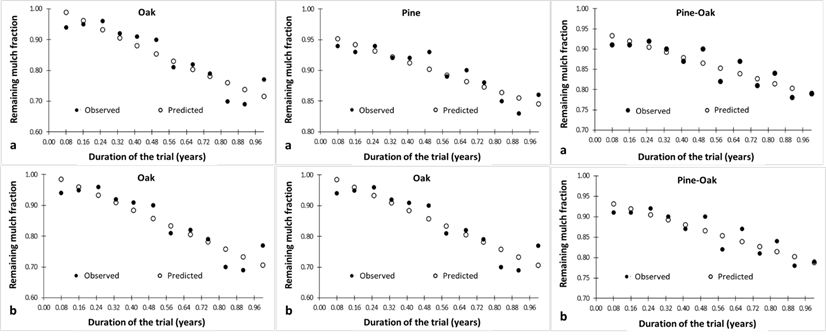
a = Predicted values obtained with reference to the Exponential model for each ecosystem under study; b= Predicted values obtained by reference to the Simple linear model for each ecosystem under study.
Figure 3 Observed and predicted values of mulch decomposition during the time (year) of the trial in each ecosystem.
The values of k in comparison with those obtained for other ecosystems seem low. Rocha-Loredo and Ramírez-Marcial (2009) recorded in pine-oak, pine, and oak forests a k constant of 1.40, 1.44 and 1.74, respectively, while Rivera et al. (2013) estimated that the time required to degrade 50 and 99 % of the mulch in low deciduous forest is 75.9 and 504.3 days, respectively. Tapia-Coronado et al. (2022) documented that the decomposition rate for forest species is more accelerated than that of grasses, with k values of 1.77, which allows inferring that the decomposition rate of mulch is influenced by the composition of plant species and their distribution (Peña-Peña and Irmler, 2016; Djukic et al., 2018). The present study did not consider the chemical analysis of the mulch components, therefore, it is possible to assume that the differences in the values of the Decomposition constant (k) between the ecosystems studied depend directly on the species composition and the successional stage of the ecosystems, as indicated by Rocha-Loredo and Ramírez-Marcial (2009). On the other hand, the nutritional and structural components of the mulch are factors that act directly on decomposition rates and account for their differences, although these are not usually studied (Berg and McClaugherty, 2020).
Conclusions
The decomposition process of mulch in the three ecosystems was different during the experimental period. The pine ecosystem has the lowest percentage (14 %) of decomposition, compared to oak (23 %) and pine-oak (22 %), which suggests that the quality of the organic material has a direct relationship with the decomposition process. In the oak ecosystem, more accelerated decomposition implies a more rapid release of nutrients and, consequently, better quality. In addition, species composition plays a fundamental role, although the chemical composition of the litter and the environmental factors are the main regulators of the decomposition rate. Species distribution and composition are factors influencing the supply of organic material.
Given the conditions of the ecosystems studied, the best-fitting models for predicting mulch decomposition are the exponential and simple linear models.
As for the estimated decomposition rate for the three ecosystems, the time required shows a difference for all decomposition rates, according to the reference models. Based on the Exponential model, the oak ecosystem requires the least time (0.866 years), followed by pine-oak (1.156 years) and pine (1.929 years), these results are due, in part, to the chemical composition of the recalcitrant material. With respect to the decomposition rates estimated with the Simple linear model, the pine ecosystem requires more time due to the presence of chemical substances in the pine needles.
Acknowledgments
The authors would like to thank the Consejo Nacional de Humanidades, Ciencia y Tecnología (Conahcyt) for the funding granted through the Sectoral Fund for Research for Education of Mexico (Fondo Sectorial de Investigación para la Educación), for projects A1-S-44878 and 250732, from which the present research is derived, and for the support granted to the first author for pursuing his doctoral studies. They are also grateful for the invaluable support provided by CLT Elsa Dolores González Serna.
REFERENCES
Arellano, R., J. Paolini, L. Vazquez y E. Mora. 2004. Producción y descomposición de hojarasca en tres agroecosistemas de café en el estado Trujillo, Venezuela. Revista Forestal Venezolana 48(1):7-14. http://www.saber.ula.ve/bitstream/handle/123456789/24308/articulo1.pdf?sequence=2&isAllowed=y . (6 de febrero de 2023). [ Links ]
Avendaño-Yáñez, M. L., S. Quiroz-Martínez, S. Pérez-Elizalde and S. López-Ortiz. 2020. Litterfall from tropical dry forest trees scattered in pastures. Revista Chapingo Serie Ciencias Forestales y del Ambiente 26(3):409-418. Doi: 10.5154/r.rchscfa.2019.12.092. [ Links ]
Bangroo, S. A., G. R. Najar and A. Rasool. 2017. Effect of altitude and aspect on soil organic carbon and nitrogen stocks in the Himalayan Mawer Forest Range. Catena 158:63-68. Doi: 10.1016/j.catena.2017.06.017. [ Links ]
Berg, B. and C. McClaugherty. 2020. Plant Litter: Decomposition, humus formation, carbon sequestration. Springer Nature. Cham, ZG, Switzerland. 332 p. [ Links ]
Bocock, K. L. and O. J. W. Gilbert. 1957. The disappearance of leaf litter under different woodland conditions. Plant and Soil 9:179-185. Doi: 10.1007/BF01398924. [ Links ]
Bohara, M., R. K. P. Yadav, W. Dong, J. Cao and C. Hu. 2019. Nutrient and isotopic dynamics of litter decomposition from different land uses in naturally restoring Taihang Mountain, North China. Sustainability 11(6):1752. Doi: 10.3390/su11061752. [ Links ]
Bölscher, T., G. I. Ågren and A. M. Herrmann. 2020. Land-use alters the temperature response of microbial carbon-use efficiency in soils -a consumption-based approach. Soil Biology and Biochemistry 140:107639. Doi: 10.1016/j.soilbio.2019.107639. [ Links ]
Bruno-Eutimio, D. I., M. de la L. Avendaño-Yáñez, Y. Perroni, J. Salinas-Ruíz, M. de la C. Vargas-Mendoza y S. López-Ortiz . 2022. Descomposición y liberación de nutrientes de la hojarasca de árboles en pastizales. Ecosistemas y Recursos Agropecuarios 9(3):e3205. Doi: 10.19136/era.a9n3.3205. [ Links ]
Burghouts, T. B. A., N. M. Van Straalen and L. A. Bruijnzeel. 1998. Spatial heterogeneity of element and litter turnover in a Bornean rain forest. Journal of Tropical Ecology 14(4):477-506. Doi: 10.1017/S0266467498000352. [ Links ]
Castellanos B., J. y J. D. León P. 2010. Caída de hojarasca y dinámica de nutrientes en plantaciones de Acacia mangium (mimosaceae) de Antioquia, Colombia. Acta Biológica Colombiana 15(2):289-308. http://www.scielo.org.co/scielo.php?script=sci_arttext&pid=S0120-548X2010000200020 . (14 de febrero de 2023). [ Links ]
Cornelissen, J. H. C. 1996. An experimental comparison of leaf decomposition rates in a wide range of temperate plant species and types. Journal of Ecology 84(4):573-582. Doi: 10.2307/2261479. [ Links ]
Correa-Araneda, F., A. M. Tonin, J. Pérez, K. Álvarez, … and L. Boyero. 2020. Extreme climate events can slow down litter breakdown in streams. Aquatic Sciences 82(2):1-7. Doi: 10.1007/s00027-020-0701-9. [ Links ]
Crespo, G. 2015. Factors influencing on nutrient recycling in permanent grasslands and development of their modeling. Cuban Journal of Agricultural Science 49(1):1-10. http://scielo.sld.cu/pdf/cjas/v49n1/cjas01115.pdf . (4 de febrero de 2023). [ Links ]
Del Valle-Arango, J. I. 2003. Descomposición de la hojarasca fina en bosques pantanosos del Pacífico Colombiano. Interciencia 28(3):148-153. http://ve.scielo.org/scielo.php?pid=S0378-18442003000300006&script=sci_abstract . (31 de enero de 2023). [ Links ]
Djukic, I., S. Kapfer-Rojas, I. Kappel S., K. Steenberg L., … and K. Verheyen. 2018. Early stage litter decomposition across biomes. Science of the Total Environment 628-629:1369-1394. Doi: 10.1016/j.scitotenv.2018.01.012. [ Links ]
Edwards, P. J. 1977. Studies of mineral cycling in a montane rain forest in New Guinea: II. The Production and Disappearance of Litter. Journal of Ecology 65(3):971-992. Doi: 10.2307/2259388. [ Links ]
Gama-Rodrigues, A. C., N. F. Barros e M. L. Santos. 2003. Decomposição e liberação de nutrientes do folhedo de espécies florestais nativas em plantios puros e mistos no sudeste da Bahia. Revista Brasileira de Ciência Do Solo 27(6):1021-1031. Doi: 10.1590/S0100-06832003000600006. [ Links ]
García, E. 2004. Modificaciones al sistema de clasificación climática de Köppen para adaptarlo a las condiciones de la República Mexicana. Instituto de Geografía de la Universidad Nacional Autónoma de México. Coyoacán, México D. F., México. 98 p. [ Links ]
Gaspar-Santos, E. S., M. González-Espinosa, N. Ramírez-Marcial y J. D. Álvarez-Solis. 2015. Acumulación y descomposición de hojarasca en bosques secundarios del sur de la Sierra Madre de Chiapas, México. Bosque 36(3):467-480. Doi: 10.4067/S0717-92002015000300013. [ Links ]
Gholz, H. L., D. A. Wedin, S. M. Smitherman, M. E. Harmon and W. J. Parton. 2000. Long-term dynamics of pine and hardwood litter in contrasting environments: toward a global model of decomposition. Global Change Biology 6(7):751-765. Doi: 10.1046/j.1365-2486.2000.00349.x. [ Links ]
Horodecki, P. and A. M. Jagodziński. 2019. Site type effect on litter decomposition rates: A three-year comparison of decomposition process between spoil heap and forest sites. Forests 10(4):353. Doi: 10.3390/f10040353. [ Links ]
Ibarra, M., J. Caldentey y A. Promis. 2011. Descomposición de hojarasca en rodales de Nothofagus pumilio de la región de Magallanes. Bosque 32(3):227-233. Doi: 10.4067/S0717-92002011000300004. [ Links ]
International Business Machines (IBM). 2016. Statistical Package for the Social Sciences (SPSS) V22.0. IBM Inc. Chicago, IL, United States of America. [ Links ]
Liu, C., B. Berg, W. Kutsch, C. J. Westman, … and X. Chen. 2006. Leaf litter nitrogen concentration as related to climatic factors in Eurasian forests. Global Ecology and Biogeography 15(5):438-444. Doi: 10.1111/j.1466-822X.2006.00251.x. [ Links ]
Liu, C. , C. J. Westman , B. Berg , W. Kutsch , … and H. Ilvesniemi. 2004. Variation in litterfall-climate relationships between coniferous and broadleaf forests in Eurasia. Global Ecology and Biogeography 13(2):105-114. Doi: 10.1111/j.1466-882X.2004.00072.x. [ Links ]
López-Hernández, J. M., J. J. Corral-Rivas, H. González-Rodríguez, T. G. Domínguez-Gómez, M. V. Gómez-Meza e I. Cantú-Silva. 2018. Depósito y descomposición de hojarasca de Pinus cooperi C. E. Blanco en El Salto, Durango, México. Revista Mexicana de Ciencias Forestales 9(50):201-222. Doi: 10.29298/rmcf.v9i50.249. [ Links ]
Martínez-Atencia, J., J. C. Loaiza-Usuga, N. W. Osorio-Vega, G. Correa-Londoño and María Casamitjana-Causa. 2020. Leaf litter decomposition in diverse silvopastoral systems in a neotropical environment. Journal of Sustainable Forestry 39(7):710-729. Doi: 10.1080/10549811.2020.1723112. [ Links ]
Moreno V., M. E., T. G. Domínguez G., M. del S. Alvarado, J. G. Colín, S. Corral R. and H. González R. 2018. Contribution and decomposition of leaf litter in temperate forests of the El Salto region, Durango. Revista Mexicana de Ciencias Forestales 9(47):70-85. Doi: 10.29298/rmcf.v9i47.180. [ Links ]
Oliveira R, I., C. de Paula R., J. Marques P., R. de Oliveira M., … and R. M. Boddey. 2019. Deposition and decomposition of litter in periods of grazing and rest of a tropical pasture under rotational grazing. Ciência Rural 49(12):e20190266. Doi: 10.1590/0103-8478cr20190266. [ Links ]
Olson, J. S. 1963. Energy storage and the balance of producers and decomposers in ecological systems. Ecology 44(2):322-331. Doi: 10.2307/1932179. [ Links ]
Ott, L. 2001. An introduction to statistical methods and data analysis. Duxbury Press. Pacific Grove, CA, United States of America. 1152 p. [ Links ]
Pando-Moreno, M., D. Mendoza-Aguilar, G. Cuéllar-Rodríguez y E. Jurado. 2018. Descomposición de la hojarasca del Matorral Espinoso Tamaulipeco y de una especie vegetal introducida. Revista Mexicana de Ciencias Forestales 9(50):174-200. Doi: 10.29298/rmcf.v9i50.235. [ Links ]
Peña-Peña, K. and U. Irmler. 2016. Moisture seasonality, soil fauna, litter quality and land use as drivers of decomposition in Cerrado soils in SE-Mato Grosso, Brazil. Applied Soil Ecology 107:124-133. Doi: 10.1016/j.apsoil.2016.05.007. [ Links ]
Pérez-Vázquez, Z. R., G. Ángeles-Pérez, B. Chávez-Vergara, J. R. Valdez-Lazalde y M. E. Ramírez-Guzmán. 2021. Enfoque espacial para modelación de carbono en el mantillo de bosques bajo manejo forestal maderable. Madera y Bosques 27(1):e2712122. Doi: 10.21829/myb.2021.2712122. [ Links ]
Pinos, J., A. Studholme, A. Carabajo and C. Gracia. 2017. Leaf litterfall and decomposition of Polylepis reticulata in the treeline of the Ecuadorian Andes. Mountain Research and Development 37(1):87-96. Doi: 10.1659/MRD-JOURNAL-D-16-00004.1. [ Links ]
Prescott, C. E. 2005. Do rates of litter decomposition tell us anything we really need to know? Forest Ecology and Management 220(1-3):66-74. Doi: 10.1016/j.foreco.2005.08.005. [ Links ]
Reed, S. C., A. R. Townsend, E. A. Davidson and C. C. Cleveland. 2012. Stoichiometric patterns in foliar nutrient resorption across multiple scales. New Phytologist 196(1):173-180. Doi: 10.1111/j.1469-8137.2012.04249.x. [ Links ]
Rivera V., R., L. Soto P., C. A. Núñez C., B. De Jung, M. G. Hernández R. y J. A. B. Ordóñez D. 2013. Producción y tasa de descomposición de hojarasca en Acahuales de selva caducifolia en Chiapas. Revista Mexicana de Ciencias Forestales 4(20):20-31. Doi: 10.29298/rmcf.v4i20.367. [ Links ]
Rocha-Loredo, A. G. y N. Ramírez-Marcial. 2009. Producción y descomposición de hojarasca en diferentes condiciones sucesionales del bosque de pino-encino en Chiapas, México. Boletín de la Sociedad Botánica de México 84:1-12. http://www.scielo.org.mx/scielo.php?script=sci_arttext&pid=S0366-21282009000100001&lng=es&tlng=es . (17 de febrero de 2023). [ Links ]
Rodríguez B., P. C., H. González R., I. Cantú S., M. Pando M., … y J. Lazcano C. 2019. Modelos de degradación de la hojarasca en bosques de encino y de pino en Nuevo León. Revista Mexicana de Ciencias Forestales 10(55):39-55. Doi: 10.29298/rmcf.v10i55.548. [ Links ]
Sayer, E. J., C. Rodtassana, M. Sheldrake, L. M. Bréchet, … and E. V. J. Tanner. 2020. Revisiting nutrient cycling by litterfall-Insights from 15 years of litter manipulation in old-growth lowland tropical forest. In: Dumbrell, A. J., E. C. Turner and T. M. Fayle (Edits.). Advances in Ecological Research 62. Elsevier Ltd. London, LND, United Kingdom. pp. 173-223. [ Links ]
Soong, J. L., W. J. Parton , F. Calderon, E. E. Campbell and M. F. Cotrufo. 2015. A new conceptual model on the fate and controls of fresh and pyrolized plant litter decomposition. Biogeochemistry 124(1-3):27-44. Doi: 10.1007/s10533-015-0079-2. [ Links ]
Steel, R. G. D. and J. H. Torrie. 1980. Principles and procedures of statistics. A biometrical approach. McGraw-Hill. New York, NY, United States of America. 633 p. [ Links ]
Swift, M. J., A. Russell-Smith and T. J. Perfect. 1981. Decomposition and mineral-nutrient dynamics of plant litter in a regenerating bush-fallow in the sub-humid tropics Nigeria. Journal of Ecology 69(3):981-995. Doi: 10.2307/2259649. [ Links ]
Tapia, J. y J. Návar. 2011. Ajuste de modelos de volumen y funciones de ahusamiento para Pinus pseudostrobus Lindl. en bosques de pino de la Sierra Madre Oriental de Nuevo León, México. Foresta Veracruzana 13(2):19-28. https://www.redalyc.org/pdf/497/49721457004.pdf . (8 de julio de 2023). [ Links ]
Tapia-Coronado, J. J., J. L. Contreras, J. Martínez-Atencia, L. López y J. L. Rodríguez. 2022. Producción y descomposición de hojarasca de especies forestales en sistemas silvopastoriles, Valle del Sinú, Colombia. Agronomía Mesoamericana 34(1):49781. Doi: 10.15517/am.v34i1.49781. [ Links ]
Torres V., J. R., D. Infante-Mata, A. J. Sánchez, A. Espinoza-Tenorio and E. Barba. 2018. Degradación de hojarasca y aporte de nutrientes del manglar en la Laguna Mecoacán, Golfo de México. Revista de Biología Tropical 66(2):892-907. Doi: 10.15517/rbt.v66i2.33421. [ Links ]
Tresch, S., D. Frey, R. C. Le Bayon, A. Zanetta, … and M. Moretti. 2019. Litter decomposition driven by soil fauna, plant diversity and soil management in urban gardens. Science of the Total Environment 658:1614-1629. Doi: 10.1016/j.scitotenv.2018.12.235. [ Links ]
von Arx, G., M. Dobbertin and M. Rebetez. 2012. Spatio-temporal effects of forest canopy on understory microclimate in a long-term experiment in Switzerland. Agricultural and Forest Meteorology 166-167:144-155. Doi: 10.1016/j.agrformet.2012.07.018. [ Links ]
Weltzin, J. F., J. K. Keller, S. D. Bridgham, J. Pastor, P. B. Allen and J. Chen. 2005. Litter controls plant community composition in a northern fen. Oikos 110(3):537-546. Doi: 10.1111/j.0030-1299.2005.13718.x. [ Links ]
Xuluc-Tolosa, F. J., H. F. M. Vester, N. Ramírez-Marcial, J. Castellanos-Albores and D. Lawrence. 2003. Leaf litter decomposition of tree species in three successional phases of tropical dry secondary forest in Campeche, Mexico. Forest Ecology and Management 174(1-3):401-412. Doi: 10.1016/S0378-1127(02)00059-2. [ Links ]
Zhang, D., D. Hui, Y. Luo. and G. Zhou. 2008. Rates of litter decomposition in terrestrial ecosystems: global patterns and controlling factors. Journal of Plant Ecology 1(2):85-93. Doi: 10.1093/jpe/rtn002. [ Links ]
Received: February 27, 2023; Accepted: August 11, 2023
 Este es un artículo publicado en acceso abierto bajo una licencia
Creative Commons
Este es un artículo publicado en acceso abierto bajo una licencia
Creative Commons
