


Services on Demand
Journal
Article
 text in
  English (pdf)
 Article in xml format
 Article references
 Send this article by e-mail
Indicators
-
 Cited by SciELO
 -
 Access statistics
Related links
-
 Similars in
SciELO
Similars in
SciELO
Share

 Permalink
Revista mexicana de ciencias forestales
Print version ISSN 2007-1132
Rev. mex. de cienc. forestales vol.14 n.78 México Jul./Aug. 2023 Epub Sep 14, 2023
https://doi.org/10.29298/rmcf.v14i78.1336
Scientific article
Morphic coefficient of Apuleia leiocarpa (Vogel) J.F. Macbr. according to forest type, Peruvian Amazon
1Departamento Académico de Ingeniería Forestal y Medio Ambiente, Universidad Nacional Amazónica de Madre de Dios. Perú.
2Escuela Profesional de Ingeniería Forestal y Medio Ambiente, Universidad Nacional Amazónica de Madre de Dios. Perú.
The objective of the study was to determine and compare the morphic coefficient (MC) and allometric models in order to estimate the forest volume of Apuleia leiocarpa in two forest types in the Madre de Dios region of the Peruvian Amazonia. A sample size of 42 felled A. leiocarpa trees was used: 22 in low-hill forest, and 20 in low-terrace forest. The diameter at breast height (DBH) and the stem height of each individual were measured, and diameter measurements were taken along the stem every 2 m. The morphic coefficient was determined by forest type, and 11 nonlinear models were assessed for determining the merchantable forest volume. The MC in the low-ill forest is significantly higher than that calculated in the low-terrace forest (t-Student, p<0.01). The ANCOVA showed that the MC varied significantly between the two forest types. The DBH did not exert a significant influence on the MC (p>0.05); however, the interaction between the forest type and the DBH was significant (p<0.05). The best allometric model for estimating the merchantable forest volume was Takata's model for the low-hill forest, while Spurr's model with independent term was the best for the low-terrace forest.
Key words Allometry; Amazonia; volume equations; shape factor; regression; timber volume
El objetivo del estudio fue determinar y comparar el coeficiente mórfico (CM) y modelos alométricos para estimar volumen fustal de Apuleia leiocarpa en dos tipos de bosque en la Amazonía de Madre de Dios, Perú. Se utilizó un tamaño de muestra de 42 árboles talados de A. leiocarpa: 22 en bosques de colina baja y 20 en bosque de terraza baja. De cada individuo se midió su diámetro a la altura del pecho (DAP) y la altura del fuste, y se realizaron mediciones de diámetro a lo largo del fuste cada 2 m. Por tipo de bosque se determinó el coeficiente mórfico y se evaluaron 11 modelos no lineales para el volumen fustal comercial. El CM en el bosque de colina baja es significativamente superior al calculado en el bosque de terraza baja (t-Student, p<0.01). El ANCOVA mostró que el CM varía significativamente entre los dos tipos bosque. El DAP no influyó de forma significativa en el CM (p>0.05), aunque sí la interacción entre bosque × DAP (p<0.05). El mejor modelo alométrico para estimar el volumen varía según el tipo de bosque, en el bosque de colina baja fue el modelo de Takata y en el bosque de terraza baja fue el modelo de Spurr con término independiente.
Palabras clave Alometría; Amazonía; ecuaciones de volumen; factor de forma; regresión; volumen maderable
Introduction
The tropical forests of the Amazonia are the most complex ecosystems on the planet because they support the greatest biodiversity and productivity in the world (Bowman et al., 2022). These forests provide important services for the maintenance of ecosystems and the economic and social development of Peru, such as the forestry industry (Tito, 2022). With the increasing demand for timber, one of the ways to ensure sustainable forest management is the use of allometric models for timber volume estimation (Fan et al., 2020; Zhang et al., 2020).
Peru ranks ninth in the world in terms of forest area with 73.3 million hectares of tropical forests (Rojas et al., 2020). Of the total Peruvian tropical forests, 10 % are considered timber-harvesting concessions (Minam, 2015). The Madre de Dios region is recognized as the biodiversity capital of Peru (Fuentes et al., 2022) and is the second region in the country (85 301 km2) with the highest roundwood production (>300 000 m3 año-1) (Pacheco et al., 2016).
Apuleia leiocarpa (Vogel) J. F. Macbr. (ana caspi) is one of the most intensively harvested species with the highest volume extracted (4 300 m3 year-1) (Pacheco et al., 2016), due to the high density of its wood (0.70 g cm-3) and the high extractive value; therefore, a correct and precise evaluation of the calculation of its volume, at individual tree level, would allow its sustainable use (García et al., 2016).
The morphic coefficient (MC) is a factor of reduction of a reference solid to the actual shape of an aggregate (Ikonen et al., 2006); the cylindrical shape is the most commonly used (Tlaxcala-Méndez et al., 2016). It is obtained by dividing the real volume of the stem by the volume of a conventional geometric body with the same diameter and height as the normal section of a tree (Furlan et al., 2010). The MC has been used for several decades in many Latin American countries dedicated to timber forestry in the absence of specific volume models for harvested species (Costa et al., 2016; Fan et al., 2020).
Accurate estimation of the commercial volume of standing trees is essential for sustainable forest management (Tamarit et al., 2014; Mendes et al., 2020; Zhang et al., 2020). The MC of trees is considered an important alternative for volume estimation (Colgan et al., 2014; García et al., 2016) because the DBH, the merchantable height, and the MC of the species are used to determine it in standing trees (García et al., 2016).
In Peru, general allometric models are currently used to estimate timber volume, in which a single MC is used for all species (Malata et al., 2017). For tropical taxa, an MC or form factor of 0.75 is applied (Guzmán-Santiago et al., 2020). The Peruvian national forest authority establishes an MC of 0.65 (Del Mar, 2021); however, having a general MC for all species could overestimate or underestimate the timber volume (Azevêdo et al., 2014).
Another way of estimating the merchantable volume is by means of specific allometric models (Malata et al., 2017). Allometric equations derived from linear or nonlinear regression models allow estimation of the stem volume based on diameter and height measurements (Gúzman-Santiago et al., 2020; Zhang et al., 2020). Previous studies have shown that nonlinear equations can better describe volume trends; therefore, they are more effective than linear models (Gúzman-Santiago et al., 2020). The Spurr, Schumacher-Hall and Husch models are the most widely used in Amazonia (Costa et al., 2016; Mendes et al., 2020; Souza et al., 2021). However, due to the high diversity of ecosystems and species in Amazonian forests, it is necessary to develop taxon-specific allometric models that include different site conditions (Aguilar et al., 2017; Miranda et al., 2021).
On the other hand, bark thickness is a fundamental variable in forestry measurements (Reis et al., 2020). During timber forest management, it is important to estimate the merchantable volume without the bark (Berrill et al., 2020); therefore, determining the bark thickness is relevant for accurate estimation of the volume without the bark. Meanwhile, estimates of the sapwood and heartwood of trees are important both in the timber industry and for dynamic vegetation models because they determine the biomechanical stability, as well as the nutrient and water transport (Aye et al., 2022). In this regard, studies on the formation of heartwood and its proportions along the stem are still scarce, which is why there is little solid information for the development of silvicultural practices, especially since heartwood is the most valuable part of tropical species, as it has a determining influence on the price of wood (Meupong et al., 2021).
Moreover, for the estimation of the merchantable volume, it is vital to consider that species have different growth response to different site conditions (Molina-Valero et al., 2019; Mendes et al., 2020), yet another factor that influences the variation of the MC. Within this context, the present study aimed to determine and compare both the MC and 11 allometric models for calculating the tree crown volume of A. leiocarpa in two forest types in the Madre de Dios region of the Peruvian Amazonia. Furthermore, differences in the variables height, DBH, stem volume, sapwood thickness, heartwood thickness, and bark thickness were assessed and compared between the two forest types, and the influence of forest type on the MC was analyzed.
Materials and Methods
Study area
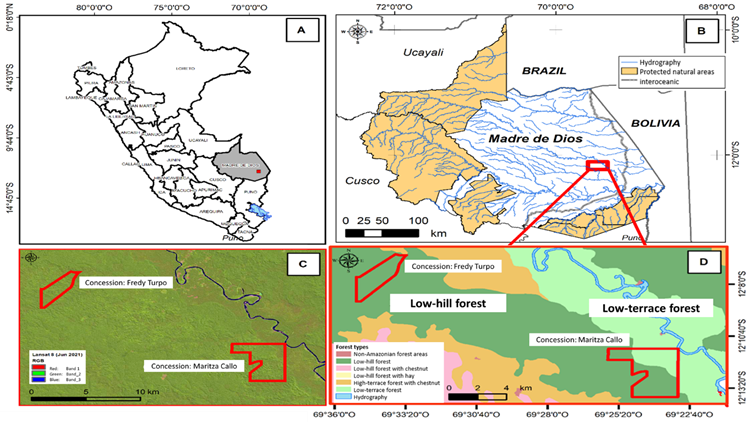
The research was conducted in two forest concessions for the management and harvesting of products other than timber (Brazil nut collection), located in the Tambopata district, Tambopata province, Madre de Dios region, Peru. Based on the National Land Cover Map of the Peruvian Ministry of Environment (Minam, 2015), a low-hill forest (12°6'31.16" S and 69°33'17.96" W) and a low-terrace forest (12°11'18.85" S and 69°23'5.94" W) were identified in the study area. The two concessions were Fredy Turpo’s and Maritza Callo’s; the former has an area of 634 ha and is located in a low-hill forest; of the latter concession, only the part of the low-terrace forest was considered, with an area of 550 ha (Figure 1).
Data collection
A sample of 42 A. leiocarpa trees of the following species was collected: 22 in low-hill forest, and 20 in low-terrace forest. Only trees with a diameter at breast height (DBH) above 41 cm were included; this length is equivalent to the minimum cutting diameter established in the Peruvian forest regulations for merchantable timber harvesting (Del Mar, 2021); therefore, only information from merchantable specimens was analyzed. Each individual was felled, and the length of the stem (height of the stem) was measured with a model Pro-FMHT33100-0 Stanley FatMax® flexometer, the diameter, with a Haglöf® (Mantax Blue) caliper every 2 m along the stem (Aguilar et al., 2017), without sectioning it into logs. At the base of the stem, two bark measurements were taken with the flexometer; the thickness of sapwood and heartwood was also recorded in centimeters to calculate the percentage of sapwood and heartwood, whose reference was the diameter of the stem. The volume of each section was estimated with the Smalian equation (Guzmán-Santiago et al., 2020; Souza et al., 2021), the volume of the forest was obtained from the sum of all the sections.
Data analysis
Based on the shape of the stem of A. leiocarpa observed in the field, the cylinder was used to calculate the morphic coefficient (Guzmán-Santiago et al., 2020); for this purpose, the following expression was used:
Where:
MC = Morphic coefficient
V R = Real stem volume
V = Volume of cylinder solid with base area equal to the base area of the tree and equal in height.
Differences in height, DBH, stem volume, sapwood thickness, heartwood thickness and bark thickness between forest types were evaluated using the two-tailed t-Student test when the parametric assumptions (normality and homoscedasticity) were met, and the Mann-Whitney test when not (Berger et al., 2018); a significance level of 5 % was used in both cases. On the other hand, the t-Student test was applied to a sample in order to compare the estimated MC values with respect to the MC established by the Peruvian national authority and to the one cited in previous research (Del Mar, 2021; Lozano and Bonilla 2022) for cylindrical Dipteryx odorata (Aubl.) Forsyth f. stems, whose shape is similar to that of A. leiocarpa stems (Lozano and Bonilla, 2022).
For the purpose of analyzing the relationship between DBH, height, bark thickness, thickness of the sapwood and the heartwood, and sapwood/heartwood ratio, a correlation analysis was carried out for each forest type; these were represented in a correlation matrix using Pearson’s and Spearman’s (non-parametric) correlation coefficients. Simple linear regression models were fitted to the variables that were significantly correlated. An analysis of covariance (ANCOVA) was also applied to analyze the influence of the forest type on the MC, in which the DBH was the covariate, as well as the forest type-diameter interaction.
11 nonlinear allometric models were assessed for volume estimation (Table 1), considering the volume functions suggested by Guzmán-Santiago et al. (2020), Ogana et al. (2020) y Reis et al. (2020).
Table 1 Nonlinear allometric models adjusted to estimate the volume of Apuleia leiocarpa (Vogel) J. F. Macbr. stems.
| Expression of the model | Name | Label |
|---|---|---|
|
|
Schumacher-Hall | M1 |
|
|
Spurr | M2 |
|
|
Spurr potential | M3 |
|
|
Spurr with independent term | M4 |
|
|
Composite variable | M5 |
|
|
Honer | M6 |
|
|
Takata | M7 |
|
|
Stoate | M8 |
|
|
Ogaya | M9 |
|
|
Näslund | M10 |
|
|
Meyer | M11 |
V s = Volume of the stem; DBH = Diameter at breast height (cm); H = Height of the stem (m); β i = Coefficients of the model; ε = Error of the model.
The following fit statistics criteria were used to discriminate between the best nonlinear models: root mean square error (RMSE), mean square error (MSE), Akaike information criterion (AIC), and Bayesian information criterion (BIC) (Ogana et al., 2020; Reis et al., 2020). The best models were selected using the model ranking method (Tamarit et al., 2014; Ogana et al., 2020), in which values from 1 to 11 were assigned to each model by fit statistic, in descending order, with 1 being the lowest and best value. For the final rating, all the values obtained were added together, and the model with the lowest value was considered the best (Ogana et al., 2020; Reis et al., 2020).
All analyses and figures were performed with the R v4.2.2.2 statistical software in the environment of R-Studio v12 (R Core Team, 2022), InfoStat (InfoStat, 2022), and SigmaPlot v14 (Inpixon, 2022). In R, the packages ggplot2, AICcmodavg, HH, and PerformanceAnalytics were used.
Results and Discussion
The descriptive statistics of the variables corresponding to the sample of trees analyzed by concession are presented in Table 2; significant differences are also shown when applying the Student's t-test and the Mann-Whitney test.
Table 2 Descriptive statistics of the variables measured in Apuleia leiocarpa (Vogel) J. F. Macbr. trees by forest type and Student’s t and Mann-Whitney tests for the average values.
| Variable | Forest type | Minimum | Maximum | Average | Median | SD | CV |
|---|---|---|---|---|---|---|---|
| Height of the stem (m)† | LHF | 8.15 | 21.17 | 14.97 b | 15.14 | 2.83 | 18.93 |
| LTF | 11.84 | 24.86 | 17.58 a | 18.60 | 2.95 | 16.81 | |
| DBH (cm)† | LHF | 56.00 | 151.00 | 86.55 a | 80.00 | 22.10 | 25.53 |
| LTF | 54.00 | 133.00 | 87.85 a | 85.00 | 20.36 | 23.17 | |
| Sapwood thickness (cm)‡ | LHF | 2.00 | 7.00 | 3.45 a | 3.00 | 1.22 | 35.43 |
| LTF | 2.00 | 6.00 | 3.85 a | 4.00 | 0.99 | 25.66 | |
| Sapwood proportion (%)† | LHF | 3.80 | 17.10 | 8.00 a | 7.90 | 3.13 | 39.13 |
| LTF | 5.00 | 16.70 | 9.22 a | 8.10 | 2.89 | 31.32 | |
| Heartwood thickness (cm)‡ | LHF | 26.00 | 77.00 | 41.59 a | 40.00 | 11.63 | 27.96 |
| LTF | 25.00 | 57.00 | 39.05 a | 38.00 | 8.00 | 20.49 | |
| Heartwood proportion (%)† | LHF | 82.90 | 96.30 | 92.01 a | 92.10 | 3.14 | 3.41 |
| LTF | 83.30 | 95.00 | 90.78 a | 91.90 | 2.89 | 3.18 | |
| Bark thickness (mm)† | LHF | 0.50 | 2.55 | 1.38 a | 1.51 | 0.50 | 35.89 |
| LTF | 0.70 | 2.20 | 1.28 a | 1.19 | 0.44 | 34.58 | |
| Volume of the stem (m3)‡ | LHF | 2.48 | 16.36 | 7.47 a | 6.09 | 3.82 | 51.12 |
| LTF | 3.59 | 16.88 | 7.76 a | 6.45 | 3.48 | 44.84 |
LHF = Low hill forest; LTF = Low-terrace forest; DBH = Diameter at breast height; SD = Standard deviation; CV = Coefficient of variation (%). Different letters show significant differences with the Student's t-test (†) and the Mann-Whitney test (‡).
Morphic coefficient by forest type
A. leiocarpa trees in the low-terrace forest had greater DBH, stem height, and sapwood thickness than in the low-hill forest. Although only the stem height was statistically significant (Student’s t, p<0.01). On the other hand, trees from the low-hill forest had a slightly greater bark and heartwood thickness than those from the low-terrace forest, although this difference was not statistically significant (Student’s t, p>0.05) (Table 2).
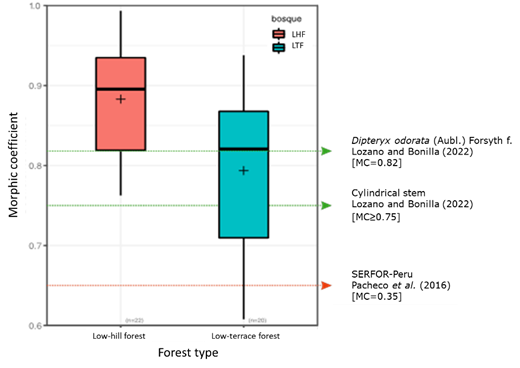
Trees in the low hill forest had a significantly higher MC, of 0.88±0.07 (Student’s t, p<0.01), than those in the low terrace forest, whose MC was 0.79±0.10, i.e., 11.4 % higher. In the low-hill forest, none of the tree variables analyzed were significantly correlated with the MC (Pearson, p>0.05). However, in the low-terrace forest, trees of smaller diameter showed a tendency to a higher MC because a significant, inverse relationship between MC and stem diameter was found (r=-0.47, p<0.05) (Figure 2).
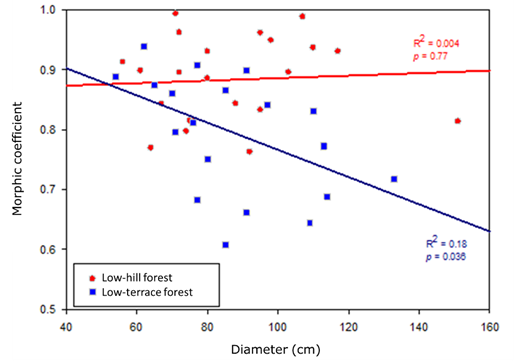
Figure 2 Scatter plot and simple linear regression line fitted to the model between tree diameter and morphic coefficient by forest type.
The ANCOVA showed that the MC varies significantly between the two forest types, which explains 22 % of the variability of the MC (p<0.001, Table 3). The DBH had no influence on the MC (p>0.05), unlike the interaction between the forest type and the diameter (p=0.046). This suggests that the relationship between the diameter and the MC varies according to the forest type, which is direct and non-significant in low-hill forest and inverse and significant in low-terrace forest (Table 3, Figure 2). The fitted regression model expressed as MC=0.993-0.00227×DAP was only significant for the low-terrace forest (R 2=0.18 y p<0.05).
Table 3 ANCOVA results: morphic coefficient as dependent variable, forest type as factor, and diameter at breast height (DBH) as covariate.
| Variable | Coefficients | Sum of squares | F | p |
|---|---|---|---|---|
| Intercept | 0.8649 | |||
| Forest type | 0.1283 | 0.084 | 12.99 | <0.001 |
| DBH | 0.0002 | 0.014 | 2.12 | 0.153 |
| Forest type×Diameter | -0.0025 | 0.027 | 4.26 | 0.046 |
The Student’ t test for one sample and p<0.01 showed that the MC averages obtained of 0.79 to 0.88, were significantly higher than the 0.65 established by the Peruvian forestry authority (Del Mar, 2021) (Figure 3), as well as to the average cited for species with cylindrical stems (Lozano and Bonilla, 2022). Compared to the MC of 0.82 registered for D. odorata ―a species with similar characteristics in terms of straight cylindrical stem and with a detachment of the bark in the form of irregular plates (Lozano and Bonilla, 2022)―, this value was found to be slightly higher than that determined in the low-terrace forest (p>0.05) and significantly lower than that estimated in the low-hill forest (p<0.01) (Figure 3). Aguilar et al. (2017) report that variations in stem characteristics in different species influence the MC; in the present study, the high MC values are due to the fact that A. leiocarpa has a straight, cylindrical, irregular stem with a low reduction in diameter along the length of the stem. In addition, the growth and shape of the stem is similar to D. odorata which also has a high MC.
Sapwood to heartwood ratio
Non-significant differences in sapwood and heartwood thickness or sapwood to heartwood ratio were observed based on the forest type (p<0.05, Table 4). Stem height and bark thickness did not correlate significantly with the thickness of sapwood and heartwood or with their proportions (p<0.05). However, the DBH was significantly correlated with the proportion of sapwood, with heartwood, and with the proportion of heartwood, although this varied according to the type of forest (Table 4).
Table 4 Correlation matrix between dasometric characteristics and the thickness and proportion of sapwood and heartwood of Apuleia leiocarpa (Vogel) J. F. Macbr. trees by forest type.
| Forest type | Height (m) | Diameter | Bark thickness (mm) | Sapwood (cm) | Sapwood ratio (%) | Heartwood (cm) |
|---|---|---|---|---|---|---|
| (a) Low-hill | ||||||
| Diameter | -0.14¥ | |||||
| Bark thickness (mm) | 0.11¥ | 0.00¥ | ||||
| Sapwood thickness (cm) | -0.13† | 0.25† | 0.08† | |||
| Sapwood proportion (%) | -0.06¥ | -0.40¥ | 0.09¥ | 0.78†* | ||
| Heartwood thickness (cm) | 0.04† | 0.93†* | -0.14† | 0.15† | -0.49†* | |
| Heartwood proportion (%) | 0.06¥ | 0.40¥ | -0.09¥ | -0.78† | -1.00¥* | 0.47†* |
| (b) Low-terrace | ||||||
| Diameter | -0.09¥ | |||||
| Bark thickness (mm) | -0.31¥ | 0.03¥ | ||||
| Sapwood thickness (cm) | -0.03† | -0.22† | -0.03† | |||
| Sapwood proportion (%) | 0.00¥ | -0.66¥* | 0.10¥ | 0.80†* | ||
| Heartwood thickness (cm) | -0.05¥ | 0.83¥* | -0.10¥ | 0.03† | -0.59¥* | |
| Heartwood ratio (%) | 0.00¥ | 0.66¥* | -0.10¥ | -0.80†* | -1.00¥* | 0.59¥* |
¥ = Pearson’s coefficient of correlation; † = Spearman’s coefficient of correlation. * = p<0.05.
In the low-hill forest, only a significant relationship between DBH and heartwood thickness was obtained (rho=0.93, p<0.05). Whereas, in the low-terrace forest, DBH was significantly correlated with the sapwood proportion (r=-0.66, p<0.05), the heartwood thickness (r= 0.83, p<0.05), and the proportion of heartwood (r=0.66, p<0.05). This has implications for the quality of the wood of A. leiocarpa according to the type of forest because, since there is a significant relationship between DBH and sapwood in the low-terrace forest, a greater thickness and a higher proportion of sapwood is expected there than in the low-hill forest (Aye et al., 2022).
Figure 4 shows the trend in both sapwood and heartwood thickness, as well as in the sapwood/heartwood ratio in relation to the DBH. It was determined that sapwood thickness is not related to DBH in any forest type; it was observed that heartwood thickness in both forest types increases as a function of the DBH, although the coefficient of determination is higher in the low-hill forest (R 2 =0.86) than in the low-terrace forest (R 2 =0.69). Likewise, the proportion of heartwood has a linear and direct relationship, while the proportion of sapwood has an inverse relationship. This is because the heartwood is directly related to the age and diameter of the trees, and its formation can be affected by exogenous and endogenous factors such as the density or number of trees (spacing), the crown diameter, and the content of extractive chemical compounds, among others (Kang et al., 2001; Piqueras et al., 2020).
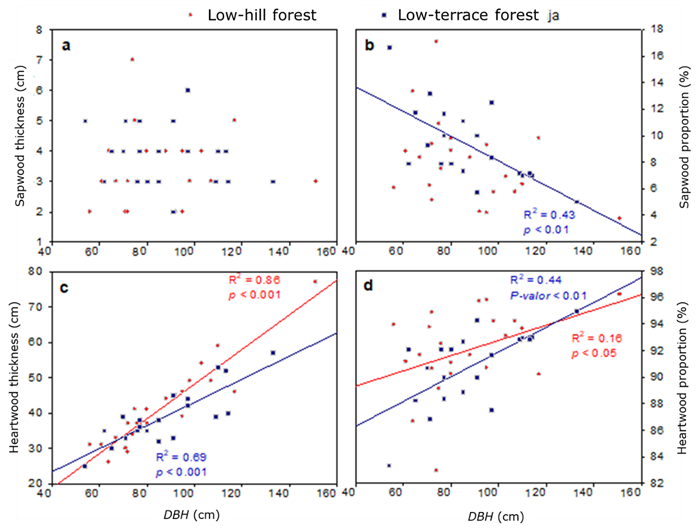
(a) = Between DBH with sapwood thickness; (b) = Between DBH with sapwood ratio; (c) = Between DBH with heartwood thickness; (d) = Between DBH with and heartwood ratio. P-valor <0.01 = P-value <0.01.
Figure 4 Scatterplot and trend by forest type.
Heartwood determines the economic value of the wood, and the sapwood is closely related to the physiological functions of the trees (Meunpong et al., 2021). Therefore, it will be important for forest harvesting to estimate heartwood thickness based on easily measured variables, such as the DBH (Yang et al., 2020). In the present study, heartwood thickness (HT) was found to be directly related to the DBH; therefore, the models generated could be used to estimate heartwood thickness. The linear model for estimating heartwood thickness in the low-hill forest was:
Where:
HT = Heartwood thickness
DBH = Diameter at breast height (m)
In the low-terrace forest, it was:
Where:
HT = Heartwood thickness
DBH = Diameter at breast height (m)
Forest volume estimation models
In both forest types, the 11 models fitted to estimate volume were significant (p<0.05) with low values for the root mean square error (of up to 0.88 in the low hill forest, and of up to <1.088 in the low-terrace forest). In the two forest types, the models that generated the lowest values of RMSE were Takata, Spurr, Spurr potential, and Spurr with independent term (Table 5).
Table 5 Fit, comparison, and ranking statistics of the fitted volume models for Apuleia leiocarpa (Vogel) J. F. Macbr. by forest type.
| Model | Coefficient | Fit statistics | Rating total | |||||||
|---|---|---|---|---|---|---|---|---|---|---|
| β 0 | β 1 | β 2 | β 3 | RMSE | MSE | AIC | BIC | |||
| (a) Low-hill forest | ||||||||||
| M1 | Schumacher-Hall | 0.835 | 1.897 | 0.916 | 0.858 | 0.855 | 63.763 | 68.127 | 6 | |
| M2 | Spurr | 0.665 | 0.879 | 0.81 | 60.785 | 62.967 | 2 | |||
| M3 | Spurr potential | 0.76 | 0.951 | 0.861 | 0.815 | 61.829 | 65.102 | 3 | ||
| M4 | Spurr with independent term | 0.255 | 0.647 | 0.872 | 0.837 | 62.41 | 65.683 | 4 | ||
| M5 | Generalized composite variable | 0.637 | -0.029 | 0.649 | 0.868 | 0.873 | 64.23 | 68.594 | 11 | |
| M6 | Honer | 0.001 | 1.483 | 0.88 | 0.851 | 62.774 | 66.047 | 7 | ||
| M7 | Takata | 1.366 | 0.129 | 0.857 | 0.808 | 61.636 | 64.909 | 1 | ||
| M8 | Stoate | 3 | -3.337 | 0.903 | -0.207 | 0.846 | 0.875 | 65.083 | 70.538 | 10 |
| M9 | Ogaya | -0.0028 | 0.665 | 0.88 | 0.851 | 62.785 | 66.058 | 8 | ||
| M10 | Näslund | -1.469 | 0.58 | 0.344 | -0.01 | 0.824 | 0.832 | 63.962 | 69.417 | 5 |
| M11 | Meyer | 0.835 | 0.066 | 0.916 | 0.858 | 0.855 | 63.763 | 68.127 | 9 | |
| (b) Low-terrace forest | ||||||||||
| M1 | Schumacher-Hall | 0.608 | 1.706 | 0.973 | 0.965 | 1.095 | 63.323 | 67.306 | 6 | |
| M2 | Spurr | 0.558 | 1.088 | 1.248 | 64.155 | 66.147 | 7 | |||
| M3 | Spurr potential | 0.826 | 0.865 | 0.975 | 1.057 | 61.763 | 64.75 | 3 | ||
| M4 | Spurr with independent term | 1.144 | 0.49 | 0.964 | 1.034 | 61.317 | 64.304 | 1 | ||
| M5 | Generalized composite variable | 0.563 | 0.039 | 0.485 | 0.958 | 1.081 | 63.063 | 67.046 | 4 | |
| M6 | Honer | -0.009 | 1.94 | 1.085 | 1.308 | 66.015 | 69.002 | 10 | ||
| M7 | Takata | 1.244 | 0.525 | 0.97 | 1.045 | 61.527 | 64.515 | 2 | ||
| M8 | Stoate | 0.358 | 0.258 | 0.47 | 0.051 | 0.958 | 1.148 | 65.061 | 70.04 | 9 |
| M9 | Ogaya | 0.584 | 0.524 | 1.086 | 1.309 | 66.041 | 69.028 | 11 | ||
| M10 | Näslund | 5.428 | 0.393 | -0.42 | 0.015 | 0.913 | 1.043 | 63.139 | 68.117 | 5 |
| M11 | Meyer | 0.608 | -0.24 | 0.973 | 0.965 | 1.095 | 63.323 | 67.306 | 8 | |
RMSE = Root of the mean square error; MSE = Mean square error; AIC = Akaike information criterion; BIC = Bayesian information criterion.
Based on the ranking of models, it was determined that the best model for estimating forest volume in the low-hill forest was the Takata model expressed in the following form:
Where:
V s = Volume of the stem
DBH = Diameter at breast height (cm)
This had the lowest total score (8 points), followed by the Spurr model (13 points) and the Spurr potential model (15 points). For the case of the low terrace forest, the best model was the Spurr model with independent term expressed as:
Where:
V s = Volume of the stem
DBH = Diameter at breast height (cm)
H = Height (m)
The same that presented the lowest value of the total rating (7 points), followed by Takata (14 points) and Spurr's potential model (18 points). These models exhibited the lowest values for RMSE, AIC, and BIC. The AIC and BIC criteria are widely used to select the simplest model with the greatest explanatory power in which balance is sought between the predictive capacity and the number of parameters it must have to achieve an optimal fit; these statistics reward the models as the explained variance increases but at the same time penalize them as the number of parameters increases (Nikita et al., 2022).
Several authors agree that the Schumacher-Hall function guarantees accurate estimates for several tropical species (Costa et al., 2016; García et al., 2016; Tlaxcala-Méndez et al., 2016; Guzmán-Santiago et al., 2020). However, for A. leiocarpa in the two forest types analyzed, the best models for estimating forest volume were Takata and Spurr with independent terms. However, the Schumacher-Hall equation at the evaluated sites was among the six best models, in agreement with the findings of several studies (Costa et al., 2016; Tlaxcala-Méndez et al., 2016; Guzmán-Santiago et al., 2020).
Research on specific allometric equations for volume of A. leiocarpa yielded similar results to that obtained in the present study. For example, Midsma (2001) in Argentina indicates that the model with the best fit was the Spurr model; in the study on the low-hill forest, it was the second best, while in the one on the low-terrace forest, the Spurr model with independent term was the best. However, Souza et al. (2021) determined that the Husch model was the best for the Brazilian Amazonia. These differences could be due to the fact that the study by Souza et al. (2021) used models with log-transformed variables and that the Guadua genus is predominant in the forests where they collected their information.
When comparing the RMSE and MSE values generated by the models in each forest type, they were found to be lower in the low-hill forest. These differences are due to the different site conditions to which A. leiocarpa trees are subjected. In particular, for the estimation of the merchantable volume, it is important to consider that the same species has a different growth response as the site’s conditions change (Molina-Valero et al., 2019; Mendes et al., 2020). This is reflected in the dimensions reached by the stems in each forest condition. For example, although the average DBH of A. leiocarpa stems was similar in both forests (86.55 cm in the low-hill forest, and 87.85 cm in the low-terrace forest), trees in the low-terrace forest had a higher canopy height than those in the low-hill forest. This difference is related to variations in physiography, in addition to the fact that low-hill forests are more irregular and tend to occur on steeper slopes, as opposed to low-terrace forests (Velioğlu et al., 2023), potentially affecting the availability of water, a key element for growth (Rachid-Casnati et al., 2019).
As for the comparison between the volume estimation carried out with the best allometric models and that obtained based on the shape factors by forest type, it was observed that, in the low-hill forest, the RMSE value calculated with the Takata equation, of 16.15, was lower by 16.6 % than the one estimated with the shape factor, of 19.37. While in the low-terrace forest the volume values estimated with the MC yielded an RMSE of 41.11, which is 54.7 % higher than the one obtained with the Spurr model with independent term, of 18.61. This analysis suggests that specific equations are better for calculating the volume of the stem than the use of the MC; furthermore, in order to minimize errors in estimating the volume of timber in each forest type, the variations in bark thickness and the thickness and proportion of sapwood and heartwood should be considered.
Among the limitations of this study, its results are restricted to only two forest conditions in the Madre de Dios region of Peru, affecting the generalizability of its application to other ecoregions. On the other hand, a small sample was analyzed in each forest condition due to a low density of individuals per unit area. In addition, we did not have information on a complete range of diameter categories or heights, because we only measured merchantable specimens of A. leiocarpa, for which forestry regulations of the Government of Peru have established a minimum cutting diameter of 41 cm for timber harvesting. These aspects, while restricting the applicability of the results, also provide insights for a deeper understanding of the form factor and promote the use of allometric models for volume estimation in the Peruvian Amazonia. In future studies, it is recommended to include more forest types in the analysis, to increase the sample size, and to use non-destructive methods in order to include individuals with DBH less than 40 cm.
Conclusions
The morphic coefficient of Apuleia leiocarpa trees growing in the Tambopata province, in the Madre de Dios region of Peru, is significantly higher in the low-hill forest (MC=0.88) than in the low-terrace forest (MC=0.79). There are no significant differences in the thickness and proportion of sapwood and heartwood between the two forest types. In the low-hill forest, there is a significant relationship only between heartwood diameter and heartwood thickness. Whereas, in the low-terrace forest, the diameter correlates significantly with the proportion of sapwood, the heartwood thickness, and the proportion of heartwood. The best allometric model for estimating the volume varies according to the forest type, in the low-hill forest it is Takata's model, and in the low-terrace forest, Spurr's model with independent term.
Acknowledgments
The authors wish to thank Fredy Turpo Cama and Maritza Callo Ccorca, owners of the evaluated concessions, for having facilitated the access for the development of this study.
REFERENCES
Aguilar R., C. A., A. F. Sequeira G. y E. J. Peralta T. 2017. Factor de forma para la Tectona grandis L.F, empresa MLR-Forestal, Siuna, Costa Caribe Norte de Nicaragua. Ciencia e Interculturalidad 21(2):74-84. Doi: 10.5377/rci.v21i2.5602. [ Links ]
Aye, T. N., A. Brännström and L. Carlsson. 2022. Prediction of tree sapwood and heartwood profiles using pipe model and branch thinning theory. Tree Physiology 42(11):2174-2185. Doi: 10.1093/treephys/tpac065. [ Links ]
Berger, P. D., R. E. Maurer and G. B. Celli. 2018. Experimental design, with application in management, engineering, and the sciences. Springer. Boston, MA, United States of America. 639 p. [ Links ]
Berrill, J. P., K. L. O’Hara and N. E. Kichas. 2020. Bark thickness in coast redwood (Sequoia sempervirens (D. Don) Endl.) varies according to tree-and crown size, stand structure, latitude and genotype. Forests 11(6):637. Doi: 10.3390/f11060637. [ Links ]
Bowman, K. W., S. A. Dale, S. Dhanani, J. Nehru and B. T. Rabishaw. 2022. The degradation of the Amazon rainforest: Regional and global climate implications. In: Ongoma, V. and H. Tabari (Eds.). Climate Impacts on Extreme Weather. Current to Future Changes on a local to Global Scale. Elsevier. Amsterdam, NH, Netherlands. pp. 217-234. [ Links ]
Colgan, M. S., T. Swemmer and G. P. Asner. 2014. Structural relationships between form factor, wood density, and biomass in African savanna woodlands. Trees 28:91-102. Doi: 10.1007/s00468-013-0932-7. [ Links ]
Costa C., V., S. do Amaral M., A. Libanio P., A. Figueiredo F. and E. Urbano. 2016. Modeling of the commercial volume stock in an ombrophilous forest in the Southwest of the Amazon. Cerne 22(4):457-464. Doi: 10.1590/01047760201622032204. [ Links ]
de Azevêdo, T. K. B., J. B. Paes, L. Calegari y J. W. B. do Nascimento. 2014. Relações entre volume e massa da madeira e casca de jurema-preta (Mimosa tenuiflora). Revista Brasileira de Ciências Agrárias 9(1):97-102. Doi: 10.5039/agraria.v9i1a3066. [ Links ]
Del Mar, M. 2021. Lineamientos para la elaboración del Plan Operativo para concesiones forestales con fines maderables. Servicio Nacional Forestal y de Fauna Silvestre. Diario Oficial del Bicentenario El Peruano. https://busquedas.elperuano.pe/normaslegales/aprueban-los-lineamientos-para-la-evaluacion-del-plan-gener-resolucion-no-d000034-2021-midagri-serfor-de-1932808-2/ . (15 de noviembre de 2022). [ Links ]
Fan, G., W. Feng, F. Chen, D. Chen, Y. Dong and Z. Wang. 2020. Measurement of volume and accuracy analysis of standing trees using Forest Survey Intelligent Dendrometer. Computers and Electronics in Agriculture 169:105211. Doi: 10.1016/j.compag.2020.105211. [ Links ]
Fuentes, E., C. Gómez, D. Pizarro, J. Alegre, … and H. Vásquez. 2022. A review of silvopastoral systems in the Peruvian Amazon region. Tropical Grasslands-Forrajes Tropicales 10(2):78-88. Doi: 10.17138/tgft(10)78-88. [ Links ]
Furlan G., F., J. R. dos Santos and J. C. Mura. 2010. Eucalyptus biomass and volume estimation using interferometric and polarimetric SAR data. Remote Sensing 2(4):939-956. Doi: 10.3390/rs2040939. [ Links ]
García E., G. G., J. J. García M., J. Hernández R., H. J. Muñoz F., X. García C. y A. Hernández R. 2016. Precisión de los coeficientes y cocientes de forma en la estimación del volumen de Pinus montezumae Lamb. Revista Mexicana de Ciencias Forestales 7(35):19-36. Doi: 10.29298/rmcf.v7i35.72. [ Links ]
Guzmán-Santiago, J. C., O. A. Aguirre-Calderón and B. Vargas-Larreta. 2020. Forest volume estimation techniques with special emphasis on the tropics. Revista Chapingo Serie Ciencias Forestales y del Ambiente 26(2):291-306. Doi: 10.5154/r.rchscfa.2019.07.061. [ Links ]
Ikonen, V. P., S. Kellomäki, H. Väisänen and H. Peltola. 2006. Modelling the distribution of diameter growth along the stem in Scots pine. Trees 20:391-402. Doi: 10.1007/s00468-006-0053-7. [ Links ]
InfoStat. 2022. InfoStat (v2022). IS InfoStat Software estadístico. Córdoba, Cba, Argentina. Universidad Nacional de Córdoba. http://www.infostat.com.ar . (15 de noviembre de 2022). [ Links ]
Inpixon. 2022. SigmaPlot (v14). Palo Alto, Ca, United States of America. Inpixon Systat Software Inc. https://systatsoftware.com/ . (15 de noviembre de 2022). [ Links ]
Kang, H., X. Wen, X. Deng, L. Chen and F. Xiao. 2021. Heartwood and sapwood variation and development in chenshan red-heart chinese fir (Cunninghamia lanceolata (Lamb.) Hook). Forest Products Journal 71(4):299-308. Doi: 10.13073/FPJ-D-21-00034. [ Links ]
Lozano B., L. A. y J. L. Bonilla V. 2022. Factor de forma para árboles del bosque seco tropical (bs-T) en el norte del Departamento del Tolima-Colombia. Revista Temas Agrarios 27(2):344-353. Doi: 10.21897/rta.v27i2.3136. [ Links ]
Malata H., E. S. Ngulube and E. Missanjo. 2017. Site specific stem volume models for Pinus patula and Pinus oocarpa. International Journal of Forestry Research 2017:1-6. Doi: 10.1155/2017/3981647. [ Links ]
Mendes N., R. G., J. K. Vanclay, A. Figueiredo F., S. do Amaral M., … and L. J. Mazzei de Freitas. 2020. The tree height estimated by non-power models on volumetric models provides reliable predictions of wood volume: The Amazon species height modelling issue. Trees, Forests and People 2:100028. Doi: 10.1016/j.tfp.2020.100028. [ Links ]
Meunpong, P., C. Penboon, N. Kuasakun and C. Wachrinrat. 2021. Tree dimension and environmental correlates of heartwood content in Siamese rosewood (Dalbergia cochinchinensis). Biodiversitas Journal of Biological Diversity 22(6):3297-3303. Doi: 10.13057/biodiv/d220635. [ Links ]
Ministerio de Desarrollo Social y Medio Ambiente (Midsma). 2001. Primer inventario nacional de bosques nativos. Proyecto bosques nativos y áreas protegidas BIRF 4085-AR 1998-2001 República Argentina. Manual de análisis de fustes. Midsma y Secretaría de Desarrollo Sustentable y Política Ambiental. Buenos Aires, BA, Argentina. 39 p. https://www.argentina.gob.ar/sites/default/files/manual_analisis_de_fustes_0.pdf . (15 de noviembre de 2022). [ Links ]
Ministerio del Ambiente (Minam) . 2015. Mapa Nacional de Cobertura Vegetal: memoria descriptiva. Ministerio del Ambiente. Lima, LMA, República del Perú. 108 p. https://repositoriodigital.minam.gob.pe/handle/123456789/178 . (15 de noviembre de 2022). [ Links ]
Miranda L., F., R. G. Mendes N., F. Emmert, G. G. Alves S., N. A. Moraes C. and I. Souza M. 2021. How many trees are necessary to fit an accurate volume model for the Amazon forest? A site-dependent analysis. Forest Ecology and Management 480:118652. Doi: 10.1016/j.foreco.2020.118652. [ Links ]
Molina-Valero, J. A., U. Diéguez-Aranda, J. G. Álvarez-González, F. Castedo-Dorado and C. Pérez-Cruzado. 2019. Assessing site form as an indicator of site quality in even-aged Pinus radiata D. Don stands in north-western Spain. Annals of Forest Science 76(4):113. Doi: 10.1007/s13595-019-0904-1. [ Links ]
Nikita, S., G. Thakur, N. G. Jesubalan, A. Kulkarni, V. B. Yezhuvath and A. S. Rathore. 2022. AI-ML applications in bioprocessing: ML as an enabler of real time quality prediction in continuous manufacturing of mAbs. Computers and Chemical Engineering 164:17896. Doi: 10.1016/j.compchemeng.2022.107896. [ Links ]
Ogana, F. N., S. Corral-Rivas and J. J. Gorgoso-Varela. 2020. Nonlinear mixed-effect height-diameter model for Pinus pinaster Ait. and Pinus radiata D. Don. Cerne 26(1):150-161. Doi: 10.1590/01047760202026012695. [ Links ]
Pacheco R., D. y C.Vásquez V. y Y. Gallardo V. 2016. Anuario forestal 2015. Ministerio de Agricultura y Riego y Servicio Nacional Forestal y de Fauna Silvestre (Serfor). Lima, LMA, República del Perú. 213 p. https://sinia.minam.gob.pe/documentos/peru-forestal-numeros-2015 . (15 de noviembre de 2022). [ Links ]
Piqueras, S., S. Füchtner, R. R. de Oliveira, A. Gómez-Sánchez, ... and L. G. Thygesen. 2019. Understanding the formation of heartwood in larch using synchrotron infrared imaging combined with multivariate analysis and atomic force microscope infrared spectroscopy. Frontiers in Plant Science 10:1701. Doi: 10.3389/fpls.2019.01701. [ Links ]
R Core Team. 2022. The R Project for Statistical Computing, R: A language and environment for statistical computing (v4.2.2). Vienna, W, Austria. R Foundation for Statistical Computing. https://www.R-project.org/ . (15 de noviembre de 2022). [ Links ]
Rachid-Casnati, C., E. G. Mason and R. C. Woollons. 2019. Using soil-based and physiographic variables to improve stand growth equations in Uruguayan forest plantations. iForest-Biogeosciences and Forestry 12(3):237-245. Doi: 10.3832/ifor2926-012. [ Links ]
Reis C., L. R., C. J. Fonseca D., J. D. Zea-Camaño, R. Silva O., A. L. Pelissari y M. N. Martins M. 2020. Variabilidad espacial de Swietenia macrophylla en sistema agroforestal de la Amazonia brasileña. Madera y Bosques 26(1):1-14. Doi: 10.21829/myb.2020.2611937. [ Links ]
Rojas B., N. B., D. A. Cotrina S., E. Barboza C., M. Á. Barrena G., … and R. Salas L. 2020. Current and future distribution of five timber forest species in Amazonas, northeast Peru: Contributions towards a restoration strategy. Diversity 12(8):305. Doi: 10.3390/d12080305. [ Links ]
Souza de L., Q., T. A. da Cunha, M. A. Amaro, E. O. Figueiredo y P. R. Feitosa P. 2021. Volume estimate for three timber species with commercial interest from the diameter of the stump. Floresta 51(3):776-784. Doi: 10.5380/rf.v51i3.72945. [ Links ]
Tamarit U., J. C., H. M. De los Santos P., A. Aldrete, J. R. Valdez L., H. Ramírez M. y V. Guerra De la C. 2014. Sistema de cubicación para árboles individuales de Tectona grandis L. f. mediante funciones compatibles de ahusamiento-volumen. Revista Mexicana de Ciencias Forestales 5(21):58-74. Doi: 10.29298/rmcf.v5i21.358. [ Links ]
Tito, R., N. Salinas, E. G. Cosio, T. E. Boza E., … and R. M. Roman-Cuesta. 2022. Secondary forests in Peru: differential provision of ecosystem services compared to other post-deforestation forest transitions. Ecology and Society 27(3):12. Doi: 10.5751/ES-13446-270312. [ Links ]
Tlaxcala-Méndez, R. M., H. M. de los Santos-Posadas, P. Hernández-de la Rosa y J. L. López-Ayala. 2016. Variación del factor de forma y el ahusamiento en procedencias de cedro rojo (Cedrela odorata L.). Agrociencia 50(1):89-105. https://www.redalyc.org/articulo.oa?id=30243765007 . (15 de noviembre de 2022). [ Links ]
Velioğlu, E., S. T. Güner, H. Karakurt, Y. Taştan, Z. Yavuz and D.Tuğrul. 2023. Relationships between site index and ecological variables of trembling poplar forests (Populus tremula L.) in Türkiye. Environmental Monitoring and Assessment 195(2):308. Doi: 10.1007/s10661-023-10933-3. [ Links ]
Yang, B., H. Jia, Z. Zhao, S. Pang and D. Cai. 2020. Horizontal and vertical distributions of heartwood for teak plantation. Forests 11(2):225. Doi: 10.3390/f11020225. [ Links ]
Zhang, B., S. Sajjad, K. Chen, L. Zhou, … and Y. Sun. 2020. Predicting tree height-diameter relationship from relative competition levels using quantile regression models for chinese fir (Cunninghamia lanceolata) in Fujian Province, China. Forests 11(2):183. Doi: 10.3390/f11020183. [ Links ]
Received: January 23, 2023; Accepted: June 02, 2023
 Este es un artículo publicado en acceso abierto bajo una licencia Creative Commons
