


Services on Demand
Journal
Article
 text in
  English (pdf)
 Article in xml format
 Article references
 Send this article by e-mail
Indicators
-
 Cited by SciELO
 -
 Access statistics
Related links
-
 Similars in
SciELO
Similars in
SciELO
Share

 Permalink
Revista mexicana de ciencias forestales
Print version ISSN 2007-1132
Rev. mex. de cienc. forestales vol.12 n.66 México Jul./Aug. 2021 Epub Oct 04, 2021
https://doi.org/10.29298/rmcf.v12i66.896
Scientific article
Multitemporal analysis of land use and vegetation in the Cumbres de Monterrey National Park
1Universidad Autónoma de Nuevo León Facultad de Ciencias Forestales. México.
2 Universidad Autónoma de Nuevo León. Facultad de Economía. México
The Cumbres de Monterrey National Park is characterized by its rugged orography, which determines the distribution of a great diversity of ecosystems; these provide environmental goods and services, such as carbon capture and water supply for the Monterrey Metropolitan Area. However, it has been under strong pressure as a result of the progressive advance of human settlements, land use change for agricultural purposes, and forest fires. The present research aims to determine the dynamics of change in land use and vegetation, through multitemporal analysis with high-resolution satellite images. Results indicate that the ecosystems are experiencing constant changes due to both natural and anthropogenic factors. On the one hand pine, oak-pine and oak forests, exhibit an annual rate of change of 0.406, 0.272, and 0.245 respectively, which is equivalent to a recovery of forest cover of 3 590.50 ha. However, ecosystems such as grasslands, rosetophilic desert scrub, and microphyllous desert scrub show an annual rate of change of -0.954, -0.735 and -0.562, which is equivalent to a loss of coverage of 1 919.97 ha. This dynamic of land use puts at risk the integrity, the resilience abilityity and the multifunctionality of goods and services that they provide to the Monterrey Metropolitan Area.
Key words: Protected natural areas; forest cover; ecotourism; multifunctionality; reforestation; resilience
El Parque Nacional Cumbres de Monterrey se caracteriza por su accidentada orografía que determina la distribución de una gran diversidad de ecosistemas, los cuales generan bienes y servicios ambientales como la captura de carbono y el abasto de agua para el Área Metropolitana de Monterrey; sin embargo, está sujeto a una fuerte presión por el avance progresivo de asentamientos humanos, el cambio de uso del suelo con fines agropecuarios e incendios forestales. El objetivo de la presente investigación fue determinar la dinámica de cambio del uso del suelo y de la vegetación, mediante el análisis multitemporal con imágenes satelitales de alta resolución. Los resultados indican que los ecosistemas están experimentando cambios constantes debido a factores tanto naturales como antropogénicos; por una parte, los bosques de pino, encino-pino y encino registran una tasa anual de cambio de 0.406, 0.272 y 0.245, respectivamente que equivalen a una recuperación de cobertura forestal de 3 590.50 ha. En tanto que, ecosistemas como el pastizal, matorral desértico rosetófilo y matorral desértico micrófilo presentan una tasa anual de cambio de -0.954, -0.735 y -0.562 que representan una pérdida de cobertura de 1 919.97 ha. Esta dinámica de uso del suelo pone en riesgo la integridad, capacidad de resiliencia y la multifuncionalidad de los bienes y servicios que proporciona Parque Nacional Cumbres de Monterrey al Área Metropolitana de Monterrey.
Palabras claves: Áreas naturales protegidas; cobertura forestal; ecoturismo; multifuncionalidad; reforestación; resiliencia
Introduction
The Cumbres de Monterrey National Park (PNCM, for its acronym in Spanish) is part of the eastern Sierra Madre mountain system; it has a wide altitudinal gradient, as well as a diversity of exposure to sunlight and the influence of humid air masses that favor an extraordinary mosaic of ecosystems and biological diversity. Therefore, it is considered the area with the greatest ecological relevance and value in the state of Nuevo León, mainly for the Metropolitan Area of Monterrey, since it supplies more than 40 % of the water consumed by the population (Cantú-Ayala et al., 2013; Rovalo-Merino et al., 2013).
3 729 species of flora and fauna are distributed in the PNCM, of which 141 are at risk: mammals (11), birds (32), reptiles (36), amphibians (4), fish (8), plants (42), and fungi (8) (Semarnat-2010; González-Saldivar et al., 2013; Naturalista, 2021). Its ecosystems capture 6 113 920 Mg C, which represents a very important contribution to mitigating the effects of greenhouse gas emissions (Jiménez-Pérez et al., 2013).
In this regard, the plant communities with the highest figures are pine-oak forests, with an average of 82 Mg C ha-1 (Rodríguez-Lagua et al., 2009); oak-pine, with 70 Mg C ha-1 (Aguirre-Calderón and Jiménez-Pérez, 2011); pine forests, 62 Mg C ha-1 (Pimienta de la Torre et al., 2007); submontane scrub, with 12 Mg C ha-1 (Montaño et al., 2016); and grassland, 4 Mg C ha-1 (Yerena et al., 2014).
The Cumbres de Monterrey National Park is one of the most visited areas in the state of Nuevo León due to its natural attractions, which render it ideal for recreation and leisure (Correa-Sandoval and Mayén, 2013). These activities can become a significant factor in conserving the environment, provided that the ecological, social and economic factors of the region are taken into account (Díaz, 2010). However, among other practices, the use of all-terrain vehicles, which has increased in the area, is considered one of the causes of major ecological and hydrological disturbance to river and stream channels (Brenner, 2006; Menchaca and Alvarado, 2011).
The situation described above exerts strong pressure on the available natural resources, with the consequent degradation of vulnerable ecosystems (Rodríguez and Acevedo, 2015). In addition, the communities living in the park have grown, and there is a lack of suitable areas for agricultural crops (Aragón-Palacios, 2013).
Multitemporal analysis is of great importance for monitoring the dynamics of land use and vegetation change, since it allows understanding the factors that trigger the process of ecological succession. These, in turn, affect the recovery of the vital functions of those ecosystems that have been exposed to both natural impacts and the effects of anthropogenic disturbances (Giri et al., 2007; Menchaca and Alvarado, 2011). Likewise, the use of high-resolution satellite images is an important alternative to the evaluation of structural and eco-physiological variables at a regional scale and over time in order to analyze the evolution of forest ecosystems after alterations in their structure and composition (Tirpak and Giuliano, 2010).
Little research has been carried out in the PNCM to assess the dynamics of its plant communities. Most studies have focused on the growth of pine species (González, 2019) and on climate reconstruction by means of dendrochronology (Luna, 2020), without a landscape-level perspective to allow understanding the effect that the exclusion of productive activities has had on the passive restoration of plant communities or on the degradation of post-fire ecosystems.
The objective of this research was to carry out a classification of land use and vegetation in three years: 2000, 2010, and 2018. It was hypothesized that the surface area of plant communities recovers naturally over time, due to the exclusion of productive activities in the PNCM.
Materials and Methods
PNCM is located in the state of Nuevo León, between 26°31'00" N, 100°17'20" W (Figure 1) and borders with the state of Coahuila. It is part of RH-24 Bravo-Conchos river basin, which is located between the limits of Allende, García, Montemorelos, Monterrey, Rayones, Santa Catarina, Santiago and San Pedro Garza García municipalities, and has a total surface area of 177 395.95 ha (DOF, 2000).

The dominant climates in the PNCM are Semi-warm humid (A)C(w1), (A)C(w2); Temperate sub-humid C(w1); Arid warm BSohw and Semi-arid warm BS1hw. Rainfall varies from 344 mm to 983 mm per year and the average annual temperature ranges from 9 to 24 °C (Cuervo-Robayo et al., 2014). The soils are semi-arid, associated with desert vegetation; most are shallow and coarse-textured, and they sometimes have a hard or poorly permeable subsoil. The dominant soils are Leptosol (78.88 %), Pheozem (17.68 %), Fluvisol (1.45 %), Luvisol (0.98 %), Calcisol (0.55 %), Regosol (0.31 %), and Vertisol (0.15 %) (Inegi, 2019).
Surface waters in the study area are drained mainly by the Santa Catarina and Ramos river sub-basins. Smaller portions of the PNCM correspond to other sub-basins: the northwestern part drains into the Pesquería river sub-basin; the southeastern region, into the Pilón River, and the central region, towards the northeast, into the San Juan river (SIATL, 2020).
Processing and generation of orthomosaics
In order to identify the optimal resolution for supervised classification processes to determine the rates of land use and vegetation change, a comparison was made between the satellite images most commonly used in this type of analysis: Landsat 8 OLI (Figure 2A) and Sentinel 2A (Figure 2B), compared to orthophotos (Figure 2C ), Birdseye (Figure 2D), and Airbus Defence and Space satellite imagery.
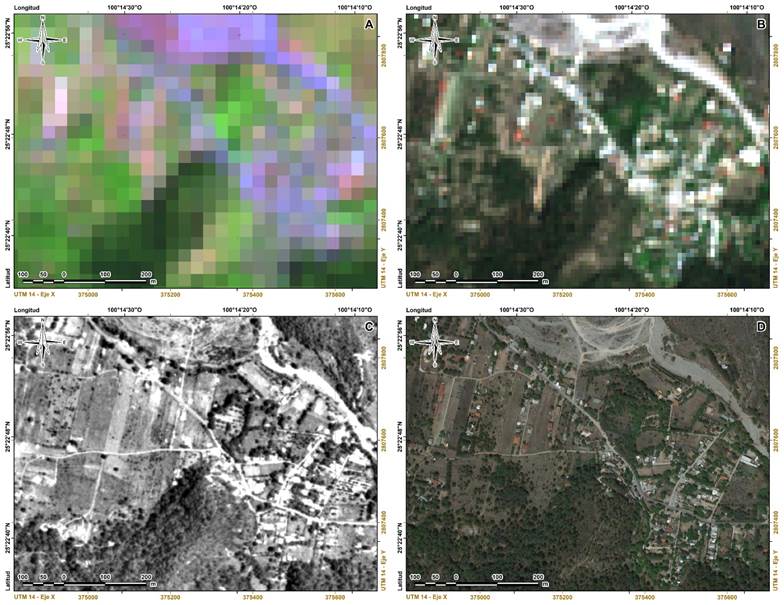
Figure 2 Comparison of Landsat 8 OLI (A), Sentinel 2A (B), Orthophotos (C) and high-resolution imagery (D).
According to Earth Observing System (2020), Landsat 8 (30 m/pixel; bands 7, 5, 4) and Sentinel 2 (10 m/pixel; bands 8,4,3) images are classified as medium resolution; while orthophotos (1.5 m/pixel), and Birdseye (0.28 m/pixel) and Airbus Defence and Space satellite images (1.14 m/pixel) are considered high resolution, because they have a resolution below the 5 m/pixel classification of the Earth Observing System.
The processing of high-resolution satellite images is based on georeferencing, radiometric correction, radiometric normalization of the series, and cloudiness percentage (Tirpak and Giuliano, 2010). Therefore, the availability of images with these characteristics was limited to the years 2000, 2010, and 2018.
Medium-resolution satellite imagery was obtained from the U.S. Geological Survey's Earth Explorer platform (USGS, 2020); orthophotos, from the Espacios y Datos de México server (Inegi, 2020), and Birdseye and Airbus Defence and Space images, from the SASPlanet software (SASPlanet, 2020).
Supervised classification
A supervised classification was performed based on the generation of three orthomosaics composed of 27 orthophotos (year 2000; Figure 3A), 578 Birdseye (year 2010; Figure 3B) and 144 Airbus Defence and Space images (year 2018; Figure 3C), which were compared with Landsat (year 2018; Figure 3D) and Sentinel images (2018).

The open source QGIS 2.18.25 "Las Palmas" software was used for change detection (QGIS Development Team, 2020).
The atmospheric correction to the images of each period was done by cropping them and subjecting them to an unsupervised classification process with the K-means analysis module, which groups the cell values into classes with the multivariate cluster analysis method (Jumb et al., 2014; Rashmi et al., 2016). The files were then transformed from raster to vector format for supervised classification (Figure 4).

The supervised classification was carried out using control points, which consisted of 148 sites systematically distributed in areas with a high degree of confusion due to image reflectance, exposure, noise and cloud cover.
Information related to the different land uses, vegetation cover and vegetation type was obtained and compared with the information developed by Conafor (2013) and Inegi (2017), and a classification of different land uses (agriculture, human settlements, roads, power transmission lines and rivers) was generated, as well as forest cover (Douglas Fir Forest, Holm Oak, Holm Oak-Pine, Pine, Pine-Oak, Pine-Oak, Microphyllous Desert Scrub, Rosetophile Desert Scrub, Submontane Scrub, Grassland and No Vegetation) distributed in the PNCM (Figure 5).

The agreement and accuracy of the results of the classification of high-resolution satellite imagery was calculated in the r.kappa module in GRASS 7.6.0 (QGIS Development Team, 2020), which generates an error matrix and determines Cohen's kappa coefficient.
Profit and loss determination
The determination of the loss or gain in the restoration process of the different types of vegetation was obtained by constructing transition matrices and rates of change for the years considered in the study, using the equation developed by FAO (1996) and adapted by Palacio-Prieto et al. (2004).
Where:
To describe the changes in land use and vegetation, a cross-tabulation of time 1 and time 2 was generated, allowing us to obtain a matrix of change. The diagonal shows the total amount of stable landscape between one date and another, while outside the diagonal are the transitions of the classes between Year 1 and Year 2. A positive rate of change value indicates a gain in restored surface area, while a negative value corresponds to a loss of forest cover.
Results and Discussion
Fifteen land use and vegetation classes were derived from the supervised classification process; no significant change was observed in the categories of human settlements, roads, power transmission lines or rivers; therefore, the analysis was performed based on the main eleven classifications (Table 1).
Table 1 Classification of land use and vegetation in the PNCM.
| Year | 2000 | 2010 | 2018 | |||
|---|---|---|---|---|---|---|
| Vegetation | ha | % | ha | % | ha | % |
| A | 1 550.00 | 0.87 | 1 701.33 | 0.96 | 1 865.57 | 1.05 |
| DFF | 3 600.69 | 2.03 | 3 696.70 | 2.08 | 3 760.52 | 2.12 |
| OF | 20 119.76 | 11.34 | 20 531.17 | 11.57 | 21 035.22 | 11.86 |
| OPF | 15 148.80 | 8.54 | 15 518.38 | 8.75 | 15 915.20 | 8.97 |
| PF | 24 957.86 | 14.07 | 25 999.67 | 14.66 | 26 866.54 | 15.14 |
| POF | 26 276.07 | 14.81 | 26 468.60 | 14.92 | 27 336.31 | 15.41 |
| MDS | 219.14 | 0.12 | 217.51 | 0.12 | 197.79 | 0.11 |
| RDS | 13 664.03 | 7.70 | 12 463.80 | 7.03 | 11 949.78 | 6.74 |
| SMS | 37 452.30 | 21.11 | 37 820.18 | 21.32 | 39 751.12 | 22.41 |
| GL | 1 152.91 | 0.65 | 1 030.07 | 0.58 | 968.54 | 0.55 |
| NV | 25 860.23 | 14.58 | 24 554.38 | 13.84 | 20 355.19 | 11.47 |
A= Agricultural; DFF= Douglas Fir Forest; OF= Oak Forest; OPF= Oak-Pine Forest; PF= Pine Forest; POF= Pine-Oak Forest; MDS= Microphyllous Desert Scrub; RDS= Rosetophile Desert Scrub; SMS= Submontane Scrub; GL= Grassland; NV= No Vegetation.
In regard to high-resolution images, the comparative analysis between Landsat 8 OLI and Sentinel 2ª images showed that there is an overestimation of more than 24 % for areas with forest cover. This is because some images showed displacement between the coordinates of the bands, which can produce a systematic error related to overlapping on the same path, but in a different row, in combination with the degree of cloudiness in the images (Cristóbal et al., 2004; Astola et al., 2019).
The classification of the high-resolution images presented average Kappa index values of 0.83, which are considered to be within a very good level of accuracy, and were higher than those cited by Mendes et al. (2015), who obtained a value of 0.58 for images from the Geoeye-1 satellite.
The PNCM covers an area of 177 395.87 ha, of which, in the year 2018 (Table 1), 81.25 % corresponded to forest cover; 14.58 %, to no apparent vegetation; 3.18 %, to rivers; 0.70 %, to human settlements; 0.19 %, to roads, and 0.10 %, to electric transmission lines. The main vegetation types identified include submontane scrubland (39 751.12 ha), pine-oak (27 336.31 ha), pine (26 866.54 ha), oak (21 035.22 ha), oak-pine (15 915.20 ha), desert rosette scrub (11 949.78 ha), Douglas fir forest (3 760.52 ha), and microphyllous desert scrub (197.79 ha).
In general, there is a process of forest cover recovery in the PNCM; mainly in pine, pine-oak, oak-pine, oak-oak and Douglas fir forests as a result of the resilience of ecosystems to natural or anthropogenic disturbances (Lloret, 2012; Mora-Donjuán and Alanís-Rodríguez, 2016), as well as the restoration efforts made by communities, non-governmental organizations, and public institutions ( Rovalo-Merino et al., 2013).
However, in ecosystems such as the microphyllous desert scrub, the rosetophile desert scrub, and grasslands, the loss of cover continues due to changes in land use for agricultural and livestock purposes and to the increase in human settlements (Figure 6).
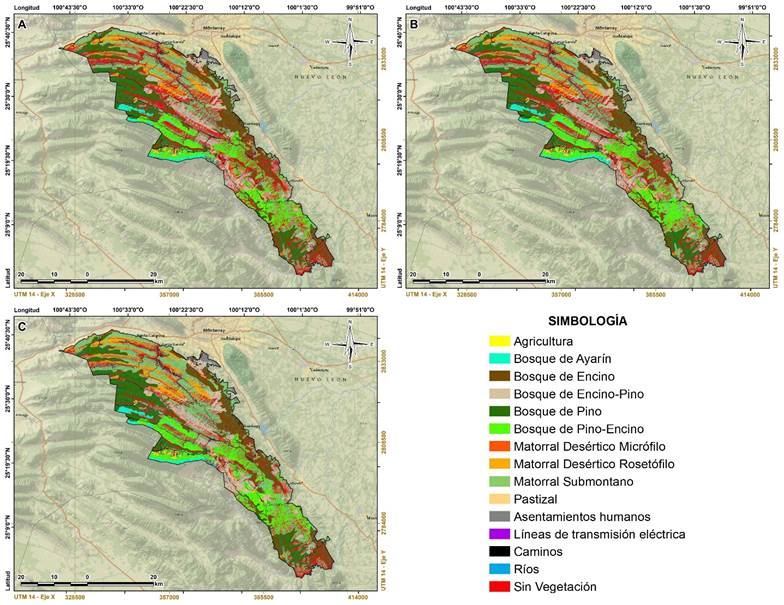
Agricultura = Agriculture; Bosque de ayarín = Douglas fir forest; Bosque de encino = Oak forest; Bosque de encino-pino = Oak-Pine forest; Bosque de pino = Pine Forest; Bosque de pino-encino = Pine-Oak Forest; Matorral desértico micrófilo = Microphyllous Desert Scrub; Matorral desértico rosetófilo = Rosetophile Desert Scrub; Matorral submontano = Submontane Scrub; Pastizal = Grassland; Asentamientos humanos = Human settlements; Caminos = Roads; Ríos = Rivers; Líneas de transmisión eléctrica = Power transmission lines; Sin vegetación = No Vegetation.
Figure 6 Land use and vegetation classification from 2000 (A), 2010 (B) and 2018 (C).
Detection of land use changes
The recovery of vegetation in the PNCM is positive, as can be seen during the 2000-2010 period, when a 13.03 % recovery of the forest cover was recorded, compared to 2000, mainly in those areas covered with pine, Douglas fir, oak-pine, oak, pine-oak, pine-oak and submontane scrub forests. However, there was also a loss of 20.18 % in grasslands, rosetophile desert scrub, and microphyllous desert scrub; agriculture showed an increase of 9.76 % and the areas without an apparent cover showed a decrease of 5.05 % (Table 2).
Table 2 Land cover changes in the PNCM from 2000 to 2018.
| Period | ∆ 2000 - 2010 | ∆ 2010 - 2018 | ∆ 2000 - 2018 | |||
|---|---|---|---|---|---|---|
| Vegetation | ha | % | ha | % | ha | % |
| Agricultural | 151.33 | 9.76 | 164.24 | 9.65 | 315.57 | 20.36 |
| Douglas Fir Forest | 96.01 | 2.67 | 63.82 | 1.73 | 159.83 | 4.44 |
| Pine Forest | 1041.81 | 4.17 | 866.87 | 3.33 | 1 908.68 | 7.65 |
| Pine-Oak Forest | 192.53 | 0.73 | 867.71 | 3.28 | 1 060.24 | 4.04 |
| Oak Forest | 411.41 | 2.04 | 504.05 | 2.46 | 915.46 | 4.55 |
| Oak-Pine Forest | 369.58 | 2.44 | 396.82 | 2.56 | 766.40 | 5.06 |
| Microphyllous Desert Scrub | -1.63 | -0.75 | -19.72 | -9.07 | -21.35 | -9.74 |
| Rosetophile Desert Scrub | -1 200.23 | -8.78 | -514.02 | -4.12 | -1 714.25 | -12.55 |
| Submontane Scrub | 367.88 | 0.98 | 1 930.94 | 5.11 | 2 298.82 | 6.14 |
| Grassland | -122.84 | -10.65 | -61.53 | -5.97 | -184.37 | -15.99 |
| No Vegetation | -1 305.85 | -5.05 | -4 199.19 | -17.10 | -5 505.04 | -21.29 |
∆ = Cover increase or loss.
These results exhibit a similar trend to those obtained by various studies in protected or exclusion areas, as cited by Flórez-Yepes et al. (2017) ―who estimated a recovery of 30.44 % for gold mine forests located in Manizales, Colombia―, as well as to those documented by Sanhouse-García et al. (2016) in Sinaloa, Mexico, where pine-oak and pine forests increased by 38.98 % and 29.56 %, respectively.
As for agricultural vegetation, increases of 9.76 % (2000-2010), 9.65 % (2010-2018), and 20.36 % (2000-2018) were observed. These values are similar to those reported by Kumar et al. (2020) in an analysis of cover change on the banks of the Ganges river in Haridwar district, India, for the years 1996, 2003, 2010, and 2017, where agriculture had an increase of 17.32 %. However, they are lower than that obtained by Martin et al. (2019) in the Kwakuchinja wildlife corridor of Tanzania, where agriculture increased by 35.6 %.
In regard to the carbon sequestration research conducted in various vegetation types (Pimienta de la Torre et al., 2007; Rodríguez et al., 2009; Aguirre-Calderón and Jiménez-Pérez, 2011; Montaño et al., 2016), the recovery of forest ecosystems in the PNCM generates an increase of 86 939.68 Mg C in pine-oak forests, 53 648.00 Mg C in oak-pine forests, 118 338.16 Mg C in pine forests, and 27 585.84 Mg C in submontane scrubland.
The progressive rate of change of agriculture and the negative impact of microphyllous desert scrub, rosetophile scrub, and grassland (Figure 7) threatens the integrity of ecosystems, as well as the provision of such goods and services as the recharge of the water bodies that supply the Metropolitan Area of Monterrey (López and Ixtacuy, 2017).
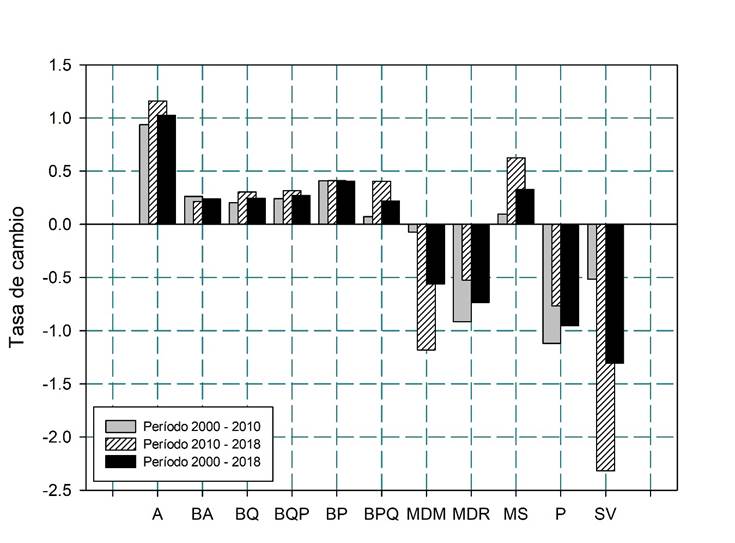
A = Agriculture; BA = Douglas Fir Forest; BQ = Oak Forest; BQP = Oak-Pine Forest; BP = Pine Forest; BPQ = Pine-Oak Forest; MDM = Microphyllous Desert Scrub; MDR = Rosetophile Desert Scrub; MS = Submontane Scrub; P = Grassland; SV = No Vegetation.
Figure 7 Dynamics of the rate of change of the soil and vegetation types.
One of the main factors that continue to affect ecosystems are forest fires: in the PNCM, more than 9 085.09 ha have been affected during the period from 2000 to 2011 (Conanp, 2011), and 2 493.68 ha from 2012 to 2019 (Conafor, 2020).
Forest fires are closely related to previous periods of excessive precipitation: those recorded in 2008, when 4 249.31 ha were damaged by fuel accumulation, resulted from the 2005 precipitation (1 600 mm), and those of 2011, which covered an area of 5 037.51 ha (Yerena et al., 2013), followed a precipitation of 1 915 mm in 2010 (Figure 8).

Conclusions
The multitemporal analysis indicates a gradual process of recovery of forest cover ―mainly of pine, pine-oak, oak-pine, oak, and Douglas fir forests― as a response to the resilience capacity and the prioritization of ecological restoration strategies in these ecosystems. The opposite situation is observed for the rosetophile desert scrub, the microphyllous desert scrub, and the grassland, which show continuous loss as a result of the change of land use for agricultural purposes.
The rates of change of land use and vegetation in this study indicate the presence of a dynamic in the successional process of the ecosystems of the PNCM. The tendency of this dynamic is similar to that cited for natural protected or exclusion areas where there is a gradual recovery of forest cover with certain types of vegetation, as well as a loss of ecosystems of less economic interest, that are being replaced through the advance of agriculture and of human settlements.
The exclusion of productive activities in natural protected areas does not guarantee the conservation of biodiversity or the optimal functioning of environmental services, since there are external factors that jeopardize the integrity of ecosystems, such as the recurrent presence of forest fires that reduce the resilience capacity and increase the vulnerability of ecosystem services.
The use of high-resolution imagery greatly improves the interpretation of different scenarios of land use and vegetation change, compared to Landsat and Sentinel imagery, and offers a true picture of the loss or gain of forest cover in natural protected areas.
Acknowledgments
The authors are grateful to the National Council of Science and Technology (Consejo Nacional de Ciencia y Tecnología, Conacyt) for the postgraduate scholarship granted to the first author, as well as to the School of Forestry Sciences and the School of Economics of the Universidad Autónoma de Nuevo León.
REFERENCES
Aguirre-Calderón, O. A y J. Jiménez-Pérez. 2011. Evaluación del contenido de carbono en bosques del sur de Nuevo León. Revista Mexicana de Ciencias Forestales 2 (6): 73-83. Doi: 10.29298/rmcf.v2i6.575. [ Links ]
Aragón-Palacios, J. 2013. Amenazas Demográficas Potenciales. In: Cantú-Ayala, C., M. Rovalo-Merino., J. Marmolejo-Moncivais., S. Ortiz-Hernández y F. Seriñá G. (eds.). Historia Natural del Parque Nacional Cumbres de Monterrey, México. UANL-CONANP. Linares, N.L., México. pp. 253-260. [ Links ]
Astola, H., T. Häme, L. Sirro, M. Molinier and J. Kilpi. 2019. Comparison of Sentinel-2 and Landsat 8 imagery for forest variable prediction in boreal región. Remote Sensing of Environment. 223: 257-273. Doi: 10.1016/j.rse.2019.01.019. [ Links ]
Brenner, L. 2006. Áreas naturales protegidas y ecoturismo: el caso de la reserva de la biosfera Mariposa Monarca, México. Relaciones 105: 237-265. https://www.redalyc.org/articulo.oa?id=13710508 (15 de diciembre de 2019). [ Links ]
Cantú-Ayala, C., S. Ortiz-Hernández y M. Rovalo-Merino. 2013. Consideraciones Finales. In: Cantú-Ayala, C. , M. Rovalo-Merino., J. Marmolejo-Moncivais., S. Ortiz-Hernández y F. Seriñá G. (eds.). Historia Natural del Parque Nacional Cumbres de Monterrey, México. UANL-CONANP. Linares, N.L., México. pp. 411-414. [ Links ]
Comisión Nacional Forestal (Conafor). 2013. Inventario Estatal Forestal y de Suelos-Oaxaca. Información complementaria y cartografía. Zapopan Jalisco, México. http://187.218.230.30/filesconafor/userfiles/IEFyS/IEFYS_Oaxaca_2013/ (5 de junio de 2020). [ Links ]
Comisión Nacional Forestal (Conafor). 2020. Sistema de predicción de peligro de incendios forestales de México. https://snigf.cnf.gob.mx (17 de abril 2020). [ Links ]
Comisión Nacional de Áreas Naturales Protegidas (Conanp). 2011. Incendios forestales en el Parque Nacional Cumbres de Monterrey. Nuevo León, Coahuila. https://www.gob.mx/conanp (17 de abril 2020). [ Links ]
Correa-Sandoval, A. y A. Mayén. 2013. Servicios Ecológicos y Bienestar Humano. In: Cantú-Ayala, C. , M. Rovalo-Merino., J. Marmolejo-Moncivais., S. Ortiz-Hernández y F. Seriñá G. (eds.). Historia Natural del Parque Nacional Cumbres de Monterrey, México. UANL-CONANP. Linares, N.L., México. pp: 391-404. [ Links ]
Cristóbal, J., X. Pons y P. Serra. 2004. Sobre el uso operativo de Landsat-7 ETM+ en Europa. Revista de Teledetección 21: 55-59. http://www.aet.org.es/revistas/revista21/AET21-11.pdf (11 de noviembre 2020) [ Links ]
Cuervo-Robayo, A. P., O. Téllez-Valdés, M. A. Gómez-Albores, C. S. Venegas-Barrera, J. Manjarrez and E. Martínez-Meyer. 2014. An update of high-resolution monthly climate surfaces for Mexico. International Journal of Climatology 34: 2427-2437. http://idrisi.uaemex.mx/11-ligas/8-superficies-climaticas-para-mexico (10 de enero 2019). Doi: 10.1002/joc.3848. [ Links ]
Diario Oficial de la Federación (DOF). 2000. Decreto del Área Natural Protegida Cumbres de Monterrey. DOF. 17 de noviembre de 2000. Secretaría de Gobernación. México, D.F., México. http://dof.gob.mx/ (10 de junio de 2020). [ Links ]
Díaz C, I. A. 2010. Ecoturismo Comunitario y Género en la Reserva de los Tuxtlas (México). Pasos Revista de Turismo y Patrimonio Cultural. 8: 151-165. Doi: 10.25145/j.pasos.2010.08.012. [ Links ]
Earth Observing System (EOS). 2020. Spatial Resolution Of A Satellite Image. Earth Observing System (EOS). https://eos.com/ (10 de enero 2020). [ Links ]
Flórez-Yepes, G. Y., A. Rincon-Santamaría, P. Santiago C y A. M. Alzate-Alvarez. 2017. Análisis multitemporal de las coberturas vegetales en el área de influencia de las minas de oro ubicadas en la parte alta del sector de Maltería en Manizales, Colombia. DYNA 84 (201): 95-101. Doi:10.15446/dyna.v84n201.55759. [ Links ]
Food and Agriculture Organization of the United Nations (FAO). 1996. Forest resources assessment 1990. Survey of tropical forest cover and study of change processes. Tropical countries. Rome, Italy. 152 p. [ Links ]
Giri, C., B. Pengra, Z. Zhu, A. Singh and L. L. Tieszen. 2007. Monitoring mangrove forest dynamics of the Sundarbans in Bangladesh and India using multi-temporal satellite data from 1973 to 2000. Estuarine, Coastal and Shelf Science 73: 91-100. Doi:10.1016/j.ecss.2006.12.019. [ Links ]
González J., J. 2019. Respuesta del crecimiento de Pinus pseudostrobus Lindl a las variables climáticas en el Parque Nacional Cumbres de Monterrey. Tesis de Maestría. Facultad de Ciencias Forestales. Universidad Autónoma de Nuevo León. Linares, N.L., México. 71 p. [ Links ]
González-Saldivar, F., J. Uvalle-Sauceda, J. Avendaño y A. Niño-Ramírez. 2013. Mamíferos. In: Cantú-Ayala, C. , M. Rovalo-Merino., J. Marmolejo-Moncivais., S. Ortiz-Hernández y F. Seriñá G. (eds.). Historia Natural del Parque Nacional Cumbres de Monterrey, México. UANL-CONANP. Linares, N.L., México. pp. 237-251. [ Links ]
Instituto Nacional de Estadística y Geografía (Inegi). 2017. Conjunto de datos vectoriales de Uso de Suelo y Vegetación. Escala 1:250 000. Serie VI. Escala: 1:250 000. Aguascalientes, Ags., México. https://www.inegi.org.mx/app/biblioteca/ficha.html?upc=889463598459 (12 de marzo de 2020). [ Links ]
Instituto Nacional de Estadística y Geografía (Inegi). 2019. Conjuntos de datos vectoriales de información topográfica escala 1:250 000 Nuevo León Serie VI. Aguascalientes, Ags., México. https://www.inegi.org.mx/app/biblioteca/ficha.html?upc=889463776895 (12 de marzo de 2020). [ Links ]
Instituto Nacional de Estadística y Geografía (Inegi). 2020. Conjunto de datos vectoriales. Espacios y Datos de México. https://www.inegi.org.mx/datos/ (12 de enero de 2020). [ Links ]
Jiménez-Pérez, J., O. Aguirre-Calderón, E. Alanís-Rodríguez e I. Yerena-Yamallel. 2013. Contenido de Carbono en Especies Vegetales. In: Cantú-Ayala, C. , M. Rovalo-Merino, J. Marmolejo-Moncivais, S. Ortiz-Hernández y F. Seriñá G. (eds.). Historia Natural del Parque Nacional Cumbres de Monterrey, México. UANL-CONANP. Linares, N.L., México. pp. 349-355. [ Links ]
Jumb, V., M. Sohani and A. Shrivas. 2014. Color image segmentation using K-means clustering and Otsu’s adaptive thresholding. International Journal of Innovative Technology and Exploring Engineering 3 (9): 72-76. http://www.ijitee.org/wp-content/uploads/papers/v3i9/I1495023914.pdf (1 de enero de 2020). [ Links ]
Kumar, S., Shwetank and K. Jain. 2020. A Multi-Temporal Landsat Data Analysis for Land-use/Land-cover Change in Haridwar Region using Remote Sensing Techniques. Procedia Computer Science 171: 1184-1193. Doi:10.1016/j.procs.2020.04.127. [ Links ]
Lloret, F. 2012. Vulnerabilidad y resiliencia de ecosistemas forestales frente a episodios extremos de sequía. Ecosistemas. 21: 85-90. Doi: 10.7818/ECOS.2012.21-3.11. [ Links ]
López H., J. R. y O. Ixtacuy L. 2017. Conservación y desarrollo, el caso del ecoturismo: una política ambiental fallida en la Reserva de la Biosfera La Encrucijada, Chiapas. El Periplo Sustentable 34: 82-108. https://rperiplo.uaemex.mx/article/view/9035 (20 octubre 2019). [ Links ]
Luna R., A. A. 2020. Aplicación de técnicas dendrocronológicas en Pinus teocote Schiede ex Schltdl para la reconstrucción climática en el Parque Nacional Cumbres de Monterrey. Tesis de Maestría. Facultad de Ciencias Forestales. Universidad Autónoma de Nuevo León. Linares, N.L., México. 69 p. [ Links ]
Martin, E. H., R. R. Jensen, P. J. Hardin, A. W. Kisingo, R. A. Shoo and A. Eustace. 2019. Assessing changes in Tanzania's Kwakuchinja Wildlife Corridor using multitemporal satellite imagery and open source tolos. Applied Geography 110: 1-7. Doi: 10.1016/j.apgeog.2019.102051. [ Links ]
Menchaca D., M. del S. y E. L. Alvarado M. 2011. Efectos antropogénicos provocados por los usuarios del agua en la microcuenca del río Pixquiac. Revista Mexicana de Ciencias Agrícolas. 1 (1): 85-96. Doi: 10.29312/remexca.v2i4.16. [ Links ]
Mendes, D. F., S. F. Da Silva, J. L. Ferreri, A. R. Dos Santos y R. F. García. 2015. Acurácia temática do classificador por máxima verossimilhança em imagem de alta resolução espacial do satélite Geoeye-1. Nucleus. 12: 107-118. Doi: 10.37378/1982.2278.1011. [ Links ]
Montaño, N. M., F. Ayala, S. H. Bullock, O. Briones, F. García O., R. García S., Y. Maya., Y. Perroni, C. Siebe, Y. Tapia T., E. Troyo y E. Yépez. 2016. Almacenes y flujos de carbono en ecosistemas áridos y semiáridos de México: Síntesis y perspectivas. Terra Latinoamericana. 34: 39-59. https://www.terralatinoamericana.org.mx/index.php/terra/article/view/75/81 (20 de octubre de 2019). [ Links ]
Mora-Donjuán, C. A. y E. Alanís-Rodríguez. 2016. Resiliencia de bosques de pino-encino en América: Una visión global del estado actual. Revista Forestal Mesoamericana Kurú. 13: 01-02. Doi: 10.18845/rfmk.v13i33.2571. [ Links ]
Naturalista. 2021. Registros de especies de flora y fauna en el Parque Nacional Cumbres de Monterrey. https://www.naturalista.mx/projects/pn-cumbres-de-monterrey-nuevo-leon (13 de mayo de 2021). [ Links ]
Palacio-Prieto, J. L., T. M. Sánchez-Salazar, J. M. Casado-Izquierdo, E. Propin-Frejomil, J. Delgado-Campos, A. Velázquez-Montes, L. Chias-Becerril, M. I. Ortiz-Álvarez, J. González-Sánchez, G. Negrete-Fernández, J. Gabriel-Morales y R. Márquez-Huitzil. 2004. Indicadores para la Caracterización y Ordenamiento del Territorio. Instituto Nacional de Ecología-SEMARNAT, Instituto de Geografía de la UNAM y Secretaría de Desarrollo Social. Convenio SEDESOL-Instituto de Geografía, UNAM. México, D.F., México. 161 p. http://cambioclimatico.gob.mx:8080/xmlui/bitstream/handle/publicaciones/174/434_2004_Indicadores_caracter_orden_territorio.pdf?sequence=1&isAllowed=y (26 de febrero de 2020). [ Links ]
Pimienta de la Torre, D. de J., G. Domínguez C., O. A. Aguirre C., F. Javier H y J. Jiménez. 2007. Estimación de biomasa y contenido de carbono de Pinus cooperi Blanco, en Pueblo Nuevo, Durango. Madera y Bosques 13 (1): 35-46. Doi:10.21829/myb.2007.1311234. [ Links ]
QGIS Development Team. 2020. QGIS Geographic Information System. Open Source Geospatial Foundation Project. https://qgis.org (12 de enero de 2020). [ Links ]
Rashmi C., S. Chaluvaiah and G. H. Kumar. 2016. An efficient parallel block processing approach for K-means algorithm for high resolution orthoimagery satellite images. Procedia Computer Science 89: 623-631. Doi:10.1016/j.procs.2016.06.025. [ Links ]
Rodríguez M., G. y A. Acevedo D. 2015. Cambios en la vida cotidiana de las mujeres a través de la incorporación al trabajo turístico en El Rosario, Michoacán, México. El Periplo Sustentable. 29: 5-33. http://hdl.handle.net/20.500.11799/62584 (10 diciembre de 2019). [ Links ]
Rodríguez-Laguna, R., J. Jiménez-Pérez, O. A. Aguirre-Calderón, E. J. Treviño-Garza y R. Razo-Zárate. 2009. Estimación de carbono almacenado en el bosque de pino-encino en la Reserva de la Biosfera El Cielo, Tamaulipas, México. Ra Ximhai 5 (3): 317-327. http://www.revistas.unam.mx/index.php/rxm/article/view/15164 (1 diciembre 2019). [ Links ]
Rovalo-Merino, M., J. Pérez-Cantú, S. Valenzuela-Pérez y M. de la Maza-Benignos. 2013. Restauración Ecológica. In: Cantú-Ayala, C. , M. Rovalo-Merino., J. Marmolejo-Moncivais., S. Ortiz-Hernández y F. Seriñá G. (eds.) Historia Natural del Parque Nacional Cumbres de Monterrey, México. UANL-CONANP. Linares, N.L., México. pp. 371-383. [ Links ]
Sanhouse-Garcia, A. J., Y. Bustos-Terrones, J. G. Rangel-Peraza, A. Quevedo-Castro and C. Pacheco. 2016. Multi-temporal analysis for land use and land cover changes in an agricultural region using open source tools. Remote Sensing Applications: Society and Environment 8: 278-290. Doi:10.1016/j.rsase.2016.11.002. [ Links ]
SASPlanet. 2020. SASPlanet Software. Versión 181221. SASPlanet Development Team. https://www.sasgis.org (26 de enero de 2020). [ Links ]
Secretaría del Medio Ambiente y Recursos Naturales (Semarnat). 2010. Norma Oficial Mexicana NOM-059-SEMARNAT-2010, Protección ambiental. Especies nativas de México de flora y fauna silvestres. Categorías de riesgo y especificaciones para su inclusión, exclusión o cambio. Lista de especies en riesgo. Diario Oficial de la Federación 30 diciembre de 2010. https://www.gob.mx/cms/uploads/attachment/file/134778/35.-_NORMA_OFICIAL_MEXICANA_NOM-059-SEMARNAT-2010.pdf (20 de abril de 2020). [ Links ]
Simulador de flujos de agua de cuencas hidrográficas (SIALT). 2020. Red hidrológica. 2020. Red Hidrológica Nacional. Versión 3.2. http://antares.inegi.org.mx/analisis/red_hidro/siatl/# (1 de febrero de 2020). [ Links ]
Tirpak, J. M. and W. M. Giuliano. 2010. Using multitemporal satellite imagery to characterize forest wildlife habitat: The case of ruffed grouse. Forest Ecology and Management 260: 1539-1547. Doi: 10.1016/j.foreco.2010.07.052. [ Links ]
U.S. Geological Survey (USGS). 2020. U.S. Geological Survey. https://earthexplorer.usgs.gov/ (1 de febrero de 2019). [ Links ]
Yerena Y., J. I., J. Jiménez P., E. Alanís R., O. A. Aguirre C., M. A. González y E. J. Treviño G. 2013. Emisiones de gases de efecto invernadero derivadas de incendios forestales de 2000-2011 en el Parque Nacional Cumbres de Monterrey. Ciencia UANL. 16: 68-75. http://www.cienciauanl.uanl.mx/ (10 de junio de 2020). [ Links ]
Yerena Y., J. I., J. Jiménez P., E. Alanís R., O. A. Aguirre C., E. J. Treviño G y M. A. González T. 2014. Dinámica de la captura de carbono en pastizales abandonados del noreste de México. Tropical and Subtropical Agroecosystems. 17: 113-121. https://www.redalyc.org/articulo.oa?id=939/93930735009.pdf (5 de diciembre de 2019). [ Links ]
Received: March 10, 2020; Accepted: January 19, 2021
 Este es un artículo publicado en acceso abierto bajo una licencia Creative Commons
