


Services on Demand
Journal
Article
 text in
  English (pdf)
 Article in xml format
 Article references
 Send this article by e-mail
Indicators
-
 Cited by SciELO
 -
 Access statistics
Related links
-
 Similars in
SciELO
Similars in
SciELO
Share

 Permalink
Revista mexicana de ciencias forestales
Print version ISSN 2007-1132
Rev. mex. de cienc. forestales vol.11 n.58 México Mar./Apr. 2020 Epub June 17, 2020
https://doi.org/10.29298/rmcf.v11i58.591
Scientific article
Structure and diversity of a gallery forest in northeastern Mexico
1Facultad de Ciencias Forestales. Universidad Autónoma de Nuevo León. México.
2Campo Experimental Centro-Altos de Jalisco, Centro de Investigación Regional Pacífico Centro. Instituto Nacional de Investigaciones Forestales, Agrícolas y Pecuarias. México.
3Instituto de Ecología Aplicada, División del Golfo. Universidad Autónoma de Tamaulipas. México.
4Campo Experimental Valle de México, Centro de Investigación Regional Centro. Instituto Nacional de Investigaciones Forestales, Agrícolas y Pecuarias. México.
The structure and diversity of the tree community of a gallery forest in northeastern Mexico was assessed. In 2017, at Allende municipality, Nuevo León, 15 sampling sites of 10 × 5 m were randomly established, where the individuals of arboreal size with a normal diameter (d1.30 m) ≥ 8 cm were measured. The horizontal structure was evaluated with the Importance Value Index, and the vertical structure, with Pretzsch’s index. For diversity, the Margalef and Shannon-Wiener indexes were calculated. Nine species were registered, belonging to nine genera and nine families. The evaluated community had 2187 N ha-1 abundance, with 496.3 m2 ha-1 basimetric area. The species with the highest abundance, dominance and frequency was Taxodium mucronatum, with 52.4 % of IVI value followed by Platanus rzedowskii (IVI = 23.2 %) and Carya illinoinensis (IVI = 8.8 %). Pretzsch’s index was 2.03, with a A max of 3.29 and a A rel of 61.87, which indicates medium structural diversity in the high strata. The D Mg value (Margalef index) of the community was 1.52 and average value of 0.58 for the Shannon-Wiener index, which indicate that the evaluated community has low richness and diversity.
Key words Importance Value Index; Pretzsch Index; Shannon-Wiener Index; Platanus rzedoswkii Nixon & J. M. Poole; Taxodium mucronatum Ten
Se determinó la estructura y diversidad de la comunidad arbórea de un bosque de galería en el noreste de México. En el año 2017, en el municipio Allende, Nuevo León se establecieron de manera aleatoria 15 sitios de muestreo de 10 × 5 m, donde se midieron los individuos de porte arbóreo con un diámetro a la altura del pecho (DAP = d 1.30 m) ≥ 8 cm. La evaluación de la estructura horizontal, se hizo mediante el Índice de Valor de Importancia y de la vertical con el índice de Pretzsch. Para la diversidad se calcularon los índices de Margalef y Shannon-Wiener. Se registraron nueve taxones, pertenecientes a igual número de géneros y familias. La comunidad bajo estudio presentó una abundancia de 2 187 N ha-1, con un área basal de 496.3 m2 ha-1. La especie que registró mayor abundancia, dominancia y frecuencia fue Taxodium mucronatum, con un valor de IVI de 52.4 %, seguida de Platanus rzedowskii (IVI = 23.2 %) y Carya illinoinensis (IVI = 8.8 %). El valor del índice de Pretzsch fue de 2.03, con A max de 3.29 y A rel de 61.87; lo que indica una diversidad estructural media en los estratos de altura. La comunidad tuvo un valor de D Mg = 1.52 para el índice de Margalef, y un valor promedio de 0.58 para el índice de Shannon-Wiener; por lo que, es baja su riqueza y diversidad.
Palabras clave Índice de Valor de Importancia; índice de Pretzsch; índice de Shannon-Wiener; Platanus rzedoswkii Nixon & J. M. Poole; Taxodium mucronatum Ten
Introduction
Gallery forests develop along water courses; they constitute an ecotone between aquatic and land communities (Naiman and Décamps, 1997). The benefits of this type of vegetation both, for wildlife and for human beings, have been widely documented (Lees and Peres, 2007). Besides providing a safe habitat for fauna species and serving as natural biological corridors, gallery forests prevent overflowing of rivers (Granados-Sánchez et al., 2006).
Although human populations usually settle near water bodies, the vegetation associated to rivers and streams is also affected by the change of land use and other anthropic activities (Belsky et al., 1999). Thus, stockbreeding, agriculture, tourism, and the extraction of timber for construction have reduced plant richness and abundance of these ecosystems (Canizales et al., 2010; Poff et al., 2012). From these actions and the occurrence of natural phenomena such as hurricanes and cyclones, it is often found today that these vegetal communities have changed their structure and their floristic composition (Granados-Sánchez et al., 2006).
In northeastern Mexico, gallery forests are very common along rivers born in the Eastern Sierra Madre (Treviño et al., 2001). Particularly in the state of Nuevo León, there is a large number of them, both permanent and temporary (Martínez et al., 2003). However, not all those that exist in the region have been studied from the ecological point of view, and their current status is unknown (Treviño et al., 2001). In order to carry out future restoration studies in negatively impacted gallery forests, this knowledge is necessary. For this reason, the objective of the present study was to assess the structure and diversity of the arboreal community of a gallery forest located in Allende municipality in Nuevo León, Mexico.
Materials and Methods
Study area
The study was carried out in a gallery forest adjoining a submontane shrub and a Tamaulipan thornscrub in northeastern Mexico, specifically in the Allende municipality in Nuevo León State. The community is in a mature condition without apparent anthropic disturbance and is difficult to access. Its geographical coordinates are 25º13’45” N and 100º03’18” W. The climate is dry (BSOhw), according to Köppen´s classification modified by García (1988) for Mexico. The mean annual temperature ranges between 20 and 22 °C, and the warmest months are July and August, while the lowest temperatures occur in December and January, with a mean of 13 to 14 °C.
Vegetation analysis
A 4 Km long stretch with an altitude range of 450 to 490 masl was considered; 15 rectangular sampling sites measuring 50 m2 (10 × 5 m) each were established at random for a total sampling surface area of 750 m2. The sites were located at the shores of the river, parallel to the riverbed, which flows from south to north (Canizales et al., 2010); all the individuals with tree size with a DBH (d 1.30 m) ≥ 8 cm were included. The dasometric variables evaluated were total height (h) and diameter breast height (d 1.30 m), which were measured with a Vertez III™ hypsometer and a Forestry Supliers Inc™ diametric tape, respectively.
Data analysis
The horizontal structure of each species was evaluated by determining its abundance according to the number of individuals; its dominance, in terms of its basimetric area, and its frequency, based on its presence in the sampling plots. The results were used to obtain a weighted value at taxon level known as Importance Value Index (IVI), which acquires percentage values on a scale of 0 to 100 (Müeller-Dombois and Ellenberg, 1974). The relative abundance (AR i , for its acronym in Spanish) per species was estimated using the following equation:
Where:
A i = Absolute abundance
The relative dominance (DR i , for its acronym in Spanish) was estimated using the formula:
Where:
D i = Absolute dominance.
The relative frequency (FR i , for its acronym in Spanish) was calculated using the following equation:
Where:
F i = Absolute frequency = P i /NS
P i = Number of sites where the species occurs
iNS = Total number of simple sites
The horizontal characterization of the vegetal community was carried out using the Importance Value Index (IVI), which is the sum of the percentage values of abundance, dominance and frequency; the value determines the presence of each taxon within the community and is defined as (Whittaker, 1972; Moreno, 2001):
Where:
AR i = Relative abundance of species i with respect to the total abundance
DR i = Relative dominance of species i with respect to total dominance
FR i = Relative frequency of species i with respect to total frequency
The characterization of the vertical structure of the taxa was carried out by using the vertical species distribution index (A) (Pretzsch, 2009), in which three altitude zones were defined: zone I, 80 %-100 % of the maximum altitude of the area; zone II, 50 %-80 %, and zone III, 0 to 50 %. This index (A) serves to determine the structural diversity in the vertical distribution of the species and is estimated by the following formula:
Where:
S = Number of species present
Z= Number of altitude layers
p ij = Percentage of species in each zone, estimated with the following equation:
Where
n i,j = Number of individuals of the same species (i) in the zone (j)
N = Total number of individuals
Pretzsch’s index needs to be standardized for purposes of comparison; this is done using the A max value, estimated as follows:
Thus, the value of A can be standardized using this equation:
Richness and diversity were determined by Margalef’s index (D Mg ), which is based on the quantification of the number of species present (specific richness), and the Shannon-Wiener index (H´), based on the proportional distribution of the abundance of each taxon (Moreno, 2001). The values thus obtained were compared using the Student’s t-test of a single sample, which compared the mean value of the indexes estimated in this study with the reference value of other studies. Prior to the analysis, normality was verified using the Shapiro-Wilks test (Zar, 2010).
The structure of the community was described in terms of the abundance of each species using rank-abundance curves (Magurran, 2004). The Null, preemption, lognormal, Zipf and Mandelbrot models were tested. The parameters were estimated using the maximum likelihood method, and the selection of the best model was based on the Akaike Information Criterion (AIC) in terms of the lowest value. The analysis was carried out using the R software, version 3.2.1.2 (R Core Team, 2017), with the Vegan package (Oksanen et al., 2016) and with the support of the RStudio platform (RStudio Team, 2016).
Results and Discussions
Horizontal structure
Nine taxa belonging to an equal number of genera and family were registered. The assessed community exhibited an abundance of 2 187 N ha-1, with a basimetric area of 496.3 m2 ha-1. The species that exhibited the greatest abundance, dominance and frequency was Taxodium mucronatum Ten., with an IVI value of 52.4 %, followed by Platanus rzedowskii Nixon & J. M. Poole (IVI = 23.2 %) and Carya illinoinensis (Wangenh.) K. Koch (IVI = 8.8 %). These amounted to 84.4 % of the IVI of the community, while 15.6 % corresponded to the remaining six (Table 1).
Table 1 Abundance, dominance, frequency and importance value index (IVI) of the species registered in the study area.
| Species | Abundance | Dominance | Frequency | IVI | |||
|---|---|---|---|---|---|---|---|
| N ha-1 | % | m2 ha-1 | % | Sities | % | ||
| Taxodium mucronatum Ten. | 1 307 | 59.8 | 336.0 | 67.7 | 11 | 29.7 | 52.4 |
| Platanus rzedowskii Nixon & J. M. Poole | 547 | 25.0 | 73.7 | 14.8 | 11 | 29.7 | 23.2 |
| Carya illinoinensis (Wangenh.) K. Koch | 133 | 6.1 | 33.8 | 6.8 | 5 | 13.5 | 8.8 |
| Fraxinus berlandieriana A. DC. | 93 | 4.3 | 24.6 | 5.0 | 3 | 8.1 | 5.8 |
| Morus nigra L. | 27 | 1.2 | 11.0 | 2.2 | 2 | 5.4 | 2.9 |
| Celtis laevigata Willd. | 40 | 1.8 | 2.5 | 0.5 | 2 | 5.4 | 2.6 |
| Quercus virginiana Mill. | 13 | 0.6 | 9.5 | 1.9 | 1 | 2.7 | 1.7 |
| Caesalpinia mexicana A. Gray. | 13 | 0.6 | 5.1 | 1.0 | 1 | 2.7 | 1.4 |
| Citrus sinensis (L.) Osbeck | 13 | 0.6 | 0.1 | 0.0 | 1 | 2.7 | 1.1 |
| Sum | 2 187 | 100 | 496.3 | 100 | 37 | 100 | 100 |
Four genera (Carya, Platanus, Fraxinus, and Taxodium) are regarded as characteristic of this type of vegetation in Mexico (Enríquez-Peña and Suzán-Azpiri, 2011). Treviño et al. (2001) recorded 21 and 16 species for the tree stratum of two rivers in central Nuevo León, while Canizales et al. (2010) cited seven taxa along a river with different degree of anthropogenic disturbance in the same state. In such studies, as in the present work, Taxodium mucronatum is considered one of the most abundant species. In the research documented herein, unlike the previous ones, Platanus rzedowskii was observed to be abundant, while P. occidentalis L. was not.
Estrada-Castillón et al. (2013) registered both Platanus species at the Cumbres de Monterrey National Park and point out that these are usually associated with genera of boreal forests, including Quercus and Carya, as indicated in the present study. Likewise, Nixon and Poole (2003) mention that the two species occur very close to each other in certain riparian systems of northeastern Mexico and are the most conspicuous in this type of vegetal community in the temperate areas of the Eastern Sierra Madre.
Citrus sinensis - an exotic species widely used for the production of oranges in Allende- was calculated with a density of 13 N ha-1; therefore, its seeds dispersed by birds (Verea et al., 2009) have germinated in the study areas, despite their difficulty of access.
Total abundance was 2 187 N ha-1; in this regard, Canizales et al. (2010) estimated a total abundance of 970 N ha-1 for a gallery forest community with a low degree of anthropic disturbance; Burton et al. (2005) determined a value of 1 233 N ha-1 and a lower level of abundance for a community closer to an urban center (950 N ha-1) in southeastern United States. This indicates that the anthropogenic disturbance and the touristic activity registered by the authors affect the abundance of tree individuals, though to lesser degrees, as the gallery forest community analyzed in the present study was located in an area of difficult access exhibiting no apparent alteration.
According to the importance value index, Taxodium mucronatum registered 52 % and Platanus rzedowskii, 23.2 %. Canizales et al. (2010) mentioned T. mucronatum as having the highest ecological importance value index in three different anthropic disturbance conditions in the Ramos river, located in Allende, Nuevo León, but did not record P. rzedowskii. However, Treviño et al. (2001) cite P. occidentalis, followed by T. mucronatum, as the ecologically most important species for the same location, and T. mucronatum, with the highest IVI, followed by P. occidentalis and Populus wislizenii Sarg., in the Cabezones river.
Vertical structure
The maximum height for the trees in the present study was 15.5 m, based on which the stratification was performed in order to estimate the A-index. Stratum I (high) is formed by three species and was scarcely represented, by 9.15 % of the individuals and 12.08 % of the basimetric area. Stratum II (medium) was formed by six taxa and had the largest number of individuals (55.49 %) and basimetric area (68.76 %). Stratum III (low) consists of eight species, with 35.37 % of the individual and 19.16 % of the basal area (Table 2). The most abundant taxon in all the strata was Taxodium mucronatum, followed by Platanus rzedowskii; this indicates that the vegetal community exhibits the incorporation of individuals of the low stratum (III) that abound in the higher strata (I and II). The value of Pretzsch’s index was 2.03, with a A max of 3.29 and a A max of 61.87, indicative of an average structural diversity in the height strata, for the values close to 100 % imply that all the species are distributed equally between the three height strata (Mora-Donjuán et al., 2014; Rubio et al., 2014). It is important to mention that there is little literature where this index is used in relation to gallery forests.
Table 2 Values of Pretzsch’s vertical index for the study area.
| Species | Abundance | Dominance | ||||
|---|---|---|---|---|---|---|
| N ha-1 | Of the total | Of the stratum | m2 ha-1 | Of the total | Of the stratum | |
| Stratum I | ||||||
| Carya illinoinensis (Wangenh.) K. Koch | 13 | 0.61 | 6.67 | 0.85 | 0.17 | 1.42 |
| Platanus rzedowskii Nixon & J. M. Poole | 67 | 3.05 | 33.33 | 9.62 | 1.94 | 16.05 |
| Taxodium mucronatum Ten. | 120 | 5.49 | 60.00 | 49.49 | 9.97 | 82.53 |
| Total | 200 | 9.15 | 100 | 59.96 | 12.08 | 100 |
| Stratum II | ||||||
| Carya illinoinensis (Wangenh.) K. Koch | 67 | 3.05 | 5.49 | 24.59 | 4.96 | 7.21 |
| Celtis laevigata Willd. | 13 | 0.61 | 1.10 | 1.72 | 0.35 | 0.50 |
| Fraxinus berlandieriana A. DC. | 53 | 2.44 | 4.40 | 6.39 | 1.29 | 1.87 |
| Platanus rzedowskii Nixon & J. M. Poole | 240 | 10.98 | 19.78 | 35.04 | 7.06 | 10.27 |
| Quercus virginiana Mill. | 13 | 0.61 | 1.10 | 9.45 | 1.90 | 2.77 |
| Taxodium mucronatum Ten. | 827 | 37.80 | 68.13 | 264.11 | 53.21 | 77.38 |
| Total | 1 213 | 55.49 | 100 | 341.30 | 68.76 | 100 |
| Stratum III | ||||||
| Caesalpinia mexicana A. Gray. | 13 | 0.61 | 1.72 | 5.13 | 1.03 | 5.40 |
| Carya illinoinensis (Wangenh.) K. Koch | 53 | 2.44 | 6.90 | 8.35 | 1.68 | 8.78 |
| Celtis laevigata Willd. | 27 | 1.22 | 3.45 | 0.76 | 0.15 | 0.80 |
| Citrus sinensis (L.) Osbeck | 13 | 0.61 | 1.72 | 0.14 | 0.03 | 0.15 |
| Fraxinus berlandieriana A. DC. | 40 | 1.83 | 5.17 | 18.25 | 3.68 | 19.19 |
| Morus nigra L. | 27 | 1.22 | 3.45 | 11.02 | 2.22 | 11.59 |
| Platanus rzedowskii Nixon & J. M. Poole | 240 | 10.98 | 31.03 | 29.01 | 5.84 | 30.51 |
| Taxodium mucronatum Ten. | 360 | 16.46 | 46.55 | 22.43 | 4.52 | 23.59 |
| Total | 773 | 35.37 | 100 | 95.10 | 19.16 | 100 |
| Overall total | 2 187 | 100 | 300 | 496.36 | 100.00 | 300 |
Richness and diversity indexes
The diversity in the area was lower (H´ = 0.58) than that estimated by Canizales et al. (2010) in a gallery forest classified as the best preserved one in their study and exhibited no significant differences (t = -1.433, df = 14, p-value = 0.173). On the other hand, for the community with a degree of anthropogenic disturbance classified as alarming, these authors registered a lower value, but a significant difference (t = 3.711 df = 14, p-value = 0.002) with respect to the present study (Table 3).
Table 3 Comparison between Shannon-Wiener indices in gallery forest communities of various localities.
| Authors | H´ | t | df | p |
|---|---|---|---|---|
| Present study (Allende river, Nuevo León) | 0.58 | - | - | - |
| Canizales et al., 2010 (preserved Ramos river, Nuevo León) | 0.74 | -1.4332 | 14 | 0.1737 |
| Canizales et al., 2010 (disturbed river Ramos, Nuevo León) | 0.18 | 3.7115 | 14 | 0.002324 |
| Treviño et al., 2001 (Cabezones river, Nuevo León) | 2.67 | -19.164 | 14 | 1.92E-11 |
| Treviño et al., 2001 (Ramos river, Nuevo León) | 1.74 | -10.62 | 14 | 4.41E-08 |
| Burton et al., 2005 (Sand Creek 41.km distance from an urban center, USA) | 2.19 | -14.755 | 14 | 6.33E-10 |
| Burton et al., 2005 (Clines Branch 30.58 from an urban center, USA) | 2.92 | -21.461 | 14 | 4.13E-12 |
| Santiago et al., 2014 (La Fragua stream, Jalisco) | 1.8 | -11.172 | 14 | 2.33E-08 |
| Santiago et al., 2014 (Chiquito stream, Jalisco) | 2.6 | -18.521 | 14 | 3.04E-11 |
H´ = Value of the Shannon-Wiener index; t = Student’s t value, df = Degrees of freedom; p = p value.
As for the richmess of species, compared to that of Canizales et al. (2010), there are no significant differences in terms of the two conditions of the gallery forest analyzed by the authors (Table 4). According to Canizales et al. (2010), anthropogenic activity has a negative impact on the diversity and abundance of species; therefore, the values were lower in vegetal communities with greater anthropic disturbance. In relation to the study by Treviño et al. (2001) on the Cabezones and Ramos rivers, the diversity was greater than in the research documented herein; the statistical comparison indicated that there are significant differences with respect to the value registered in Allende, Nuevo León (Table 3). A comparison with the researches on gallery forests by Burton et al. (2005), in an urbanization gradient, and by Santiago et al. (2014), in an altitude gradient, shows the existence of a statistical difference with regard to the diversity observed in this study; the former two recorded higher values (Table 3).
Table 4 Comparison between Margalef’s indexes of gallery forest communities of various localities.
| Author | D Mg | t | df | p |
|---|---|---|---|---|
| Present study (Allende river, Nuevo León) | 1.52 | - | - | - |
| Canizales et al., 2010 (preserved Ramos river, Nuevo León) | 0.44 | 1.422 | 14 | 0.176 |
| Canizales et al., 2010 (disturbed Ramos river, Nuevo León) | 0.5 | 0.897 | 14 | 0.384 |
D Mg = Value of Margalef’s index, t = Value of Student’s t, df = Degrees of freedom; p = Value of p.
The Margalef’s index determined by the present research is three times higher than the one documented by Canizales et al. (2010); yet, no significant differences resulted with respect to either the preserved (t = -1.422, df = 14, p-value = 0.176) or the disturbed (t = 0.897, df = 14, p-value = 0.384) vegetal community.
Species’ rank-abundance curve
Figure 1 shows the rank-abundance curve for all the species registered in the vegetation samples. This curve is graphically adjusted to the Mandelbrot (AIC=40.83), Preemption (AIC=41.80) and Lognormal (AIC=42.80) distributions, but not to the Null distribution (AIC=119.75). Therefore, the abundance of species in the area may be described by the Mandelbrot, Preemption and Lognormal models, as the distribution of species adjusts to these, both graphically and analytically. However, the best fit was for the Mandelbrot model. According to it, one or a few taxa are highly abundant and predominant in the vegetal community, as well as at the initial stages of the succession (Magurran, 2004). This model has been regarded as one of the best for describing the distribution of the abundance of species (Fischer et al., 1943).
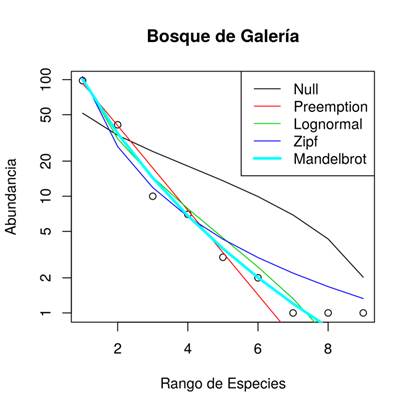
Abundancia = Abundance; Rango de especies = Species´rank
Figure 1 Species’ rank-abundance curve for the gallery forest and functions adjusted to this curve.
The Preemption model, also known as preferential niche or geometric series model, had a slightly smaller adjustment than the previous one; this implies that a few abundant species are present in a large proportion on one part of the hyperspace of the niche, and therefore, their occurrence varies with those situations in which the habitat is sequentially occupied (Aguirre et al., 2008). Alanís-Rodríguez et al. (2017) observed that the geometric model was the one that best adjusted to a mesquite forest in central Nuevo León, in northeastern Mexico. The authors suggested that this is a typical structure for a severely disturbed environment. However, the studied community is not subjected to a severe disturbance; therefore, the Mandelbrot model, with a better fit, is the one that best describes the community, since the species analyzed in the gallery forest respond to specific factors that determine the ecology of the community, including environmental factors like geomorphology, the water flow or organic matter flow, or biological factors of its own, such as a rapid growth and being shade-intolerant.
Enríquez-Peña and Suzán-Azpiri (2011) point out that the elements that affect the reproductive growth of Taxodium mucronatum Ten. include the availability of water, the fertility of the soil and pollution. Likewise, one of the characteristics of T. mucronatum is its rapid growth (Rolston, 2001), which is important for its development at the initial stages of the natural succession; furthermore, the species is shade-tolerant during the first stages of its life (Conafor, 2018). In the case of the Platanus genus, its intolerance to shade may cause mortality to increase at the germination stage under advanced successional conditions, since it has a high crown coverage (Conabio, 2018), but germinates and develops adequately in areas with little coverage (Carranza, 1994).
Conclusions
The study area exhibits high abundance compared to the gallery forest with some type of anthropic disturbance, which may indicate the good conservation status of the riparian community. According to the vertical structure, the dominance in the low and middle strata of T. mcronatum and P. rzedowskii indicates that there is an incorporation of individuals in the first stages of life and regeneration in the community. The richness and diversity are slightly smaller than that of other riparian communities, even when located near the area, but larger than that of sites with a high degree of disturbance due to tourism. The Mandelbrot model showed the best fit in terms of the abundance of species, which is determined by various factors.
Acknowledgements
The authors thank the Graduate School of Forest Studies of the Universidad Autónoma de Nuevo León (UANL) for the facilities provided for the accomplishment of field work.
REFERENCES
Aguirre C., O. A., J. Corral-Rivas, B. Vargas L. y J. Jiménez P. 2008. Evaluación de modelos de diversidad-abundancia del estrato arbóreo en un bosque de niebla. Revista Fitotecnia Mexicana 31(3): 281-289. http://www.redalyc.org/articulo.oa?id=61031312 (29 de septiembre de 2019). [ Links ]
Alanís-Rodríguez, E., V. M. Molina-Guerra, J. Jiménez-Pérez, E. A. Rubio-Camacho, A. Mora-Oliva, A. Collantes-Chávez-Costa and J. J. Marroquín-Castillo. 2017. Composition, structure and diversity of a mesquite in Pesquería (Northeastern Mexico). Revista Chilena de Historia Natural 90:4. Doi: 10.1186/s40693-017-0066-1. [ Links ]
Belsky, A. J., A. Matzke and S. Uselman. 1999. Survey of livestock influences on stream and riparian ecosystems in the western United States. Journal of Soil and Water Conservation 54: 419-431. https://pdfs.semanticscholar.org/7439/94722c6326433a10044898eabd0bcab3f4b3.pdf (10 de agosto de 2019). [ Links ]
Burton, M. L., L. J. Samuelson and S. Pan. 2005. Riparian Woody plant diversity and forest structure along an urban-rural gradient. Urban Ecosystems 8: 93-106. Doi: 10.1007/s11252-005-1421-6. [ Links ]
Canizales V., P. A., G. J. Alanís F., S. Favela L., M. Torres M., E. Alanís R., J. Jiménez P. y H. Padilla R. 2010. Efecto de la actividad turística en la diversidad y estructura del bosque de galería en el noreste de México. Ciencia UANL 13(1): 55-63. https://dialnet.unirioja.es/descarga/articulo/3110999.pdf (19 de julio de 2019). [ Links ]
Carranza, E. 1994. Flora del Bajío y de regiones adyacentes: fascículo 23. Familia Platanaceae. Xalapa: Instituto de Ecología. Veracruz, Ver. México. 7 p. http://www1.inecol.edu.mx/publicaciones/resumeness/FLOBA/Flora%2023.pdf (5 de julio de 2018). [ Links ]
Comisión Nacional Forestal (Conafor). 2018. SIRE Paquetes Tecnológicos. Taxodium mucronatum. http://www.conafor.gob.mx:8080/documentos/docs/13/1011Taxodium%20mucronatum.pdf (15 de agosto de 2018). [ Links ]
Comisión Nacional para el Conocimiento y Uso de la Biodiversidad (Conabio). 2018. Platanus mexicana. http://www.conabio.gob.mx/conocimiento/info_especies/arboles/doctos/56-plata1m.pdf (14 de agosto de 2018). [ Links ]
Enríquez-Peña, E. G. y H. Suzán-Azpiri. 2011. Estructura poblacional de Taxodium mucronatum en condiciones contrastantes de perturbación en el estado de Querétaro, México. Revista Mexicana de Biodiversidad 82(1): 153-167. Doi: 10.22201/ib.20078706e.2011.1. [ Links ]
Estrada-Castillón, E., J. A. Villarreal-Quintanilla, M .M Salinas-Rodríguez, H. Rodríguez-González, J. Jiménez-Pérez and M. A. García-Aranda. 2013. Flora and phytogeography of Cumbres de Monterrey National Park, Nuevo Leon, Mexico. Journal of the Botanical Research Institute of Texas 7(2): 771-801. http://www.jstor.org/stable/24621163 (4 de abril de 2019). [ Links ]
Fischer, R. A., A. S. Cobert and C. B. Williams. 1943. The relation between the number of species and the number of individual in a random simple of an animal population. Journal of Animal Ecology 12: 42-58. Doi: 10.2307/1411. [ Links ]
García, E. 1988. Modificaciones al Régimen de Clasificación Climática de Köppen, México. Instituto de Geografía. Universidad Nacional Autónoma de México. México, D. F., México. 90 p. http://www.igeograf.unam.mx/sigg/utilidades/docs/pdfs/publicaciones/geo_siglo21/serie_lib/modific_al_sis.pdf . (2 de agosto de 2018). [ Links ]
Granados-Sánchez, D., M. A. Hernández G. and G. F. López R. 2006. Ecología de las zonas ribereñas. Revista Chapingo Serie Ciencias Forestales y del Ambiente 12(1): 55-69. https://chapingo.mx/revistas/en/forestales/contenido.php?section=article&id_articulo=450&doi= (28 de junio de 2019). [ Links ]
Lees, A. C. and C. A. Peres. 2007. Conservation value of remnant riparian forest corridors of varying quality for amazonian birds and mammals. Conservation Biology 2(1): 1-11. Doi:10.1111/j.1523-1739.2007.00870.x. [ Links ]
Magurran, A. E. 2004. Measuring biological diversity. Blackwell. Cambridge, MA, USA. 215 p. [ Links ]
Martínez M., A., I. Cantú S. y R. Aranda R. 2003. El medio ambiente y los recursos naturales de Nuevo León. Ciencia UANL 6(1): 3-4. http://www.redalyc.org/pdf/402/40260101.pdf (10 de junio de 2019). [ Links ]
Mora-Donjuán, C. A., E. A. Rubio-Camacho, E. Alanís-Rodríguez, J. Jiménez-Pérez, M. A. González-Tagle, J. M. Mata-Balderas y A. Mora-Olivo. 2014. Composición y diversidad vegetal de un área de matorral desértico micrófilo con historial pecuario en el noreste de México. Polibotánica 38: 53-66. http://www.polibotanica.mx/pdf/pb38/deser.pdf (10 de septiembre de 2019). [ Links ]
Moreno, C. E. 2001. Métodos para medir la biodiversidad. Manual y tesis SEA. CYTED, UNESCO (ORCYT) y SEA. Vol. 1. Pachuca, Hgo., México. 83 p. http://entomologia.rediris.es/sea/manytes/metodos.pdf (16 de julio de 2018). [ Links ]
Müeller-Dombois, D. and H. Ellenberg. 1974. Aims and methods of vegetation ecology. John Wiley and Sons. Nueva York, NY, USA. 547 p. [ Links ]
Naiman, R. J. and H. Décamps. 1997. The ecology of interfaces: riparian zones. Annual Reviews of Ecology and Systematics 28: 621-658. Doi: 10.1146/annurev.ecolsys.28.1.621. [ Links ]
Nixon, K. C. and J. M. Poole. 2003. Revision of the Mexican and Guatemalan species of Platanus (Platanaceae). Lundellia (6): 103-137. http://hdl.handle.net/2152/32766 (16 de julio de 2018). [ Links ]
Oksanen, J., F. G. Blanchet, M. Friendly, R. Kindt, P. Legendre, D. McGlinn, P. R. Minchin, R. B. O´Hara, G. L. Simpson, P. Solymos, M. H. H. Stevens, E. Szoecs and H. Wagner. 2016. Vegan: Community Ecology Package. RStudio Team, 2016. Rstudio: Integrated Development for R. (Online) RStudio, Inc. Boston, MA, USA. https://rstudio.com/ RStudio, Inc., Boston, MA. Doi: 107.007/978-81-322-2340-5 [ Links ]
Poff, B., K. A. Koestner, D. G. Neary and D. Merritt. 2012. Threats to western United States riparian ecosystems: A bibliography. United States Department of Agriculture/Forest Service. Fort Collins, CO, USA. https://www.fs.fed.us/rm/pubs/rmrs_gtr269.pdf (16 de julio de 2018). [ Links ]
Pretzsch, H. 2009. Forest Dynamics, Growth and Yield. From Measurement to Model. Springer-Verlag. Heidelberg, Germany. 664 p. [ Links ]
R Core Team. 2017. R: A Language Environment Statistical Computing. 55:275-286. https://www.R-project.org (28 de septiembre de 2018). [ Links ]
Rolston, S. H. 2001. Seed coat treatments influence germination of Taxodium mucronatum. Desert Plants 17(1): 15-18. http://hdl.handle.net/10150/554341 (18 de julio de 2018). [ Links ]
RStudio Team. 2016. RStudio: Integrated Development for R. (Online) RStudio, Inc. Boston, MA, USA. Doi: 10.1007/978-81-322-2340-5. [ Links ]
Rubio, E. A., M. A. González, J. Jiménez, O. A. Aguirre y D.Y. Ávila. 2014. Distribución vertical de especies de Bosques Montanos de la Sierra Madre Oriental de México. Instituto Nacional de Investigaciones Forestales, Agrícolas y Pecuarias. Mérida, Yuc., México. 84 p. [ Links ]
Santiago, A. L., A. Ayón-Escobedo, V. C. Rosas-Espinoza, F. A. Rodríguez y S. L. Toledo. 2014. Estructura del bosque templado de galería en la sierra de Quila, Jalisco. Revista Mexicana de Ciencias Forestales 5(24): 144-159. https://www.redalyc.org/pdf/634/63439010012.pdf (25 de septiembre de 2019). [ Links ]
Treviño, E. J., C. Cavazos, C. y O. A. Aguirre. 2001. Distribución y estructura de los bosques de galería en dos ríos del centro sur de Nuevo León. Madera y Bosques 7(1): 13-25. Doi:10.21829/myb.2001.711315. [ Links ]
Verea, C., M. A. Araujo, L. Parra y A. Solórzano. 2009. Estructura de la comunidad de aves de un monocultivo frutícola (naranjo) y su valor de conservación para la avifauna: estudio comparativo con un cultivo agroforestal (cacao). Memoria de la Fundación La Salle de Ciencias Naturales 172: 51-68. [ Links ]
Whittaker, R. H. 1972. Evolution and measurement of species diversity. Taxon. 21: 213-251. Doi: 10.2307/1218190. [ Links ]
Zar, J. H. 2010. Biostatistical analysis, 5ta ed. Prentice Hall. Upper Saddle River, NJ, USA. 944 p. [ Links ]
Received: June 12, 2019; Accepted: January 15, 2020
 Este es un artículo publicado en acceso abierto bajo una licencia
Creative Commons
Este es un artículo publicado en acceso abierto bajo una licencia
Creative Commons
